
¶ eBook Formats
::: center
Climate & Architecture
:::
::: titlepage
Climate & Architecture
Progressive Architecture Book
Jeffrey Ellis Aronin
Reinhold Publishing Corporation | New York
ISBN: 978-0000000000
ISBN-10: 0000000000
Updated: 2024-11-05
:::
::: flushleft
REINHOLD PUBLISHING CORPORATION
Printed in U. S. A.
Library of Congress Catalog Card Number: 53-9171
Copyright
All rights reserved. No part of this book may be reproduced or transmitted in any form or by any means, electronic or mechanical, including photocopying, recording, or by any information storage and retrieval system, without permission in writing from the Copyright Holder.
ENCODED IN THE UNITED STATES OF AMERICA
:::
¶ Introduction
INTRODUCTION
the architect, who is he and why
“He is a relentless observer. He is always active and effective in the investigation of Nature. “He sees that all forms of nature are interdependent and arise out of each other, according to the laws of Creation.
“In his every design a bit of Nature enters into a building.
“His perceptions (insight) science later verifies.
“Intimacy with Nature is the great friendship.
“He sees ideas as also manifest actions of Nature.
“It is the poet in him that is the great quality in him.
“The profound naturalness of his own being is the essential condition of a great architect and the condition of greatness in the man.
“Expect from him a system of philosophy and ethics which is a synthesis of society and civilization.” (Copyright 1949 by Frank Lloyd Wright)
Wright is right, but architects must need for their professional work some knowledge of
sociology sculpture mechanical engineering painting woodwork electrical engineering public health geography plumbing landscaping civil engineering city planning office administration law design physics sanitation accounting and, besides many other items, climatology and microclimatology.
Actually, the architect has been a climatologist much longer than he has been an expert of the other disciplines listed. Yet very rarely does one see mention made of this role of the architect. Little training in this line is given the university student although it has long been recognized that good architecture must be concerned with air: the air of the outdoors, close to the ground and high in the sky, which helps to make the climate we live in. The designing and orienting of buildings with respect to climate is an old art; many years ago primitive peoples learned by trial and error the influences of weather in their dwelling designs. But it is at the same time a lost art that modern man does not know. We have had to develop a new science, which I have dubbed airchitccture. I believe this is the first occasion that anyone has treated this new science completely, presenting in one volume the many ways that climate can influence building design.
The object of this book, therefore, is to acquaint architects, architectural students, engineers, city planners, builders, present and prospective home owners, and others—especially those in North America—with the demands and phenomena of the large- and small-scale climate, known respectively as the macroclimate and the microclimate; and to inform them how to apply this knowledge to the design and orientation of buildings and towns. The purpose is not to discuss the use of different materials and their weathering qualities, except in a general sense.
This volume, it is hoped, will be of interest not only to architects, engineers, city planners, builders, climatologists, and other professionals and students, but also to the layman— to the man now living in or proposing to build or live in his own house. The work may be used as a text or a reference or, written as it is in a light vein, for ordinary reading. The index, being as complete as possible, is quite useful, as is the bibliography, which has been prepared carefully, with a short review accompanying each listing.
The various arguments are presented in logical sequence, so that the reader is relieved of the necessity of flipping back and forth between the text and appendices. Although the several elements of the weather are discussed separately for convenience and continuity, the reader should not interpret the remarks of one chapter in a fashion which would ignore the significance of factors outlined in other chapters. When considering any point, one should not overlook the over-all aspect of the situation.
American preferences in grammar and spelling have been employed in this work. However, unless translated, all quotations, titles of organizations, etc., have been copied exactly as in the original.
There are numerous credits for quotations and photographs, which are indicated in a section in the rear. However, I wish particularly to thank at this point Professor John Bland, B.Arch., A.R.I.B.A., M.R.A.I.C., A.M.P.T.I., and Professor F. Kenneth Hare, B.Sc., Ph.D., directors, respectively, of the Architecture and Geography Departments, McGill University, for their very valuable comments and advice; and my sister, Miss Isobel Joy Aronin, A.B. (Vassar), who, by helping, magically turned into hours of enjoyment the arduous tasks of proofreading and indexing. Also, I am grateful to Mr. William W. Atkin and to Miss Joan Welsh for their very fine cooperation and to Mr. Stamo Papadaki for designing the distinctive format.
Jeffrey Ellis Aronin Woodmere, New York
16 August 1953
Jeffrey Ellis Aronin
CLIMATE


ARCHITECTURE
PROGRESSIVE ARCHITECTURE BOOK
Climate and Architecture
presents a new approach to an old problem. Through the centuries men have faced, and sometimes solved, the problem of designing buildings that are in harmony with the climate. But here, for the first time, all the elements of climate are described in full, acquainting the reader with the limitations imposed by the climate.
The author has gathered together the latest, most pertinent, and most helpful information, including charts and graphs, from widely-scattered sources. He has augmented this information with the findings of his own investigations in the field. He has described in full detail the physics of the influences of the sun, temperature, wind, precipitation, lightning, and humidity upon architecture as well as their beneficial and disadvantageous effects under given conditions, their control through the orientation of buildings, site and town planning, and the use of such devices as brise-soleil, trees, windbreaks, and snow fences. The result is a well-planned book, filled with 55 tables and more than 300 illustrations, which presents the problems and the solutions clearly, logically, and pictorially.
The practical solutions to such problems as how to pick a site, how to avoid snow-shoveling chores, how to keep a dry basement and a dry area around the house, how to install lightning rods, how to sleep comfortably on hot summer nights, and how to plant the best trees and vines for comfort, protection, and beauty, are not only invaluable to architects and students but hold great appeal for present and prospective homeowners, gardeners, campers, real estate investors, town planners, and civic officials. All may profit from this book, the first to do something about the weather.
CLIMATE & ARCHITECTURE
Jeffrey Ellis Aronin

ARCHITECTURE
PROGRESSIVE ARCHITECTURE BOOK
REINHOLD PUBLISHING
CORPORATION
U. S. A.
NEW YORK
Copyright 1953 by
¶ BACKGROUND
“Houses are built to live in, not to look on; therefore, let use be preferred before uniformity, except where both may be had.”
Bacon, Essays. Of Building
.4 Synagogue designed functionally and aesthetically. Kinetl and Myers, Architects.
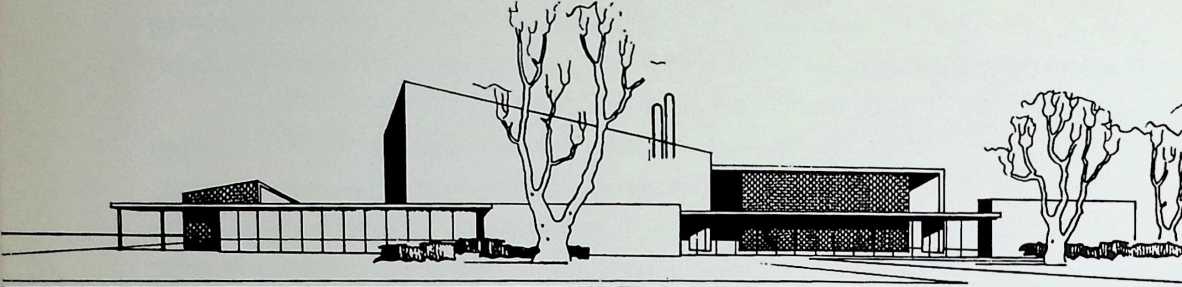
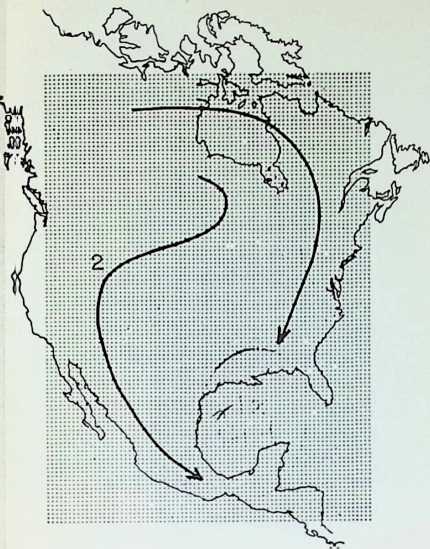
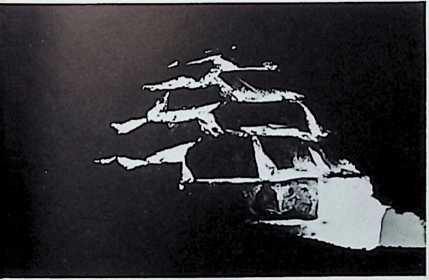
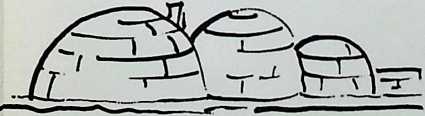
Figure 1. Arrows indicate “itinerary” of discussion of North America.
Figure 2. Trail or overnight igloo illuminated from the inside. Coppermine, Northwest Territories.
Figure 3
Sullivan’s “form follows function” concept had a precedent not only in the above quotation, but in the works of man throughout the centuries. The shape of buildings has been greatly influenced by the requirements of climate; it has become, as Ruskin said, “an art for all men to learn because all are concerned with it.”
History may provide some valuable lessons. Consequently, a brief treatise on man’s architectural achievements through time is not an unimportant part of this book.
Most North Americans rarely see any, but there are Indians and Eskimos on this continent.
To the far north the Eskimo lives. How is the climate reflected in his buildings? He invariably selects a sheltered spot for his habitations, which he constructs of snow and ice. J. W. Bilby in Among Unknown Eskimo describes how the Eskimos group their igloos closely together, all usually in the shelter of some rocks. The windproof qualities of these dwellings and the primitive oil stoves inside maintain comfortable quarters for the family group. Several igloos, serving various family functions, are usually interrelated and connected to one another by interior passages. The one main entrance serves the entire unit and is designed to act as a buffer against the elements; the okkotak, or screen, shields the doorway, and the szikso, or porch, becomes a transition zone between the exterior and the principal unit.
In the material available on Eskimo architecture there is no mention of the orientation of the doors. They are probably placed on the side parallel to the prevailing winds; this would no doubt be the best, for it would be a fair compromise between the disadvantages of snow-drift accumulation leeward and the direct wind to the windward side. But some authorities have other opinions: Professor F. Kenneth Hare of McGill University does not think it would make much difference on which side the door is placed, since it is usually buried in the snow in consideration of the fierce climate. Colonel P. D. Baird, who is Director of the Montreal office of the Arctic Institute of North America and therefore very familiar with Arctic matters, could not recall that the natives of the North ever placed their entrances parallel to the wind. And Mr. George Jacobsen, a pioneer of building development in frozen waste lands, also maintains that Eskimos are influenced more by the availability of suitable snow than by other microclimatic considerations.
J. W. Bilby, in describing other construction practices of the Eskimos, notes that “fight is a necessity but the Eskimo is scarcely particular about ventilation. . . .A square opening is cut high up in the dome of the igloo, facing the sleeping bench. It is then glazed after the fashion of the Arctics. The builder sets off for the nearest sheet of fresh water ice and with the butt end of his sealing spear shivers out a good thick pane of it. This he places over the hole in the roof, packing its edges round with half melted snow, and pouring water over the packing. In two minutes everything is frozen airtight and solid, and a window of flawless ice lets the illumination of the northern night into the pure and icy chamber
of the newly made house.” Speaking of the interior construction of the igloo, Bilby says: “Finally the interior has to be glazed. While the householder himself has been busy more or less within the building, on the outside the old men and the woman have been set the task of packing every joint and crevice in the snow masonry with loose snow, so as to make it absolutely wind tight. Now comes the moment when the doorways, too, are closed and every entrance blocked. Two lamps, well trimmed and well supplied with oil, have been carefully lit and left burning inside. . . . As the lamps burn slowly away, the temperature rises and all the surface of the snow is lightly melted. As the lamps die out the temperature falls again and the surface freezes to glass-like smoothness. Every asperity of the sawn blocks of snow is annealed, and the dwelling is as proof against draught as the inside of a bottle. Water, too, is thrown on the floor, to make it smooth as marble and as durable as cement.”
Graham Rowley in The Polar Record explains how the chimneyhole is placed: “Towards the centre of this (the top) block a hole is bored with the snow knife to act as a chimney. If the hole were made at the side of the block melting would take place along the seams and the block would be likely to be loosened. If a strong wind is blowing the hole should be made in the centre of one of the upper blocks on the sheltered side of the house. . . .It is also convenient to construct a cache to keep the dog food, harness and traces out of reach of the dogs. . . .If there is a strong wind one or two blocks should be placed along the windward side of the trough entrance to prevent it drifting up.”
During the few Arctic months when the snow is not on the ground, the Eskimo provides a tupik, or tent, for himself by stretching seal skins over a frame of driftwood. The dark hides have the dual advantage of obstructing the midnight sun during the sleeping hours and of shedding the rain.
In the Mackenzie River area and Alaska, according to Professor Fred Voget of the Department of Sociology, McGill University, the Eskimos build semi-subterranean structures of wood. They are so placed as to minimize the effects of the winds in this region, which are severe, although not as bitter as in other parts of the Arctic.
The Eskimo’s neighbors, the Indians, deal with the climate in similar fashion. A. Hyatt Verrill in The American Indian describes their rectangular, bark-covered and gable-roofed dwellings, their dome-shaped, barked wigwams, and their portable dome-shaped wigwams covered with mats. These have the same weathering qualities as indicated for the Eskimo tents. Voget notes that the doors faced east in the more southerly regions. Because of prevailing westerly winds, it seems possible that this practice was not founded merely on religious or superstitious grounds.
Verrill points out that farther south, in New England, the dwellings of the Eastern Algonquins were of three types: a dome-shaped wigwam covered with bark slabs, rush mats, or grass thatch; a rectangular gable-roofed house made of bark slabs sewed to a framework of poles; and a rectangular house with an arched roof. The “architectural-climatic”
import of this, as indicated by Voget, is that the bark and mats can be adjusted as desired to admit or obstruct the passage of air. Thus they are readily adaptable to the vagaries of the weather.
 David I. Bushnell, Jr., in Native Villages and Village Sites East of the Mississippi quotes several early observers of Indian dwellings. Daniel Gookin, writing on December 7, 1674, described the Indian dwellings of New England as follows: “They keep the doors into the wigwams always shut, by a mat falling thereon, as people go in and out. This they do to prevent air coming in, which will cause much smoke in windy weather. If the smoke beat down at the lower hole, they hang a little mat in the way of a screen, on top of the house, which they can with a cord turn to the windward side, which prevents the smoke.” This evidently had been an advancement on the smoke-control devices of the Powhatan Confederacy in Virginia. Strachey, writing in 1607, said, “Every house commonly hath two doores, one before and a posterne. The doores be hung with matts, never locked nor bolted, but only those matts be to turn upp, or lett fall at pleasure; and their howses are so commonly placed under covert of trees, that the violence of fowle weather, snowe, or raine cannot assalt them, nor the sun in summer annoye them; and the roofe being covered, as I say, the wind is easily kept out, insomuch as they are as warm as stoves, albeit very smoakey.”
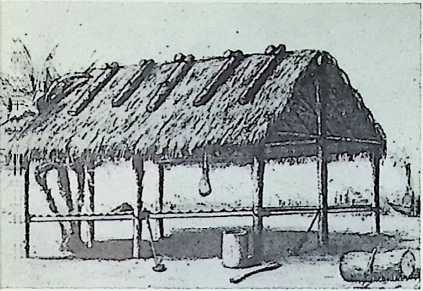
Figure 4. American Indian shelter.
Towards the Gulf States the tendency was to construct dwellings that were still more open and with many square feet of removable bark surface; in the Florida Everglades optimum conditions for admitting the breeze were provided by constructing the house on piles and leaving the sides quite open. MacCauley described a typical Seminole house standing in the year 1880 as measuring about 16 feet in length and 9 feet in width. The shelter was really nothing but a platform, about three feet from the ground, with a palmetto thatched roof. The roof was some 12 feet from the ground at the ridge pole and 7 feet at the eaves. Eight upright palmetto logs, unsplit and undressed, supported the roof, and rafters held the palmetto thatching. The house was open on all four sides, and it was not divided into rooms by any partitions. Bushnell comments that these simple covered platforms were well suited to the climate and environment of the everglades.
The habitations of the people of the Northwest have been described by Peter Grant, a member of the Old Northwest Company and for a long time at the head of the Red River Department of the Company. In an account which he prepared on the Sauteux Indians, he wrote that smoke, which was intolerable in stormy weather, was easily removed by contracting or shifting the aperture at the top of the shelter according to the wind direction. And, referring to an Indian encampment amongst the islands of Lake Huron, he noted that besides the openings between the loosely placed sheets of bark through which the wind entered, an open space at the top was intentionally left as a vent through which the smoke could escape. Maximilian, writing in 1833 of another tribe, said: “The tents of the Sioux are high pointed cones, made of strong poles, covered with buffalo skins, closely sewed together. . . .At the top, where the poles meet, or cross each other, there is an opening to let out the smoke, which they endeavour to close by a piece of skin covering of the tent, fixed to a separate pole standing upright, and fastened to the upper part of the covering on the side from which the wind blows. The door is a slit, in the front of the tent, which is generally closed by another piece of buffalo hide, stretched upon a frame.” Furthermore, Fletcher and LaFlesche noted that in the skin tipi of the Omaha (which word, incidentally, means “those going against the wind or current”) the opening usually faced the east.
By observing the small-scale deviations in the weather within short distances, the Indians avoided the necessity of flying south, like the swallows in winter, to seek a more favorable climate. On this point Fletcher and LaFlesche state: “The tent [of the Omaha] was used when the people were migrating, and also when they were travelling in search of the buffalo. It was also the favorite abode of a household during the winter season, as the earth lodge was generally erected in an exposed situation, selected on account of comfort in the summer. The tent could be pitched in the timber or brush, or down in wooded ravines, where the cold winds never had full sweep.”
When white man first stepped on the shores of North America, he adapted himself to the climate, as did the Indians. The European settler, who was used to constructing dwellings in well-established villages in the Old World and employing different materials, now had to adapt himself to a completely new environment. But the result was a better expression of the influence of climate on design than is much of the architecture we see today.
Champlain described in his Voyages how he and his men transported the woodwork of the Ste. Croix houses to Port Royal, twenty-five leagues away, where the climate was more agreeable and temperate. Here, evidently, they recognized the advisabilities of a sheltered site.
The Venerable Mere Marie de L’Incarnation wrote in 1641: “In answer to what you wish to know about the country, I can tell you that there are houses of stone, of wood and of bark. Ours, which is entirely of stone, is ninety-two feet long and twenty-eight broad. It is the finest and the largest in Canada as houses are built here. In this is included the Church, which has its length in the breadth of the house and is seventeen feet broad. You may think that small, but the excessive cold does not admit us to make larger spaces. Our fireplace is at the end to heat the dormitory and the cells, of which the partitions are only of pine wood for otherwise we could not heat them. . . .Our beds are of wood and shut up like cupboards. . . .In winter our Indians leave their stone houses and live in cabins in the woods, where it is not so cold.” Ramsey Traquair remarks further on this in his book, The Old Architecture of Quebec: “Walls were usually of field rubble, water worn stones bedded deeply in lime mortar. Such walls had to be thick for stability and we find them from two to four feet thick according to the size of the building. Such
walls give good protection. They are cool in summer, and in winter, once warmed, they retain heat for a long time. But if a rubble wall is exposed to the alternate frosts and thaws of a Canadian winter, the mortar will be forced out, the interior of the wall will get wet and the whole wall will disintegrate. To guard against this it was a common practice to cover the outside of a stone wall with wood boarding, particularly on the exposed north and east sides. The boarding kept the stone dry and a dry wall is immune to frost. This very practicable device is referred to by Pierre Boucher, and may be seen on a large scale, today on the Hopital General at Quebec.” A very interesting development in Quebec architecture is noted by Traquair as follows: “Today we associate deep eaves with the Quebec cottage, yet the oldest houses, the Ferme St. Gabriel or Batiscan, had only very small eaves. The wide eaves are undoubtedly a late development, they were not derived from French Mediaeval architecture as has often been asserted. Quebec has a sunny climate. To suit this the eaves of the roof grew farther and farther out to shade the walls and their occupants. These unsupported eaves sometimes stretch out some four feet from the wall and this necessarily led to the large bellcast at the bottom of the roof. This is not a good snow form since snow tends to collect at the change of slope, but it is unavoidable if the deep eaves are required. . . .Mr. C. E. Peterson, who has made a study of these houses, believes that the verandahs were introduced from Louisiana and the West Indies. Our Quebec verandahs may possibly have come by this route. The verandah is eminently a feature of a dry and sunny climate; once introduced into Quebec, verandahs were added to numberless old houses whose original design did not include them. They gave shelter from the sun in summer and to some degree from the snow in winter. In Quebec snow lies for several months to a depth of four feet or so, and provision must be made for it. Houses were accordingly placed as near the road as possible, and the floor was raised some three or four feet above the ground with a gallery along the front and back or, at least, a platform at the door with steps leading up to it. This snow gallery is a feature of the French Canadian house and it combined very easily with the wide eaves to form a verandah.”
Traquair refers to the school-house at Parc Laval with its snow platform at the front and to the school-house at Oka, which has wide- spreading eaves and a snow platform and stair to the front door. Horace Miner in St. Denis, A French-Canadian Parish describes a Quebec village as follows: “Houses are adapted to meet the rigors of winter. Those along the ridge crowd up to its protecting southern edge. On the more exposed plain, houses have their doors on the south side to avoid the force of the strong north -wind. This location of doors means that houses south of the chemin have doors which do not open on the road. If there are doors to the north, they remain sealed shut all the winter. The large kitchen is the most continually occupied room in the house. It is usually located on the southern side of the building, while the small formal salon is often to the north. Storm-doors or built-on entries are put on the houses. Because the kitchen is the center of the social life in the house, airy summer kitchens, which do not retain the heat of the stove, are built onto the sides of the houses. Too exposed to be warm, these annex kitchens are evacuated in winter.” The effects of various orientations were thus distinctly recognized by the habitants.
Turning south, we see that the pilgrims to the New World had no choice but to make the best of the climate there. Edward Johnson, writing in 1653, informs us that the settlers had to “burrow themselves in the Earth for their first shelter under some hillside, casting the Earth aloft upon timber; they make a smoky fire against the Earth on the highest side [note the siting here]; and thus these poor servants of Christ provide shelter for themselves, their wives and little ones, keeping off the short showers from their lodgings, but the long rains penetrate through to their great discomfort in the night season.” Nearly 300 years later James Marston Fitch wrote: “It is still not generally recognized that if the Pilgrims had landed on a near-by planet instead of the New England coast, they could scarcely have made a more abrupt switch in thermal environments. In Plymouth, England, they left a moderate climate with a very stable temperature, without extremely cold winters or very hot summers; snows and draughts were rare; tornadoes and cyclones unknown. In Plymouth, Massachusetts, they found a thermal environment whose annual cycle was far more severe, with a temperature spread from July to December more than twice as great as in Plymouth, England. They found also heavy snowfalls, long freezes, enormous gales. The heat of the New England summers, though doubtless uncomfortable to the settlers, was not actually dangerous to their health. They could always sit down in the shade. But the severity of the winters, with the consequent need for adequate heating sources, was a far different matter. The urgency of this problem is attested by their early buildings, the most characteristic feature of which was the huge chimney with its fireplaces.”
Talbot Hamlin in Architecture Through the Ages notes the adjustments made in roof construction as a result of the climate. The many gables on the old houses were originally intended to provide light in the attic, but because of the blazing summer sun and the violent winter winds, the attic rooms, unprotected and unheated, were uninhabitable and therefore useless during much of the year. Also, very likely it was difficult to make the joints in the many-gabled roof construction watertight. Gradually the front gables were taken off and only the single gable running the length of the house was retained.
Thomas Jefferson’s diaries abound in keen observations, many of which are of pertinence in this discussion. Fitch notes his horizontally- pivoted windows which, when opened, would “admit air and not rain.” Jefferson also recognized microclimatic differences near Monticello. He wrote in 1781 in his description of Virginia: “On the higher parts of mountains, frosts do not appear so early by a considerable space of time in the autumn, and go off sooner in the spring than on the plains. I have known frosts so severe as to kill Hickory trees round about Monticello,
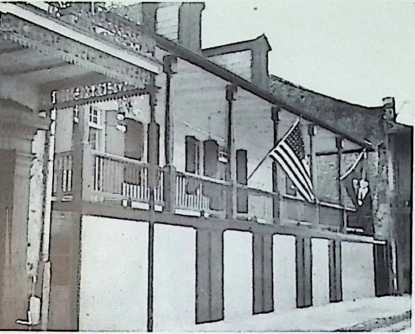
and yet not injure the tender fruit blossoms there in bloom on the top and higher parts of the mountain.” In the South, we also find, as Fitch has suggested, that the French, adapting their architecture to the subtropic climate, produced the stilted first floor and long gallery seen in the Madame John’s Legacy.
 After the American Revolution, but before the Classic Revival, we find that, according to Fiske Kimball in Domestic Architecture of the American Colonies and of the Early Republic, "Orientation and exposure of the rooms were considered with a new freedom from partipris. Where the street frontage was on the north, it was not uncommon for the Chief rooms to be toward the rear, constituting a back front or garden front, as in the Derby, Gore, and Brockenbrough houses, for instance. In all these the hall was not carried through to the garden side, but the desirable exposure there was used for a file of rooms en suite. So much preferred did such an arrangement become that in some cases where the best exposure was toward the street the hall was displaced from the centre to leave it free for the living rooms.”
Figure 5. Madame John’s Legacy, New Orleans.
In Mexico orientation was given much consideration. In the City of Puebla, in 1534, it is reported by George Kubler in Mexican Architecture of the Sixteenth Century that the streets were so laid out as to prevent the prevailing winds from sweeping the length of the city. Kubler also notes: "The laws of 1573 for Spanish towns merit some discussion: they are probably based upon Mendicant experience, and certain prescriptions can be understood only in the light of an abstract, standard emplacement. The legislators had in mind a generic site swept only by easterly winds.* New towns were to be located if inland, to the east or west of hills and mountains, apparently in order that they might be spared the force of the assumed winds. Another provision urged that inland towns be swept only by north and south winds. Coastal towns were not to have open water south or west of the settlement. Under certain circumstances it was a practical regulation, for if the prevailing winds are southeasterly, as on the Gulf Coast, constant offshore winds would [hin]{.underline}der the approach of sailing vessels to ports with channels leading into the wind. It was also the law to lay out riparian settlement upon the east banks of rivers, in order that humors, infections and mists might be swept away from rather than into the towns.” On the building practices themselves Kubler advises: "In the sixteenth century the house with a thatched roof bore the generic name of jacat. In moist areas, such thatched roofs were indispensable, for the flat roofs of the arid highland were ineffective, and the paucity of labor and materials made framed or vaulted roofs impractical. In humid climates, moreover, the thatched roof provides necessary ventilation, and the material is so inexpensive that it
* “Sixteenth-century theory concerning winds was as much magical as hygienic; many of its recommendations were drawn deductively from Aristotelian postulates (see J. de Acosta, Historia natural y moral de las Indias (Mexico, 1940) pp. 135-164, E. O’Gorman ed.); perhaps also from Vitruvian prescriptions (K. Lehmann Itartleben, ‘ ’The Impact of Ancient City Planning on European Architecture", Journal of the American Society of Architectural Historians. Ill, no. 1-2 (1943), 29).’’
may easily be replaced when infested or decadent. . . .An effort to waterproof flat roofs with resin did not endure over two years and the Dominican builders therefore reverted in their church construction to extremely steep thatched roofs.” An observation still more interesting, follows: “Numerous passages in the Old Testament allude to the north as the direction associated with gentile peoples, and Gregory the Great specifically stated the purpose of an entrance to the temple from this direction. Since the sixth century, at least, then, the north doorway has been associated with Catechumens. In Mexico we may assume that the Mendicants, conscious of their Great Mission, emphasized the north doorway, to an extent unknown in Europe, because of the multitudes of Indian inchoates in their charge. …” However, it can also be argued that, as the north was the cooler side in Mexico, people tend to gather there more readily than where there is a southerly exposure; the north then was the logical place for the entrances. To this day in the hot Central American countries, it is the custom to place the doors in areas sheltered from the sun.
In South America there was a similar regard for the climate. An instance of the foresight in town planning is reflected in the city of Lima, Peru, founded on October 18, 1535, by Francisco Pizarro, conqueror of that land. Paul Lester Wiener and Jose Luis Sert have written in L’ Architecture d’Aujourd’hui: “Les rues, larges de 11 m. etaient correctement orientees, compte tenu de la trajectoire du soleil et de la direction des vents dominants. L’importance de ces deux Elements etait d’ailleurs precisee dans les textes legislatifs de 1523. De ce fait, les rues du vieux Lima sont ombragees et agreablement rafraichies par la brise marine.” In classical lands of the Near East, as well as in tropical islands of the South Seas, and even in England (as evidenced by Stonehenge), the natives were preoccupied with orienting their houses and streets according to the position of the rising sun on certain dates of the year: the days of festivals, of the equinoxes, or of the first construction of the particular work. An admirable discussion of methods used is presented by Pierre Lavedan. As the scope of this book is restricted to the effects of the weather, not sun-worship, on building orientation, the reader who desires to investigate further is requested to refer to this source (see bibliography).
But the ancients were governed not only by magic and sun worship but also by considerations of comfort and health in relation to climate.
Professor Flinders Petrie says that the oldest example of town planning yet discovered is that of Kahun in Egypt. The street sloped down to the middle, and occasional rain would be run off without m[akin]{.underline}g the street muddy.
Aristotle, said by Henry R. Aldridge in The Case for Town Planning to be the first town planner of history, remarked on this subject in Politics, Book 4: “The healthiest cities are those which stand upon a slope inclining to the East and so the winds which blow from the quarter
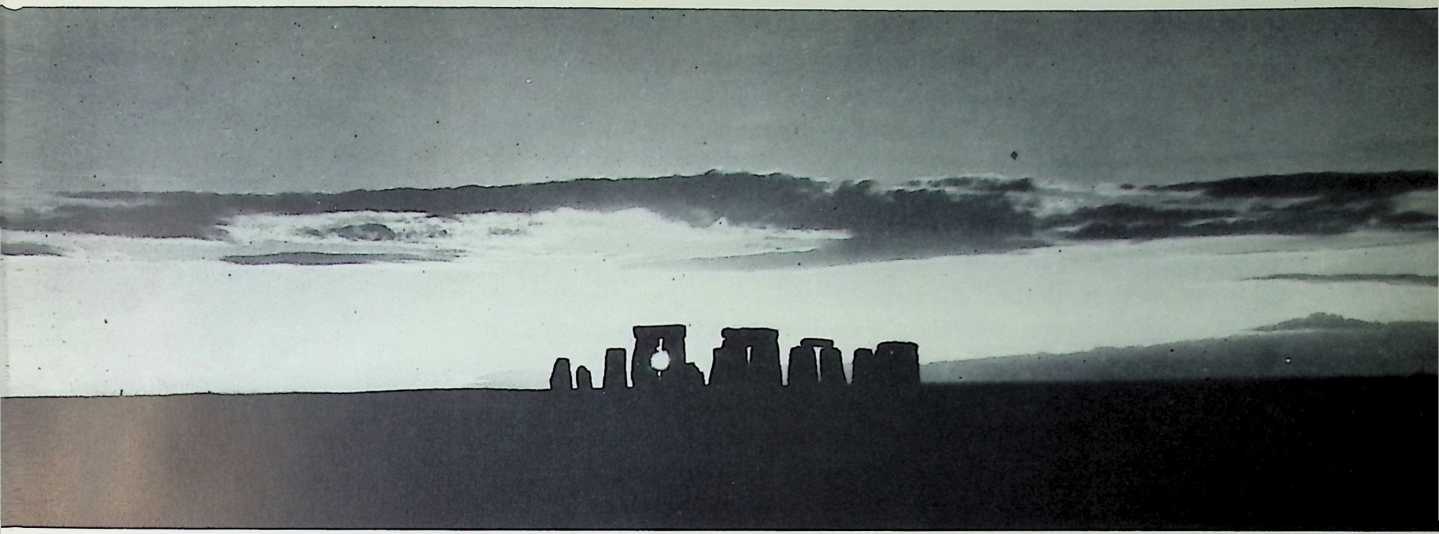
Figure 6. Stonehenge at sunset. Salisbury of the sunrise. The next best aspect is one that is sheltered from the Plain, England. north wind, as cities so sheltered enjoy milder winters.” About 300 B.C.
Xenophon wrote (according to Maron J. Simon in Your Solar House}: “In houses with a south aspect, the sun’s rays penetrate into the porticoes in winter, but in summer the path of the sun is right over our heads and above the roof, so that there is shade. If, then, this is the best arrangement we should build the south side loftier, to get the winter sun, and the north side lower to keep out the cold winds.” R. E. Wycherley in How the Greeks Built Cities describes the Hellenistic houses of Delos as usually having the court on the south side; the houses, therefore, turned southwards as a rule.
In the third century A.D., Vitruvius presented his ideas on the layout of towns and of individual buildings according to various climatic influences. He has since been described as the forefather of modem town planning by Pierre Lavedan. Even Frank Granger, in the introduction to his translation of Vitruvius’ book On Architecture, although a little more reserved in his plaudits, recognizes the contribution Vitruvius made to this science. Some of Vitruvius’ statements on this subject are as follows: “. . .he [the architect] must know the art of medicine in its relation to the regions of the earth (which the Greeks call climata}] and to the characters of the atmosphere, of localities (wholesome or pestilential), of water supply. For apart from these considerations, no dwelling can be regarded as healthy.[1] Also there will be natural seemliness if light is taken from the east for bedrooms and libraries; for baths and winter apartments, from the wintry sunset; for picture galleries and the apartments which need a steady light, from the north, because that quarter of the heavens is neither illumined nor darkened by the sun’s course but is fixed unchangeable throughout the day.” On the salubrity of sites, Vitruvius noted:[2] “1. First the choice of the most healthy site. Now this will be high and free from clouds and hoar frost, with an aspect neither hot nor cold but temperate. Besides, in this way a marshy neighborhood shall be avoided. For when the morning breezes come with the rising sun to a town, and clouds rising from these shall be conjoined, and, with their blast, shall sprinkle on the bodies of the inhabitants the poisoned breaths of marsh animals, they will make the site pestilential. Also, if the walls are along the coast and shall look to the south or west they will not be wholesome, because through the summer the southern sky is warmed by the rising sun and burns at midday. Also, that which looks to the western sun is warm at sunrise, hot at noon, burns in the evening.
“2. Therefore by the changes of heat and cold, bodies which are in these places will be infected. We may even perceive this from those bodies which are not animal. For in wine stores no one takes light from the south or west, but from the north, because that quarter at no time admits changes, but is continually fixed and unchangeable. So also those granaries which look towards the sun’s course quickly change their goodness; and fish and fruit which are not placed in that quarter which is turned away from the sun’s course do not keep long.
“3. For always, when heat cooks the strength out of the atmosphere and with warm vapours removes by suction the natural virtues, it dissolves and renders them weak, as they become softened by warmth. Moreover, we see the same thing in iron, which is hard by nature and yet when it is heated through in furnaces, by the vapour of fire becomes so soft that it is easily fashioned into every kind of shape; and when, being soft and red-hot it is chilled and steeped in cold water, it hardens again and is restored to its previous character.
“4. We may also consider that this is so from the fact that in summer, not only in pestilential, but in salubrious districts, all bodies become weak by the heat; and also, through the winter, even the regions which are most pestilential, are rendered salubrious because they are rendered solid by freezing. Not less also the bodies which are transferred from cold to warm regions cannot endure but are dissolved; while those which are transferred from warm places under the northern regions not only do not suffer in health by the change of place but even are strengthened.
“5. Wherefore in laying out walls we must beware of those regions which by their heat can diffuse vapours over human bodies. For according as from the elements (which the Greeks call stoecheia) all bodies are composed, that is from heat and moisture and earth and air, just so by these mixtures, owing to natural temperament, the qualities of all animals are figured in the world according to their kind.
“6. Therefore in whatsoever bodies, one of their principles, heat, is predominant, it then kills them and by its fervency, dissolves the rest. Now a hot sky from certain quarters produces these defects; since it settles into the open veins more than the body permits by its natural temperament or admixture. Again, if moisture had filled the bodies and altered their dimensions, the other elements, as though decomposed by liquid, are diluted and the virtues dependent on this proportion are dissolved. So also from the chilling of moisture of winds and breezes, vices are infused into bodies. Not less the natural proportion of air and also of the earthy element by increase or diminution weakens the other elements; the earthy by repletion of food, the aerial, by the heavy climate.
“7. But if anyone wishes carefully to apprehend these things by perception, let him regard and attend to the natures of birds and fishes and land animals, and we •will so consider differences of temperament or admixture. For the race of birds has one temperament, fishes another, far otherwise the nature of land animals. Birds have less of the earthy, less of moisture, moderate heat, much air. Therefore, being compounded of the lighter principles, they rise more easily against the onrush of the air. But fishes with their watery nature (because they are tempered by heat and are compounded of much air and earth, but have remarkably little moisture), the less they have of the principles of moisture in their frame, the more easily they persist in moisture; and so when they are brought to land they lose their life along with the water. Terrestrial animals, also because they have a moderate degree of the elements of air and heat, and have less of the earthy and more moisture, cannot keep alive long in water.
“8. Therefore if these matters are accepted as we have set forth, and if we apprehend by perception that the bodies of animals are compounded of elements, and if we judge that they suffer and are dissolved by excess or defect of them, we do not doubt that we must diligently seek to choose the most temperate regions of climate, since we have to seek healthiness in laying out the walls of cities.”
The foregoing treatise is distinctive because it exemplifies the fact that the climate of a site influences not only the layout of the buildings but the health of the inhabitants.
The genius of Vitruvius is again expressed in other passages: “When the walls are set round the city. . . .these will be rightly laid out if the winds are carefully shut out from the alleys. For if the ■winds are cold they are unpleasant; if hot, they infect; if moist they are injurious. And: ‘ ‘ For when the quarters of the city are planned to meet the -winds full, the rush of air and the frequent breezes from the open space of the sky will move with mightier power, confined as they are in the jaws of the alleys. Wherefore the directions of the streets are to avoid the quarters of the winds so that when the winds come up against the corners of the blocks of buildings they may be broken, driven back and dissipated.’’ Vitruvius also furnishes two plans to illustrate the principles he proposes. One is “so mapped out that it may appear whence the certain breezes of the winds arise; the second, how by layings out of quarters and streets turned away from their violence, dangerous currents may be avoided.”[3] In Book V, Vitruvius comments: “the shipyards are to be built with a northern aspect, as a rule. For southern aspects because of their warmth generate dry rot, wood worms and ship worms with other noxious creatures, and feed and maintain them.”
But the full scope of Vitruvius’ thinking is probably expressed in the following quotations: “For in one part the earth is oppressed by the sun in its course; in another part, the earth is far removed from it; in another, it is affected by it at a moderate distance. Therefore, since, in the sun’s course through the inclination of the zodiac, the relation of the heavens to the earth is arranged by nature with varying effects, it appears that in like manner the arrangement of buildings should be guided by the kind of locality and the changes of climate. Towards the north, buildings, I think, should be vaulted, thoroughly shut in rather than exposed, and with an aspect to the warmer quarter. On the other hand, where the sun is violent in southern regions because they are oppressed by the heat, buildings should be open to the air with a northern, or north-eastern aspect. Thus we may remedy by art the harm that comes by chance. In other regions also, buildings are to be similarly adjusted to suit the relation of climate to latitude.” (Italics are by author). And: “1. Now we will explain the adjustments by which the various apartments may look out suitably to their proper aspects. The baths and winter diningrooms should look towards the winter setting sun, because there is need of the evening light. Besides, when the setting sun faces us with its splendour, it reflects the heat and renders this aspect warmer in the evening. Private rooms and libraries should look to the east, for their purpose demands the morning light. Further, the books in libraries will not decay. For in apartments which look to the south and west, books are damaged by the bookworm and by damp, which are caused by the moist winds on their approach, and they make the papyrus rolls mouldy by diffusing moist air. 2. The spring and autumn dining rooms should look to the east. For exposed as they are to the light, the full power of the sun moving to the west renders them temperate at the time when the need to use them is customary. The summer dining-rooms should have a northern aspect. For while the other aspects, at the solstice, are rendered oppressive by the heat, the northern aspect, because it is turned away from the sun’s course, is always cool, and is healthy and pleasant in use. Not less should the picture galleries, the weaving rooms of the embroiderers, the studios of painters, have a north aspect, so that, in the steady light, the colours in their work may remain of unimpaired quality.”
There are yet other references to climate in Vitruvius’ thesis on architecture, as in Book VI, chapter vi, where there are details on how to orient various units in the farmyard and the farm-house. We have seen, however, from what has already been quoted, that besides bearing Lave- dan’s acclaim of being the forefather of modern town planning, Vitruvius possibly may also have the distinction of being the first “architectural climatologist.”
Indeed Vitruvius influenced many thinkers of his day and in later years. Andrea Palladio was one of these. In Architecture he wrote: “Vitruvius tells us, that when the World was young, Men made the Roofs of their Houses flat, but afterwards finding that this did not protect them from the Injuries of the Weather, Necessity compelled them to raise them in the Middle, and make them slope. These Roofs must be made more or less shelving, according as the Climate is either hot or cold: For which Reason, in Germany, where the Snow falls in great Quantities, the Roofs are made very sharp, and are covered with Shingles, or little thin Pieces of Wood, or else with very thin Tiles; for otherwise the Weight of the Snow would crush them. But those who live in gentle and moderate Climates, should raise their Roofs with Grace and Politeness, and to such an altitude as that the Rain may easily roll off. The Breadth of the Place to be rooffed therefore must be divided into nine parts, two whereof shall be the Pitch; for if it were made of one fourth of the Breadth, the Roof would be too sharp, so that the Tiles would scarce cleave; and if they were made but of a fifth part, the Roof would be too flat, whereby the superincumbent Weight of the Tiles, Shingles, and Snows would press too much upon it. Gutters are usually made all round the House, into which the Water that falls from the Tiles is conveyed away by Spouts at a considerable distance from the Walls. The Gutters must have a Foot and a half of Wall over them, which will not only keep them in much stronger, but likewise preserve the Timber in the Roof from any Damage which the Rains might otherwise occasion.” Also: “It is not advisable for any one to build in Vallies which are enclosed by Mountains; because Houses which lie concealed in such Places, besides the Disadvantage of their having no distant Prospects. . . .they are likewise in all Respects prejudicial to Health, because the Earth being impregnated with the Rains which settle there, send forth contagious Vapours. . . .If, on the other Hand, the Sun can penetrate into those vallies, the Reflection of its Rays will create excessive Heats; or if not, then a perpetual Shade will render the Inhabitants dull and indolent, and spoil their Complexion. When the winds blow into them they are too boisterous, on account of the narrow Chops through which they must pass; and when the Winds cease to blow there, the Air will become gross and sickly through its Stagnation. For which Reason, when you are determined to build upon an Eminence, chuse such a situation as faces the temperate Region of the Air, and is neither always overshadowed by higher Hills, nor scorched up, as it were, with two Suns, by the Reflection of the real one from some adjacent Rock: For in either of these Cases, it becomes an incommodious Habitation.” And: “. . . .Porticos, in my Opinion, should be made on each Side of the Street, under the Cover whereof, the Citizens may transact their affairs without being injured by the Sun, the Rain, or the Snow; and almost all the Streets of Padua, which is a very ancient City, and famous for its University, are in this Manner. . . .There ought to be a Kennel in the Middle of the Street, towards which each Side is gently to slope, that the Rainwater, which falls off the Houses, may run all into one Channel, and have a free and easy Course; by which Means the Streets will be left clean, and no bad Air will be produced; which will happen when such Waters are collected into one Place, and stagnate there.” Such techniques were also employed in Egypt, as we have seen.
Palladio touched on many subjects in his writings; he even made mention, as Vitruvius did, of the orientation of farmyard units. He considered all phases of the weather in his architectural work, and was not merely a “Roman-column architect” as so many critics feel. His practicality (and frustration) is recognized in this quotation: “But it very often happens that the Architect is under an Obligation to follow the Fancy of the Person who employs him, and not the dictates of his own Genius or Inchnation.”
In Italy we can also note an early instance of effective building regulations and laws related to the climate. Fiske Kimball reports that an edict of the Roman emperors forbade the use of the overhang in narrow streets in Pompeii because it would shut out the sunlight and air.
At Paris in 1810 M. de Perthuis may have drawn inspiration from the writings of Vitruvius, for, in speaking of the orientation of different buildings in a rural surrounding, he refers to the same type of allusions and adopts a similar argument. Still, it shows the extent of thinking by one of those who were concerned with this subject in the early part of the nineteenth century in France.
It is commonly adjudged by many people that in the British Isles everyone talks about the weather. Whether this is true or not today, we have much evidence that considerable attention was paid to this matter in bygone centuries, even back to 2668 B.C.
As far as architecture is concerned, the earliest account was of damage due to lightning in A.D. 8, in the town of Pickering. But there is no mention of any attempt to ground buildings and prevent such damage. Then, from two papers we can see how the early development of the city of London did not properly reveal a consideration of the climate. In the first reference (as given by Aldridge quoting Fitz Stephen and Sir Walter Besant), which was taken from a document dating from the reign of Henry II, we see what London was: “In this Place the Calmness of the Air doth mollify Men’s Minds, not corrupting them with Veneral Lusts, but preserving them from Savage and rude Behaviour, and seasoning their Inclincations with a more kind and free Temper.” In the second reference, quoted from John Evelyn’s book Fumifugium, written in 1661, we see the streets of London deplored: “That this glorious ancient city, which from wood might be rendered brick, and (like Rome) from brick made stone and marble; which commands the proud ocean to the Indies, and reaches the farthest Antipodes, should wrap her stately head in clouds of smoake and sulphure, so full of stink and darkness, I deplore with just indignation. That the buildings should be composed of such a congestion of misshapen and extravagant houses; that the streets should be so narrow and incommodious in the very centre and busiest places of intercourse; that there should be so ill and uneasie a form of paving under foot, so troublesome and malicious a disposure of the spouts and gutters overhead, are particularly worthy of reproof and reprimation; because it is hereby rendered a labyrinth in its principal passages and a continual wet day after the storm is over.” Under these circumstances it might be argued that the Great Fire, five years later, was a blessing in disguise.
After the Industrial Revolution occurred in Europe it was found necessary for many cities to enact by-laws governing the zoning of various types of dwellings. For example, regarding town planning in the ancient city of Nuremburg in the 1870’s, Reichstrat Weigel reported that la*ws were passed regarding the light admitted to each room in the house. Aldridge tells us that a Swedish Act passed on May 8, 1874, required that light and air sufficient to maintain health be provided for in the town plan. Mr. A. E. Cave, editor of the Municipal Journal, in describing his visit to Vienna in September, 1909, said that the determining factor in setting up the zoning districts was the prevailing winds. The object was to take the smoke away from the city instead of towards it.
In the English garden cities of Letchworth and Welwyn, Kampff- meyer notes that the industrial quarter is on the east side of the town; therefore, the prevailing west winds blow the smoke of the factories away from the town. He writes with regard to Magnetigorsk, Russia, that Miljutin, the designer, took such local conditions as water, land, and wind direction into consideration when he planned the city. We are also told by Kampffmeyer that “an interesting plan of a radical character has been drafted for a town on socialist lines near Nowasibirsk. . . .In view of the prevailing south-easterly winds the factory was located north of the town. . . .The axis of the dwelling house rows runs from north to south, so as to concur with the main direction of the prevailing -winds.”
Nor should we forget to note the progress made by the peoples of the Far East, especially those of China and Japan. Jiro Harada noted that in Japan, nature comes first; the architect does not try to subordinate the natural surroundings to the house, rather he tries to render homage to the surroundings.
Here are some instances of the mode of thinking in Japan as reported by Harada: “Projecting eaves are another feature of Japanese houses. . . .Such eaves were necessary to protect a house against heat and rain and to allow it to be kept open on rainy days. Furthermore, in our [i.e., Japan’s] latitude eaves do not prevent the sun from shining into the house in the winter. . . .In the Far East, where the family is the unit of society, the home assumes a position of prime importance in the life of the people, and it is but natural that the house should have received the most careful attention in various ways. The health and prosperity of a person were considered to depend on the location and planning of the dwelling house, chiefly in reference to ‘direction.’. . .
“An ancient book has it that it is lucky for a man to live in a house built on ground which rises at the back and slopes down in front; woe unto the person who dwells in a house standing on ground with a rise in the front and a downward slope at the back. In these statements it is presumed that the house faces tire south, whence comes sunshine and good cheer. On ground which is low, and open both to the east and to the south and high on the west and north, the house may face east, south-east or south and still have rising ground at the back and is hence desirable. However, should a building be facing west or north and have hills at the back, then the sunshine and warmth from the east or south would be shut off, and the location be undesirable. . . .
“The plan of the house, of course, depends on the location, but it should have due regard to ‘direction’ determined by imaginary lines drawn from the north-east to the south-west, and from the north-west to the south-east, intersecting each other at right angles at the heart of the house. The north-east is called ‘ki-mon’ (devil’s gate) and care should be taken not to build anything unclean in that direction. Undesirable things are said to come from that direction and the house should be so planned as to be protected by a wall or a closet in that direction and not be left open. The south-east is designated as the ‘chi-mon’ (earth’s gate) or ‘fu-mon’ (wind’s gate), the north-west as the‘ten-mon’ (heaven’s gate) where the well and the store-house should be located, and the south-west, between the heaven and earth gates, as the ‘jin-mon’ (man’s gate). These ‘directions’ though some are inclined to disregard them as being mere superstition, seem to be based mainly on hygienic principles and on atmospheric conditions such as the direction of the prevailing winds or storms. Such importance is attached in the mind of the people to these rules that it is still customary in Japan to consult a specialist on ‘directions’ when one wishes to build a home.” (Italics are by the author.)
Speaking of the comfort of Japanese homes, Harada says that “houses are usually built to face the south; that is, they are open to the south. There should be enough opening on the northern side also to permit a current of air to pass through from north to south and vice versa; this gives warmth in winter and coolness in summer.”
Hideto Kishida notes that Japanese dwellings have large openings and are thrown open in summer. The climate being very damp, especially during the summer, a closed house (that is, of small windows and openings) would be oppressive. Ralph Adams Cram, however, does not care for this open quality in winter, since the openings enable the wind to find its way through every crack and crevice.
D. G. Mirams points out that the very earliest roofs illustrated in Han monument sculpture in China projected well out over the columns, probably as a form of protection for the open or paper-covered wood lattice walls, doors, and windows on the south side of the house.
Turning from China to India, Mirams says: “In India with its hot climate and burning sun, the problem of large overhanging eaves must always have required solving, palaces often being entirely open to allow
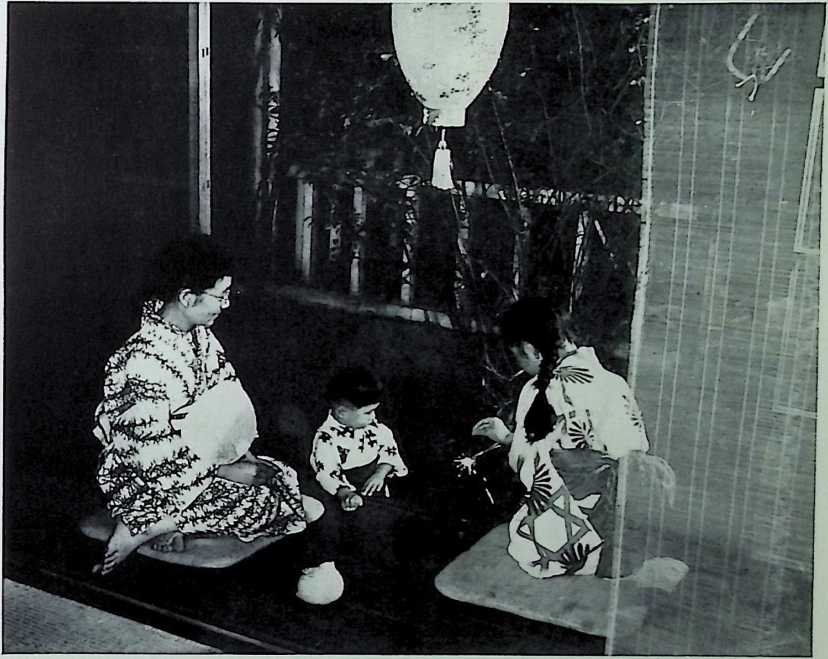
Figure 8 (right). Interior of Japanese country home in summer. The bamboo screen is called “Sudare." Figure 9 (below). Trivandrum, Women’s College, India.
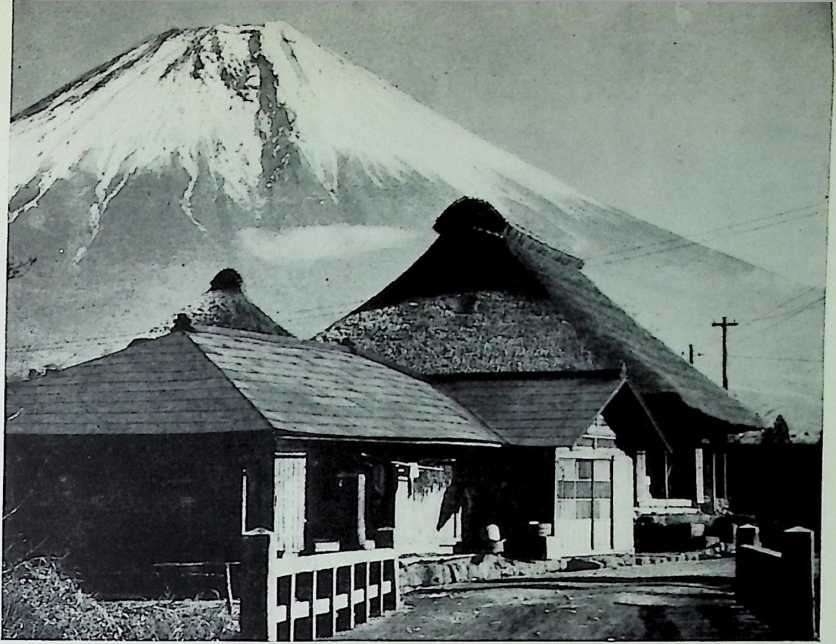
Figure 7. A typical Japanese farm house. This one is al the foot of Mount Fuji.
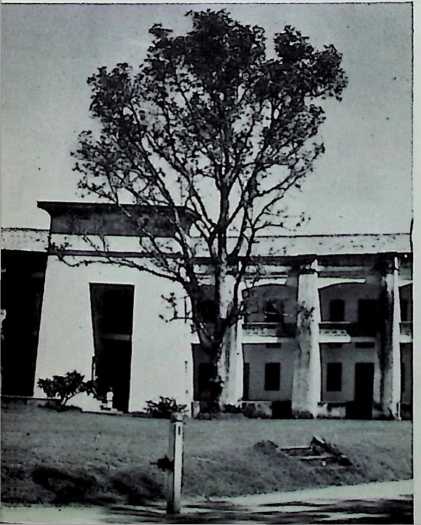
the slightest breath of air to be caught. Four-way brackets to support either internal cross beams, or architrave beam and eaves purlin, was the natural construction. . . .In India the whole standard of design deteriorated in quality down to the Mogul invasion, when the Moguls incorporated the Hindu bracket designs into their Persian types of architecture with considerable success, so showing that the necessity for large overhanging eaves in this hot country was recognized.”
Thus we see that almost everywhere in the world for hundreds of years, until modem times, the climate has been a dominant influence on architects and architecture. As Dr. Helmut E. Landsberg has remarked: personal taste played only a minor role in the evolution of buildings. The low house with the thatched roof and the lack of window surfaces characterizes the windy, rain- and snow-swept slopes of Norway’s fjords. The gabled house of the Swiss Alps is designed to withstand the heavy snow loads of the region. The walled, white house with the flat roofs frequents the desert regions with their intense sunshine and the wide diurnal temperature range. There is the lattice wall and the waterproof roof of the moisture and rain-burdened hot air of the tropical jungles. All are well suited to compensate in a primitive way for the climatic conditions of the respective regions. Moreover, not only houses but entire cities have been laid out climatically, whether intentionally or otherwise. The former case is of the type revealed in the writings of such men as Vitruvius and Aristotle. The latter category was a spontaneous solution of the problem of climate, as typified perhaps in the ingenious invention of the narrow canyon street of the desert regions, where one row of houses offers shade protection to the next and where the wall surface exposed to the radiation is kept to a minimum.
A fine heritage exists; it is unfortunate that we have not in recent years taken advantage of it.
What is the situation today? Why have we momentarily lost sight of the importance of climate in architecture?
Because of increased travel among the nations, people have borrowed one another’s “styles” without properly considering their function or climatic suitability in the new position.
There was little justification in rendering the form of a Roman bath into Pennsylvania Station, New York. And there was even less justification when, with the advancement of engineering techniques in controlling indoor temperatures, man merely modified such designs instead of seeking a new pattern of fundamentals. Modem methods permitted heating of shelters in Goose Bay, Labrador, where temperatures are never excessively high, and cooling of dwellings in Phoenix, Arizona, where the outdoor air temperature is above 90° F. on an average of 152 days each year. Yet when the demands of the climate forced man to account for severe cold and extreme heat in one twelve-month period, as in Winnipeg, Manitoba,* he did not quite know what to do with his Greek- Temple banks in order to make them comfortable all year round.
* In 75 years, the extreme range of temperatures has been 163.5° F. at Winnipeg. The average annual temperature range is 128° F.
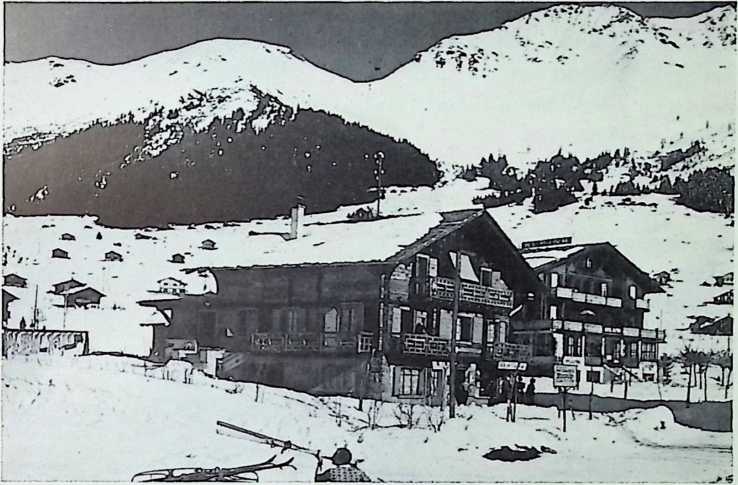
Figure 11 (left). Chalets in the Valais, Switzerland, a popular winter sports center. Note the roofs.
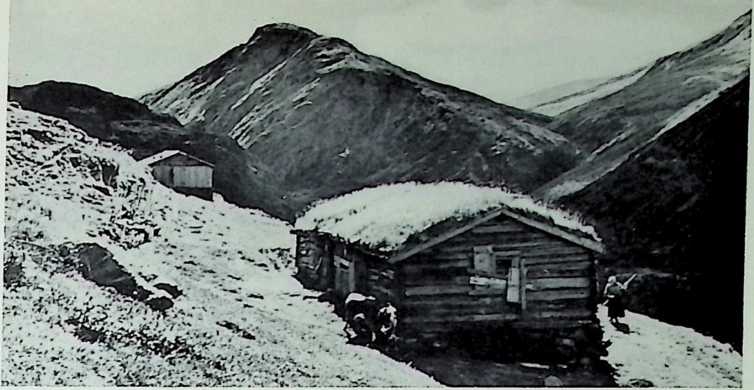
Figure 10 (right). Mountain farm near the 1,000-year-old road between Oslo and Trondheim, Norway.
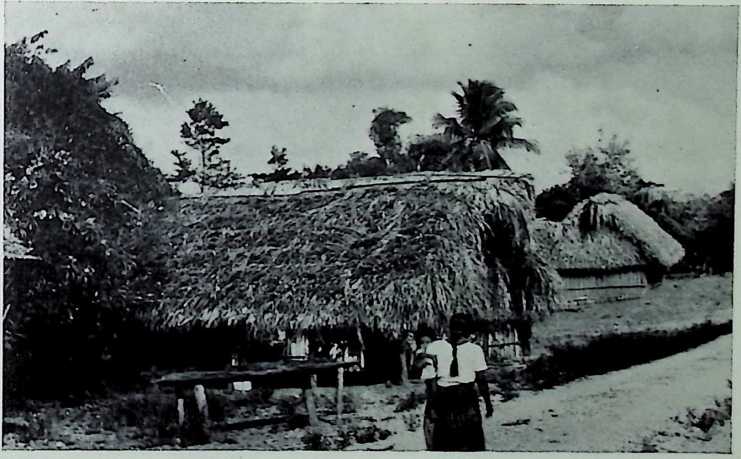
Figure 12 (right). Lattice wall and thatched-roof homes in the village of San Pedro Columbia, British Honduras.
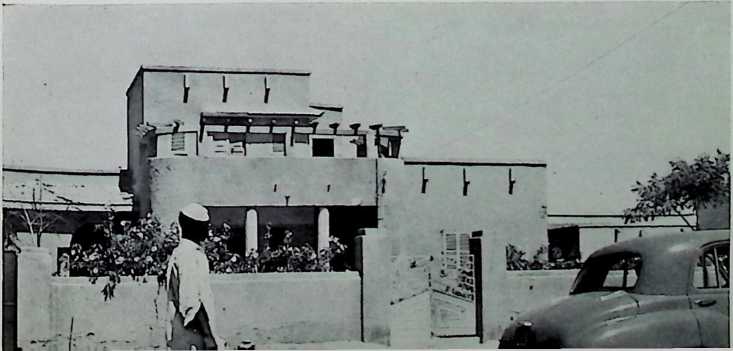
Figure 13 (left). Middle-class homes in the Anglo-Egyptian Sudan. Note the absence of openings.
What do we find in the Province of Quebec and in other North American areas? Typical big-city dwellings support skeleton outdoor stairs, two or sometimes three flights high, laden with slippery snow. Snow slides off roofs into the path of pedestrians. One experiences a mild Jungfrau avalanche when opening ground-floor windows in winter. Traffic is stalled on ice and snow-bound boulevards. Smoke envelops all. And it is no wonder we now employ the term “air conditioning” for the old- fashioned “ventilation.” Sticky summer nights sizzle the Satanized air, and the buildings fry.
Little heed has been paid by most architects to the demands of climate. Just as women’s fashions seem to follow those of Paris, London, and New York, so does the type of architecture follow the trends set by major urban centers in other countries. For example, many contemporary residences above the Mason-Dixon line sport “1930-modern” Miami comer-windows wholly unsuited to the rigors of the climate of the northern United States.
“Comfort gadgets” seemingly have little or no effect. The basic architectural design must be in conformity with the prevailing weather. Man is gradually realizing this once again: he cannot compete against the climate. He must go along with it. As a result, scientific investigations all over the world are gradually blooming forth to determine the needs of the architect in various regional and local situations.
Some investigations have been quite limited. For example, H. Myles Wright, editor of the volume entitled The Planner’s Notebook, recognized the necessity for the architect and town planner to have climatic statistics. The information provided, however, was mostly data on mean daily temperature, average rainfall, and hours of sunshine in England, all confined to one and three-quarter pages; this was supposed to be all that the modem planner needed to know about meteorological phenomena!
Other investigations have shown significant interest in more details. Government agencies are fostering research in many countries; here are a few:
Division of Building Research, National Research Council, Ottawa, Canada.
Building Research Station, Garston, Watford, Herts., England. Department of Works and Housing, Commonwealth Experimental Building Station, Sydney, N. S. W., Australia.
Dominion Physical Laboratory, Department of Scientific and Industrial Research, 111 Sydney Street, Wellington, New Zealand. Statens Kommittee for Byggnadsfirskning (Swedish Committee for Building Research), Stockholm, Sweden.
National Buildings Research Institute, P. 0. Box 395, Pretoria, Union of South Africa.
Building Research Station, National Research Council, Roorkee, India.
Swiss Federal Institute of Technology, Zurich, Switzerland.
Centre National de la Recherche Scientifique, 13 Quai d’Orsay, Paris 7, France.
The United States of America does not have a building research council, as such. However, investigations of a nature usually carried out in other countries by building research councils are handled in the United States by the National Bureau of Standards, a division of the Department of Commerce. Also, Americans have provided for a Building Research Advisory Board of the Division of Engineering and Industrial Research of the National Research Council, Washington. This agency, in cooperation with many private institutions, individuals, universities, and large industrial firms, acts as a clearing house for all matters related to building. Also, it assists in the formation of panel discussions. In January, 1950, in cooperation with its parent body, the National Academy of Sciences, it played host to a conference entitled “Weather and the Building Industry.”
Other authorities in the U.S.A, and elsewhere are too numerous to permit easy inclusion in tabular form at this point. The names of the more important ones will present themselves in the course of discussion and in the bibliography.
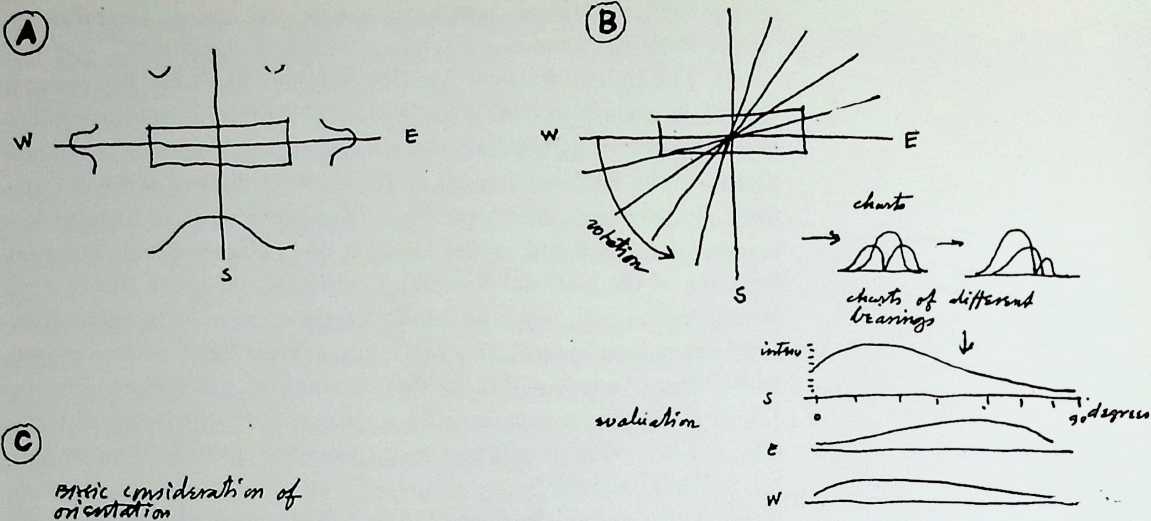
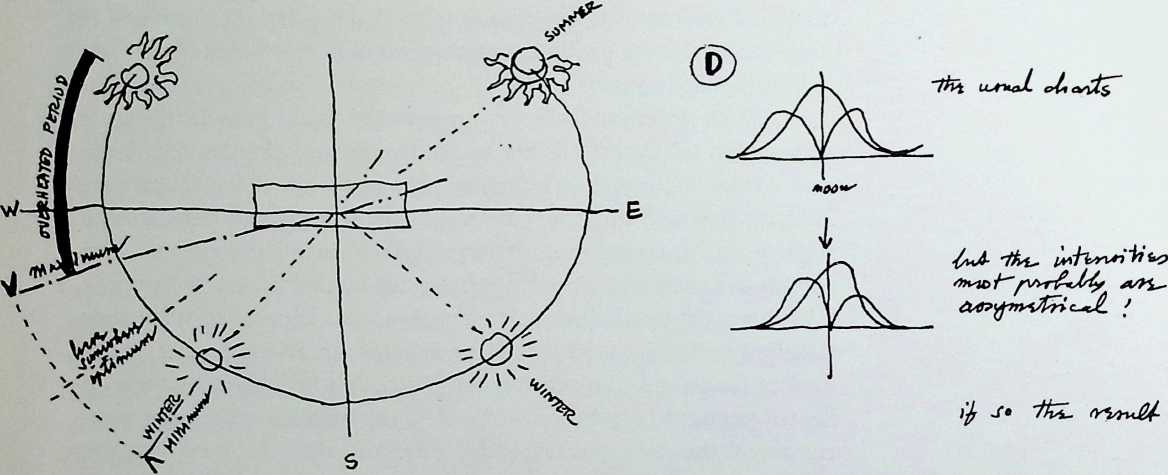
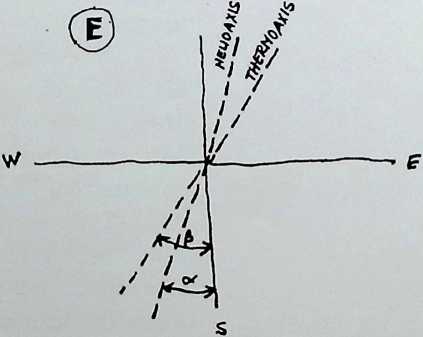
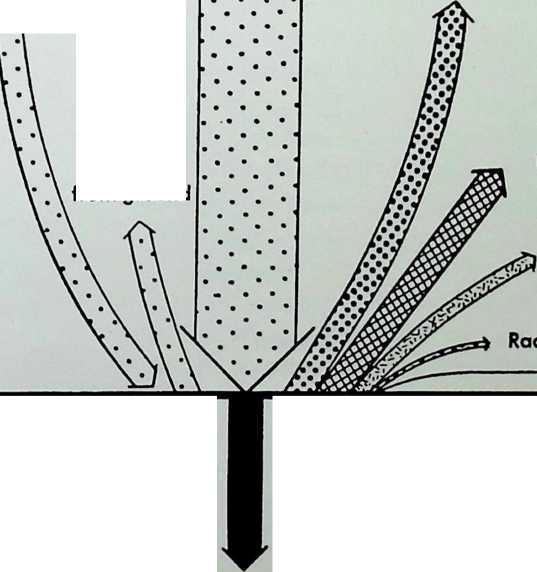
Two Americans who have conducted many investigations concerning the relation of climate to architecture are twin-brothers Victor and Aladar Olgyay. Recently they were in charge of the Climate and Housing Research Project, sponsored by the Housing and Home Finance Agency, at Massachusetts Institute of Technology. Their mode of approach to a particular problem is suggested by their sketch in Figure 14. “A” shows the usual observation of radiant heat impacton main directions only; “B” proposes that more elaborate charts are necessary; “C” depicts the winter and summer sun positions with respect to the overheated period; “D” advises that radiation intensities are not symmetrical about the noon position; “E” concludes that there are two axes which complicate orientation problems the “helio axis” and the “thermo axis.”
Of course, we are anticipating future paragraphs by presenting this information here. If, therefore, it is unintelligible to the reader by virtue of its being out of place, he should not worry about it. It is hoped, however, that the diagrams have served to illustrate just one of the problems that have been touched on by these researchers.
The recognition of climate in building is not confined to big institutions. A general awakening of designers and planners may be perceived in this following sampling of remarks.
In Denmark, it is reported by Jens Mollerup: “The wind, the rain and the flat country have naturally influenced Danish building styles. Danish houses are low; they follow the soft contour of the landscape and seek to escape the winds by keeping as close to the ground as possible. The roof is a saddle roof with ample slope to carry off the r[ain]{.underline}. The sloping roofs are a still greater necessity in the winter, for snow falling during the night when the temperature hovers around freezing will
Figure 14. Sketches by Victor and Ala- dar Olgyay, for northern hemisphere.
-
The usual observation of radiant heal impacton main directions only.
-
The necessity for more elaborate charts.
-
Winter and summer sun positions with respect to the overheated period.
-
Radiation intensities asymmetrical about noon position.
-
The “helio axis” and the “thermo axis" which complicate orientation problems.
melt as soon as the sun ascends in the sky, but in the early afternoon it might start to freeze again. This continuous change from thaw to frost with only a few hours interval naturally has a deteriorating effect on the flat roof surfaces, where the water from the melting snow is slow in draining off. At any rate, the modem flat roof demands special and expensive arrangements.”
Canadian architect H. H. G. Moody, of Winnipeg, discussing the planning of banks, stresses the point that good natural lighting is essential in the public area and service departments, both for appearance and for the comfort of the staff. A north or east exposure will eliminate glare and excessive heat, and where there is a southern exposure with a substantial glass area, a new heat absorbing glass is recommended.
Professor H. H. Madill of the School of Architecture, University of Toronto, emphasizes the fact that architects must consider orientation, as “it is important to the Canadian climate to take advantage of southern exposure and desirable winds.” It is even more important, he notes, for the architect to be appointed before the site has been officially decided upon so that he can assist the client to the best of his knowledge.
Arnold Whittick has noted one of the first conscientious efforts of architects to observe the practicality of adequately orienting his designs: “Ludwig Persius was a pupil of Schinkel, and in designing houses, many of which are in Potsdam and the vicinity, he followed rather the medieval work than the classic work of his master, and made his plans more in accordance with convenience and purpose, while he orientated them not as an abstract geometric layout, but in accordance with the sun and the character of the ground. He related his houses to their garden setting, and comprehended both as a unity, thus being somewhat of a forerunner of the garden city, and of the domestic architecture of Voysey and Frank Lloyd Wright. . . . [Voysey] planned his houses strictly according to the purpose they had to serve, and the majority have the convenient chain of rooms, formed as an L or E, and orientated with thought of the sun.”
Harold MacLean Lewis, in Planning the Modern City, says: “Climate affects the city plan in various ways. Temperature determines the growing season for crops and the depth to which water pipes must be
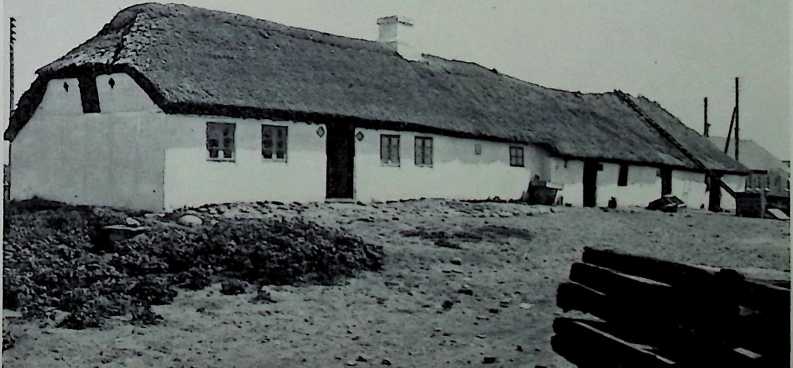
Figure 15. Thatched-rooj homes in Denmark.
aid to avoid freezing. Snowfall may affect the design of highways and par[kin]{.underline}g facilities. Prevailing wind directions influence the suitability of sites for airports and industry.” In the United States in the first two decades of the twentieth century “the factory districts were naturally those located along lines of rail or water transportation, but their location was sometimes determined by the direction of prevailing winds, in order that smoke and odors might not become a nuisance in the business and residential districts.” An example of this is the City of Worcester, Massachusetts, which, in 1922, as part of its zoning law, accounted for the microclimates of the city in four differentiated zones of relative residential desirability. “That zoning,” says Charles F. Brooks of Harvard, “was based roughly on the microclimatic survey in one part of the city which was then applied to the entire city on a topographic map. The elements used were temperatures of day versus night and the prevailing winds in relation to the topographical hill tops, slopes and valley bottoms. The most desirable, as chosen, were those facing the southeast and on the middle level of the slopes. The next faced the southwest on the middle level of the slopes and on top of the hill. The third faced the northwesterly or north slopes and were in the valley bottoms where the cold air collected in the winter.”
¶ THE SUN
sun (sun), n. [/IS. snnne.] 1. The luminous celestial body round which the earth and other planets revolve, and from which they receive light and heat. Symbol, O. Its mean distance from the earth is 92,000,000 miles; its linear diameter, 864,000 miles; its mass, 332,000 times that of the earth; its mean density about one fourth that of the earth. 2. Sunshine. 3. Sunrise or sunset;in phrases; as, from sun to sun. 4. A celestial body like the sun; a luminary center of a system. 5. A sunlike object.v.t.; [sunned]{.smallcaps} (stlnd); [sun’ning, To]{.smallcaps} expose to the sun’s rays; to warm, dry, air, bleach, etc., in or as if in the sun.v.i. To sun oneself.
¶ effect of the sun on the earth
“His going forth is from the end of the heaven, and his circuit unto the ends of it; and there is nothing hid from the heat thereof.” Psalms, xix, 7
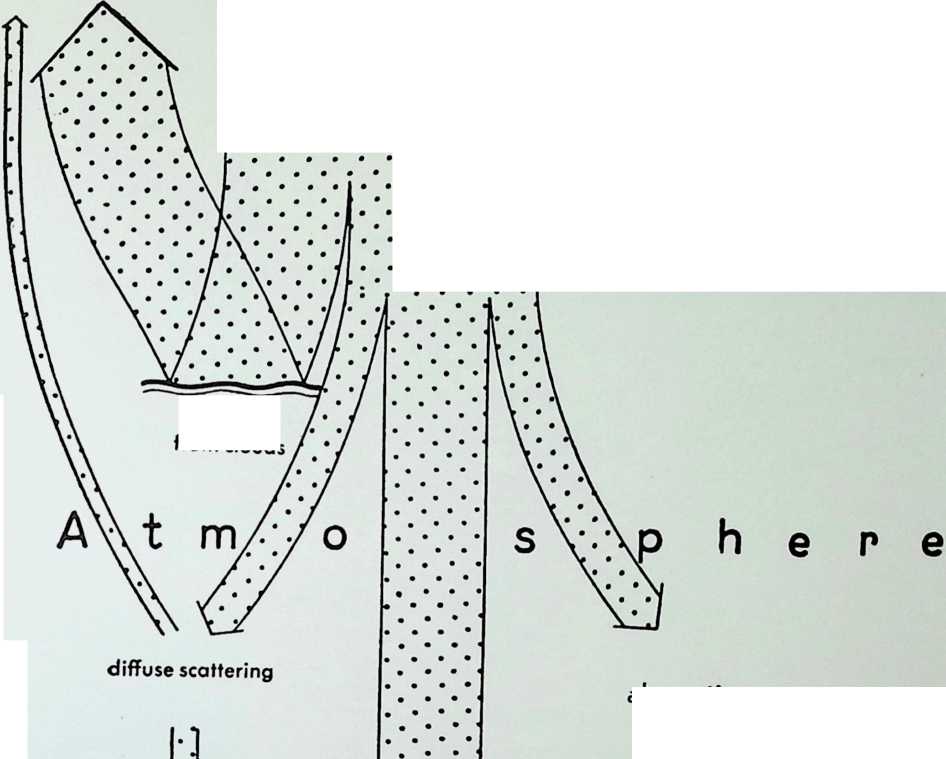
What happens when the sun’s rays reach the earth’s atmosphere? Figure 16 illustrates this. We see that a considerable portion of the sun’s energy is reflected back into space before it even reaches the ground. However, about one-third of it hits the earth’s surface and is promptly transformed to other types of energy. Evaporation, convection, heat conduction, radiative pseudo-conduction, reflection, and radiation occur.
Figure 16. Exchange of heal al noon during the summer. The width of the arrows corresponds to the amount of transferred heat.
The amount of radiation received depends on seven factors:
-
Position of sun according to the time of day
-
Position of sun according to the season
-
Clouds and other obstructions
-
Direction of slope of station
-
Angle of slope of station
-
Height of station
-
Situation ■with regard to surroundings
This is of interest to the architect, for the architect should understand the influences of the sun and how they can benefit his work.
To consider A and B of the above first, the path of the sun is definite at different times of the day and year; yet it is not very simple to relate it to the needs of the architect without design aids. There are five main methods of determining or recording the sun’s positions: diagrammatic, three-dimensional, statistical, “gadget,” and “direct observation.”
One of the diagrammatic methods for recording the sun’s position is known as the Burnett system. This method was conceived by P. V. Burnett, F.R.I.B.A. It consists of two diagrams. The first shows graphically the position of the sun on a plan at different times of the day and seasons of the year, and the second shows the latitude of the sun. The diagrams are used beneath tracing paper, and thus the method is quite easy, direct, and inexpensive. By their air it can readily be seen whether or not sunlight will penetrate a given window. No diagrams are yet available for the latitudes of the United States, so they cannot be reproduced here. However, we do include some charts for latitude 52°31 N.
Shown here is a method to calculate the depth of overhang for sunshades. In the figure at the left, the plan of the room under study is in the center. The plan is oriented, and the sunlight will penetrate during hours indicated between lines AB and CD. In the figure at the right, the room section is placed with window head or edge of sunshade at Z. Line GH is plotted from data obtained from the figure at the left. A line from any point on GH through Z gives sun penetration at indicated time. (See Figures 17 and 18.)
Universal space
absorption
extraterrestrial solar radiation
reflection
from clouds
Long wave outgoing radiation
Solar radiation
Radiation from sky
Evaporation
Convection
♦ Heat conduction
Surface
to the ground
Supplied
Reflection from ground
to the surface
Molecular heat conduction
Convection
Heat transport by:
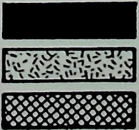
[^*.*.*.*.*]{.underline} Short wave radiation
[E?X;*«**,*;X«**j]{.underline} Long wave radiation
Changes of the physical state of the water
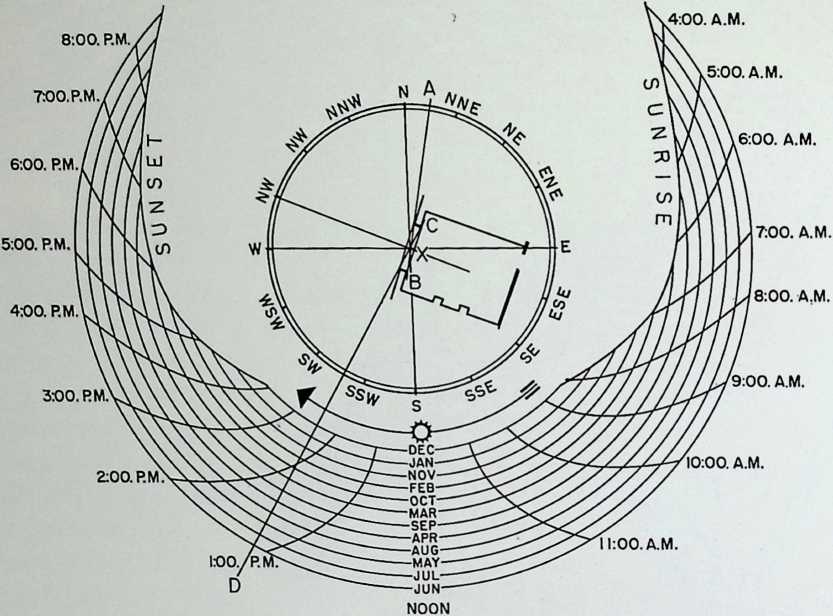
CALCULATED FOR NUNEATION 52° 31 N
Figure 17 (above) and Figure 18 (below). Diagrams for N as used in the Burnett system.
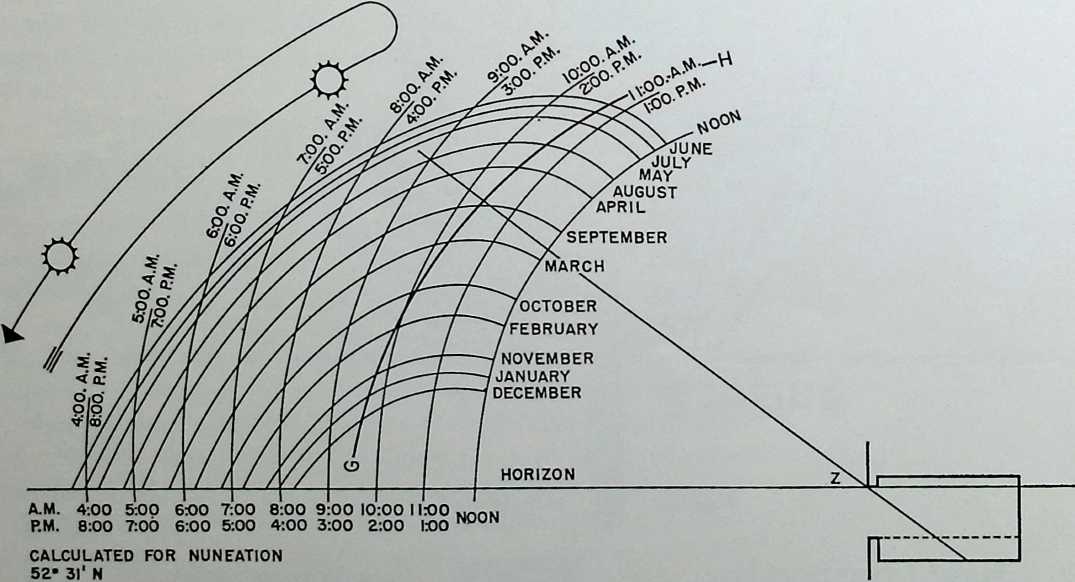
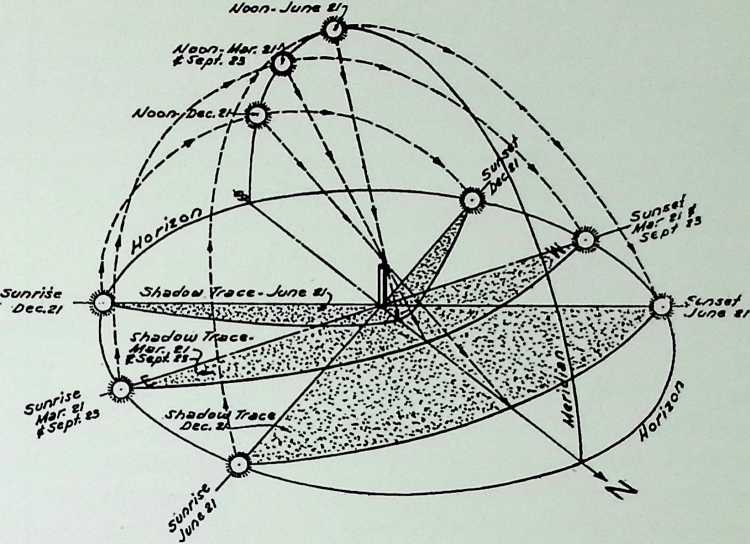
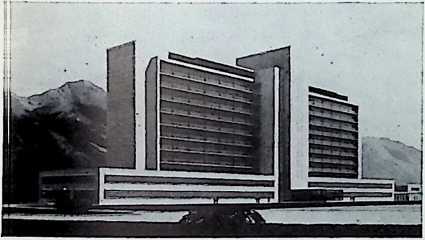
Figure 19. Solar shadow trace diagram for latitude N42°30, prepared by R. W. Justice.
Figure 20. Creole offices, Caracas, Venezuela. Lathrop Douglass, architect.
Figure 21. Graph used in Paul Si pies “House Beautiful” method.
The solar shadow trace diagram is another graphical method. If a stick is set in the ground standing upright and the sun sheds its light upon it, a shadow is cast. If the lines of the limits of the shadow during the course of the day are joined, a shadow trace line will be formed. These are different for different times of the year, and can be represented in the form of a chart. Figure 19 shows a diagram for latitude 42°30 North, prepared by R. W. Justice (whose solarmeter is described later on). The reader will note that these shadow lines for specific days can also be represented in plan form. When similar charts for a series of specific days are placed adjacent to one another, one has, in addition, a ready visual picture of the sun’s relative position throughout the year, as well as factual data concerning its altitude and azimuth.
Lathrop Douglass, in the course of designing the Creole Offices in Caracas, Venezuela, prepared altitude and azimuth diagrams to determine shadow lines for overhangs. The finished building itself, in Figure 20, illustrates how even a large office building, just a few degrees off the Equator, can be designed in accordance with the requirements imposed by the sun.
Incidentally, when charts are placed adjacent to one another, one has, in addition, a ready visual picture of the sun’s relative position throughout the year, as well as factual data concerning its altitude and azimuth.
The Paul Siple “House Beautiful” Method consists of a graphic portrayal of altitudes and azimuths for mid-month dates every month of the year, as illustrated in Figure 21.
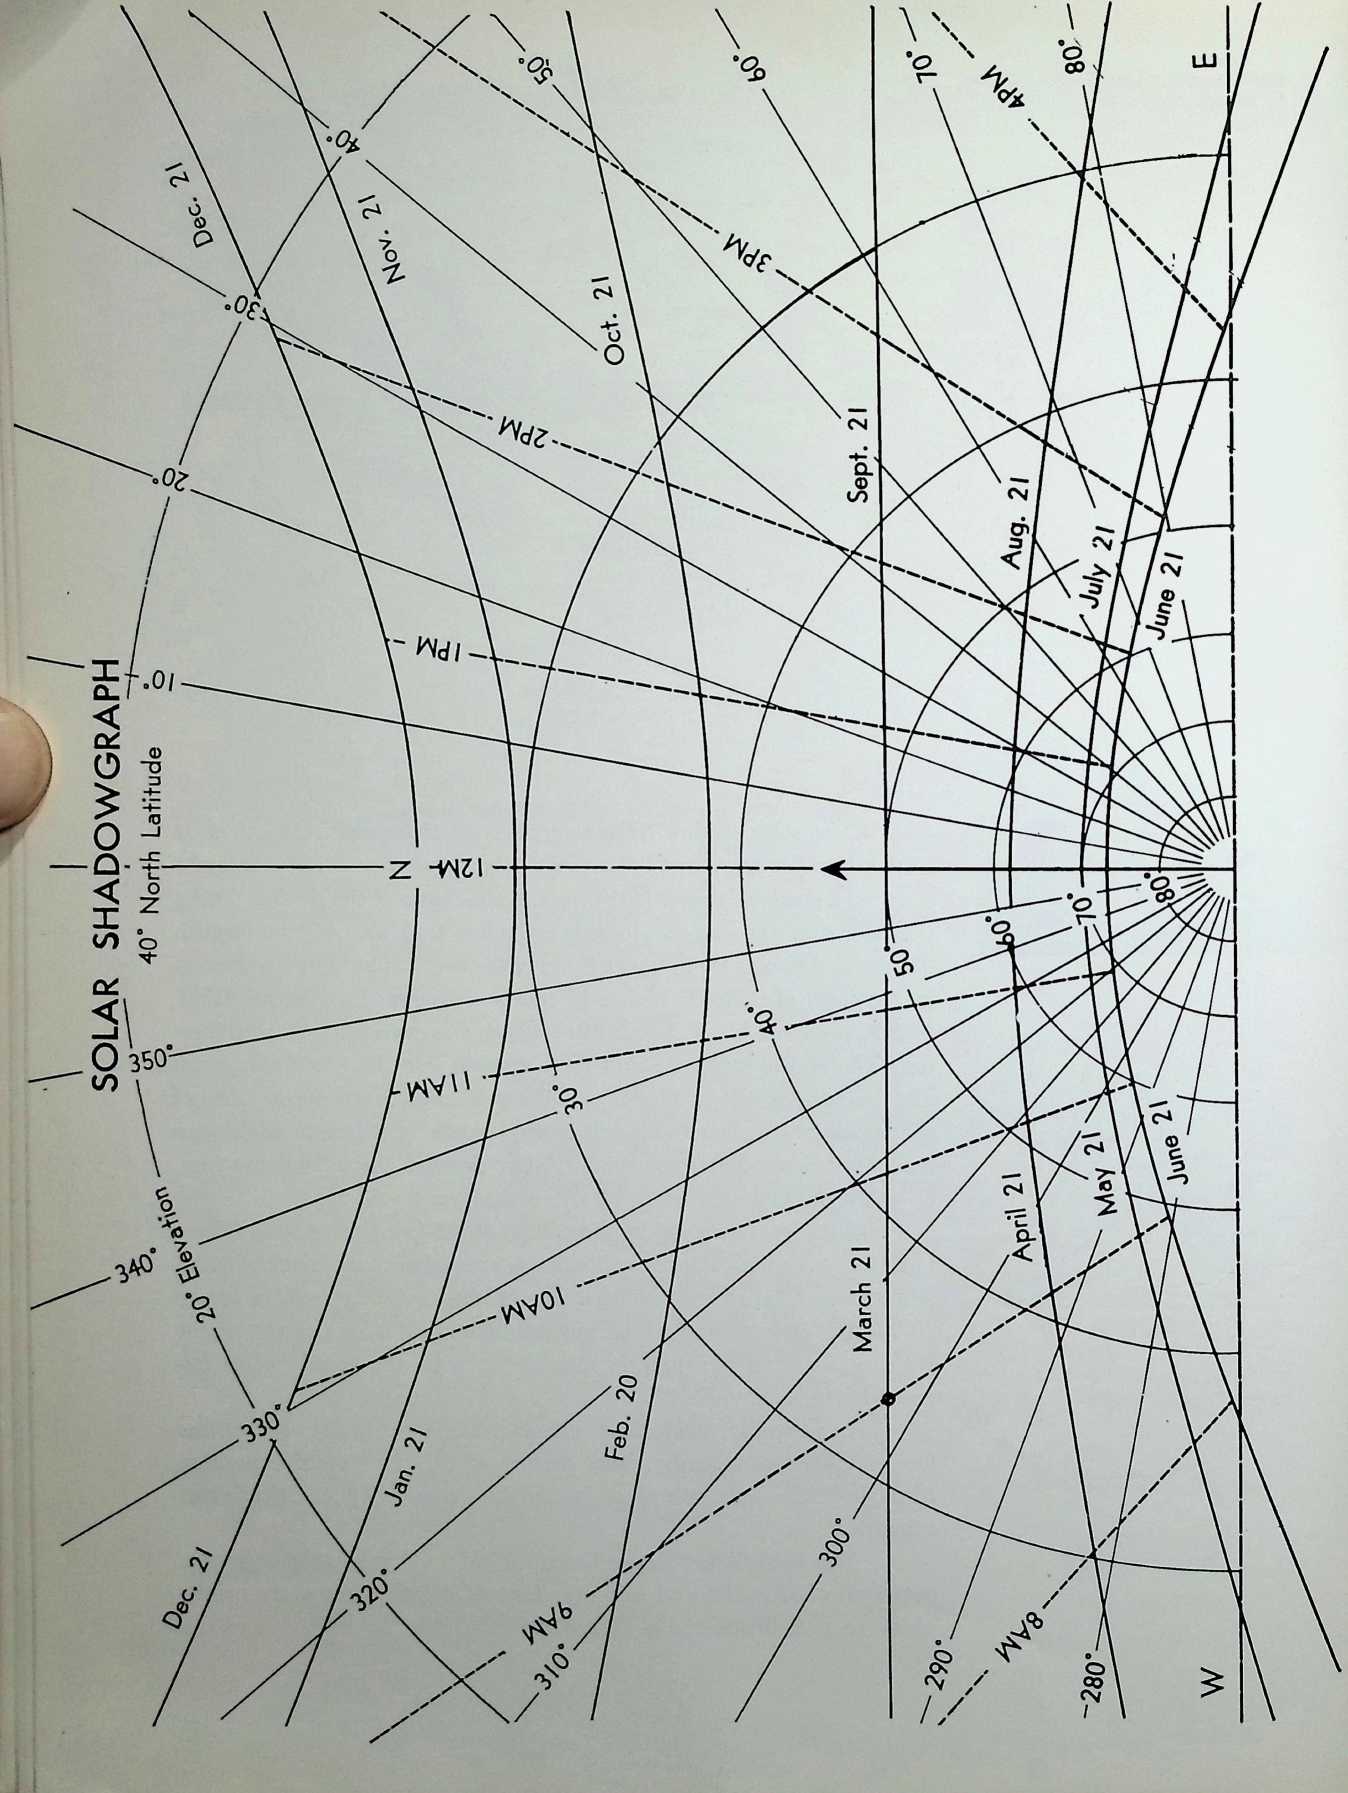
The major fault here is that intermediate angles between the highest elevation at noon and the lowest at sunrise-sunset have to be guessed because they are not given in the form of figures.
“Solar Design Charts” have been issued by Kayess Enterprises, Stanford, California. Several charts are provided: solar elevation chart, solar azimuth chart, solar shadowgraph chart, and profile elevation chart. In my opinion the solar shadowgraph charts are the most interesting. A copy of one, for 40° North latitude, is reproduced in Figure 22. It will be noted by the reader that the curves here are very similar to those illustrated for the Solar Shadow Trace Diagram, although they are so drawn that all the information is indicated on one chart, rather than on several.
The most complete solar design charts available are those issued in the Textbook of Town Planning by the Royal Institute of Technology, Stockholm, Sweden. Gunnar Pleijel, noted Swedish architect, developed these studies at the Institute, where he has an entire laboratory equipped only for sunlight and daylight problems. (Mr. Pleijel’s other activities in this field are discussed in a later paragraph.) Two of his charts, which are prepared quite neatly, are illustrated in Figures 23 and 24. Neither applies to latitudes in the United States; in fact, the “Soldiagram” for latitudes 63, 64, and 65 degrees illustrates the presence of the midnight sun in the months of May, June, and July! But, of course, similar charts for other zones can be prepared; Pleijel has already given us several studies.
Figure 22. This chart shows to a scale of }/£-inch per foot the locus of the shadow of the tip of a vertical ten-foot pole (length of arrow) for various times of the year forming the family of solid curves having the hyperbola-like shape. On these curves time of day is shown by intersections with the dashed straight lines. This data is presented over coordinates of solar elevation, circles about the reference origin, and azimuth relative to North, radial straight lines for the reference origin.
Example: Find the elevation and azimuth of the sun al 9 a.m. on September 21. Reference to the point marked by the small circle shows that the sun is at an elevation of 33° and an azimuth of 123° since the shadow angle is 303°.
“Soldiagram 1-7 (1947, 1948). Sun- (path-) diagrams for Sweden showing the position of the sun at different times of the year and times of the day for every second degree of latitude, 68°, 64°, 62°, 60°, 58° and 56°.
“Soldiagram 8 (1948). A special shadow-diagram, which can be used for designing of the sky line of houses, trees, etc.
“Soldiagram 9 (1948). Description of the sun-diagrams and the shadow-diagram.
“Soldiagram 10 (1948). Time corrections from True Solar Time to Mid-European Time for different parts of Sweden.
“Soldiagram 11 (1948). Description of the use of the sun-diagrams and the shadow-diagram for calculations of insolation.
“Soldiagram 12 (1949). Construction of shadows by aid of the sun-diagrams. “The little sundial” and its use for shadow studies on models. [See discussion in later paragraph.]
“Meterologi 1 (1948). Table showing per cent sunshine (probable sunshine in per cent of possible) for some places in Sweden, and the division of Sweden into five parts with different cloud characteristics.
“Solbelysning 1-2 (1949). Recommendations for sunlighting of dwellings, offices, factories, schools, playgrounds, etc.”
It is unfortunate that these charts have not been published in English. One is obliged to refer to the original Swedish version for information on this subject. But it is said that the art of architecture, as
5
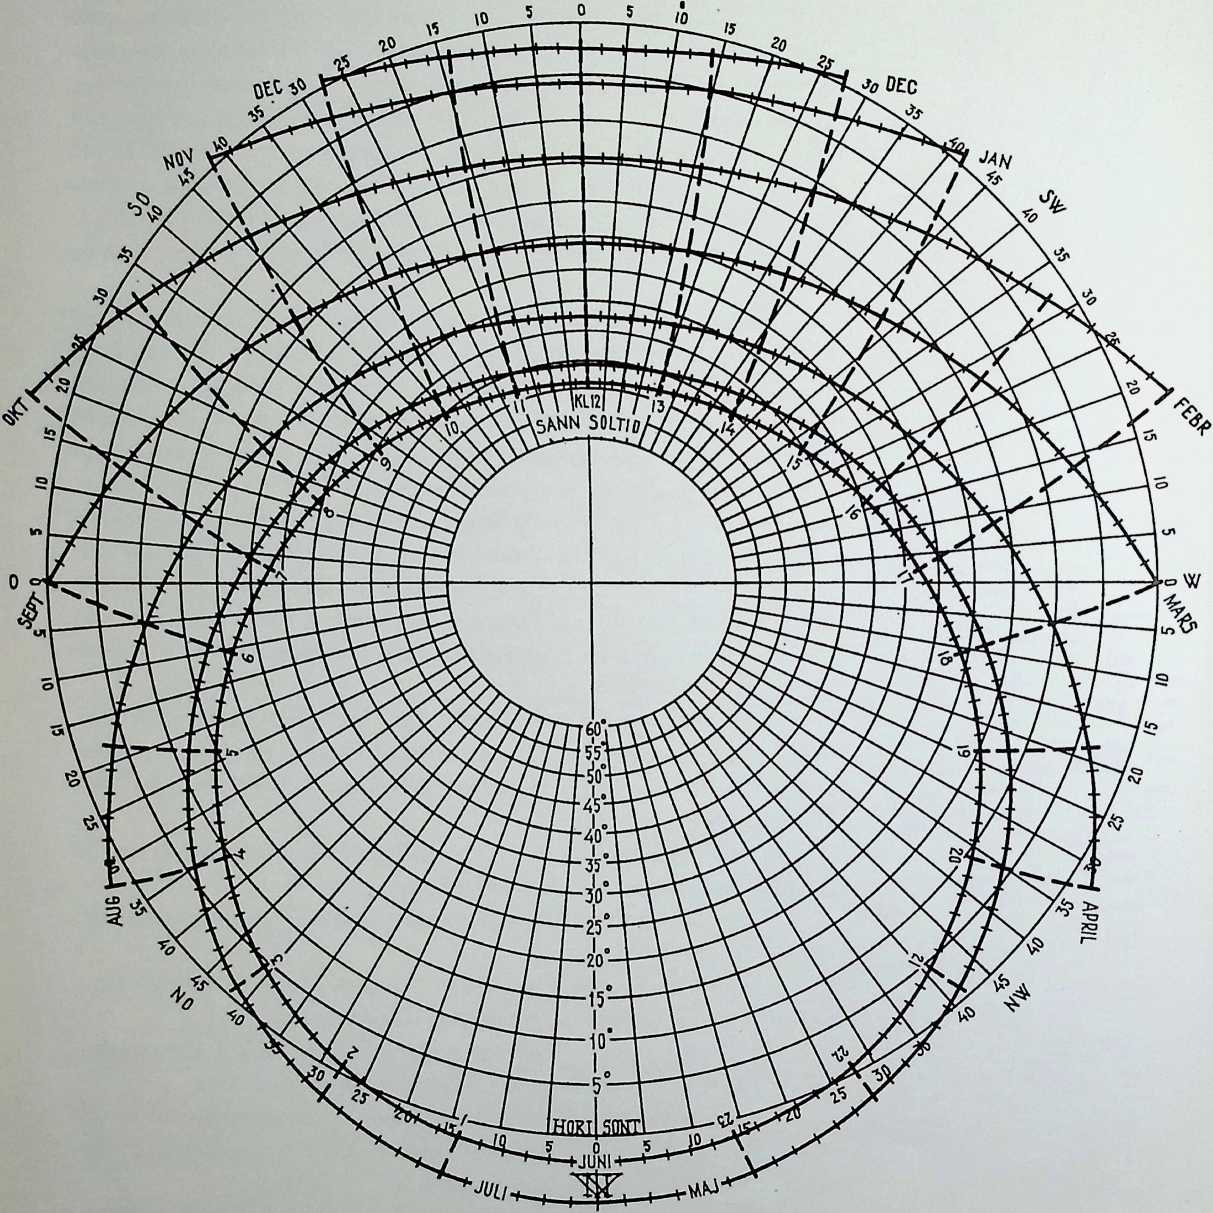
Figure 23 (above). Soldiagram for 63°, 64°, and 65° N. Figure 24 {page 35). Soldiagram for 55°, 56°, and 57° N. These studies were developed by Gunnar Pleijd.
5

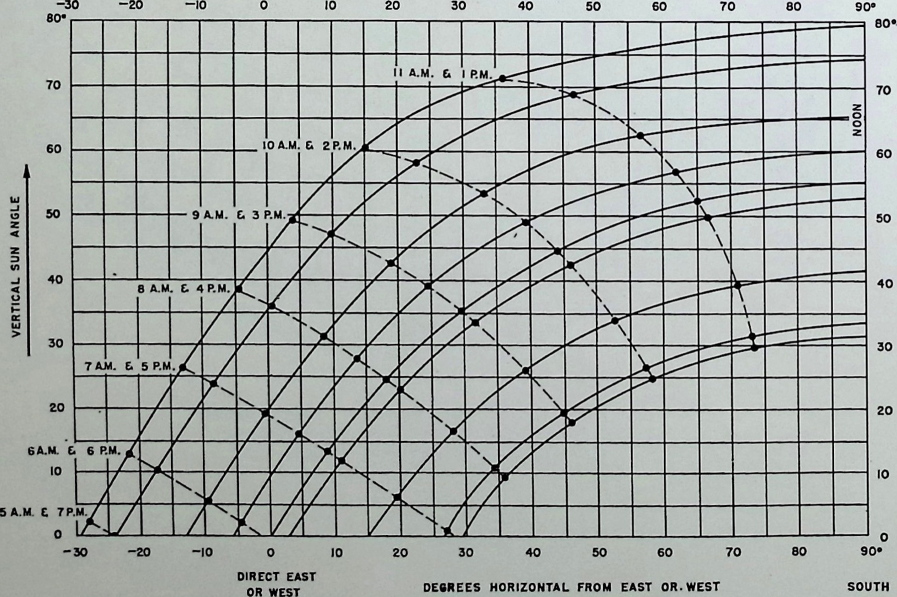
Figure 25. The Antonin Raymond graph method for plotting sun angles.
CHART OF THE SUN ANGLE THROUGHOUT THE YEAR IN TOKYO LATITUDE 35* 40 NORTH
nusic, knows no international barrier, so the language obstacle, for anyone desiring to hurdle it, is really negligible. (By the way, Mr. Pleijel has a perfect command of English.)
The Antonin Raymond graph method is one of the better means of representing sun angles, as the sun’s path during the entire year may be conveniently shown on one sheet. Raymond has illustrated this for the latitude of Tokyo, Japan, (35°40 N.) in his fine book, Architectural Details. (See Figure 25.)
A diagram for solving navigational problems has been published on the reverse side of the May, 1941, and June, 1952, editions of the Pilot Chart for Central American Waters, issued by the U. S. Navy Hydrographic Office, Washington, D. C. A reproduction of the 1952 chart is included here through the courtesy of the Hydrographer, and it may be used by architects to determine the altitude and azimuth of the sun on any given date. Although it appears complicated at first glance, it is, in reality, a very handy diagram.
The abbreviations used for our calculations are as follows:
H = Calculated altitude
T = Hour angle in degrees (see page 48 for explanation)
L = Latitude (assumed)
Az = Azimuth
D or Dec. = Declination (see page 48 for variation during year)
Co. Dec. = 90° Dec.
Co. H = 90° - H
(Other abbreviations are not necessary for our purposes)
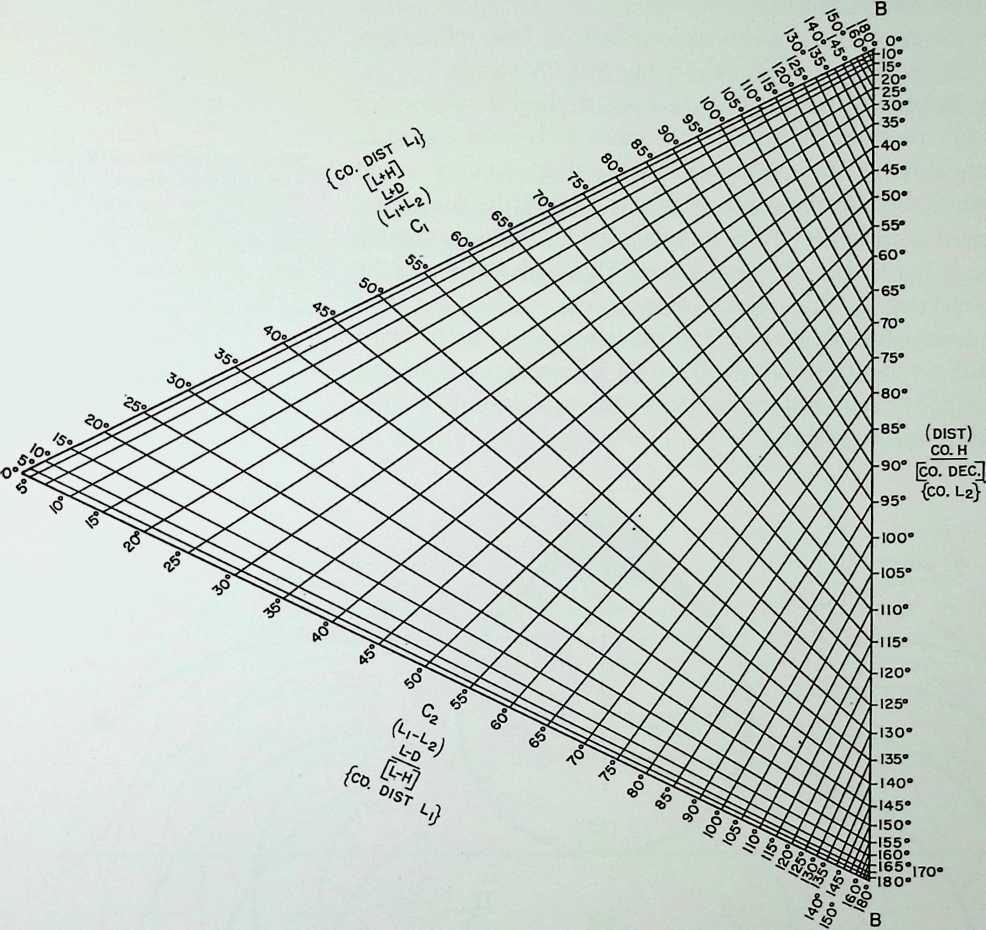
A .S’®: 15® ■ 20® 25® 30“
35
(D.LO)
A
40’-
45“-
50’
55’-
60’
65"
70®
75“
80“
85“
90’
95“
100’-
105’-
110“
115®-
120“-
125®-
130’-
135’-
140’
145’
150“-
155’
160®- 165®- 170’- 180®1
Here is an example which illustrates how one may calculate the sun s altitude-.
Figure 26. Pilot chart for Central American waters. U. S. Navy Hydrographic Office, Washington, D. C.
Given:
Lat. = 25° 36 N
Dec. = 4° 06N
t = 70° 12
To find H:
Join point determined by intersection of line
L + D ° 42 on Scale Ci with line
L D = 21° 30 on Scale C2 to scale point t 70° 12 on t “A” Scale. Read 70° 23 Co. H, 19° 37 H, on Co. H “B” Scale
Here is an example which illustrates how one may determine the sun’s azimuth (after determining the altitude from the above method):
Joint point determined by intersection of line
[L + H] = 45° 13 on Scale Ct with line
[L H] = 5° 59 on Scale C2 to scale point Co. Dec. 85° 54 on [Co. Dec.] “B” Scale. Read Az. 94° 56 on [Az.] “A” Scale.
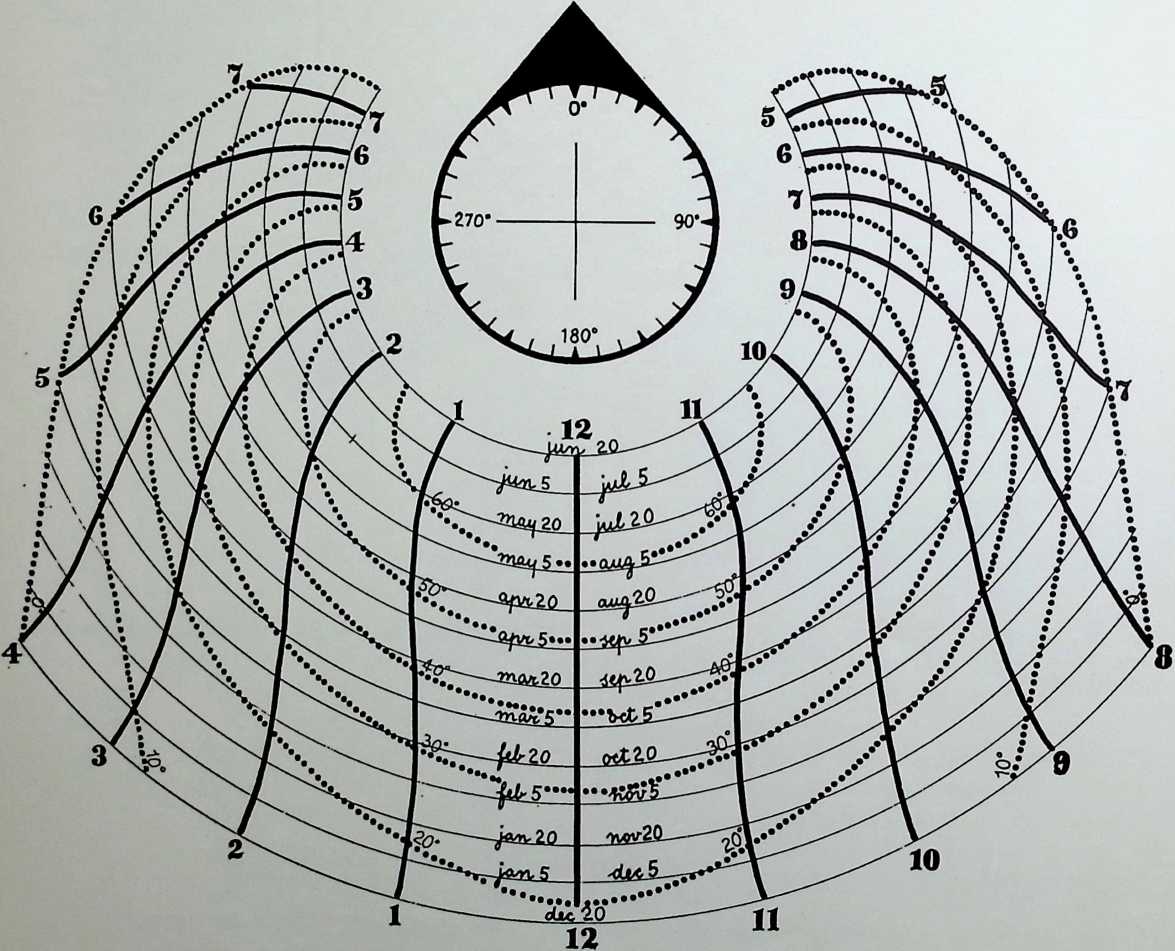 Geoffrey Baker and Bruno Funaro have devised a scheme for depicting the sun’s position, called the Sunfinder. It is quite useful in that nearly all the information is contained on one chart, while a second is used merely to determine the depth of penetration of the sun into a room. It has been calculated for every five degrees of latitude, although just that for the 40° parallel is illustrated here. The reader will note the very clear presentation of this chart. Intersections of the light lines (dates) and the heavy lines (hours) will indicate the sun’s altitude, when reference is made to the dotted lines. If a line is connected from this same intersection to the center of the compass, the sun’s azimuth at that particular situation will be found.
Figure 27. Baker and Funaro’s Sunfinder for latitudes 45° to 50° N.
Besides the diagrammatic method, the sun’s position may be determined by means of the three-dimensional method with models. The heliodon was developed in the early 1930’s at the Building Research Station, England. Modifications of this have since been made in England and elsewhere. Notable are the Australian solarscope and artificial sky. An artificial sky has also been developed at the Royal Institute of Technology in Stockholm, Sweden, and the Texas Engineering Experiment Station.
Figure 28. Baker and Funaro Shadow Length Scale. Degree lines are sun’s altitudes as determined from Figure 27. To find depth of sun penetration through window whose head is 7 ft. above floor, for example, measure along 45° heavy line at the scale of the drawing. Then follow converging lines up or down, until you intersect the line of altitude in which you are interested, say 35°. From this intersection to the left edge of the Scale will be the shadow length at the scale of the drawings. Then repeat process for sill height.
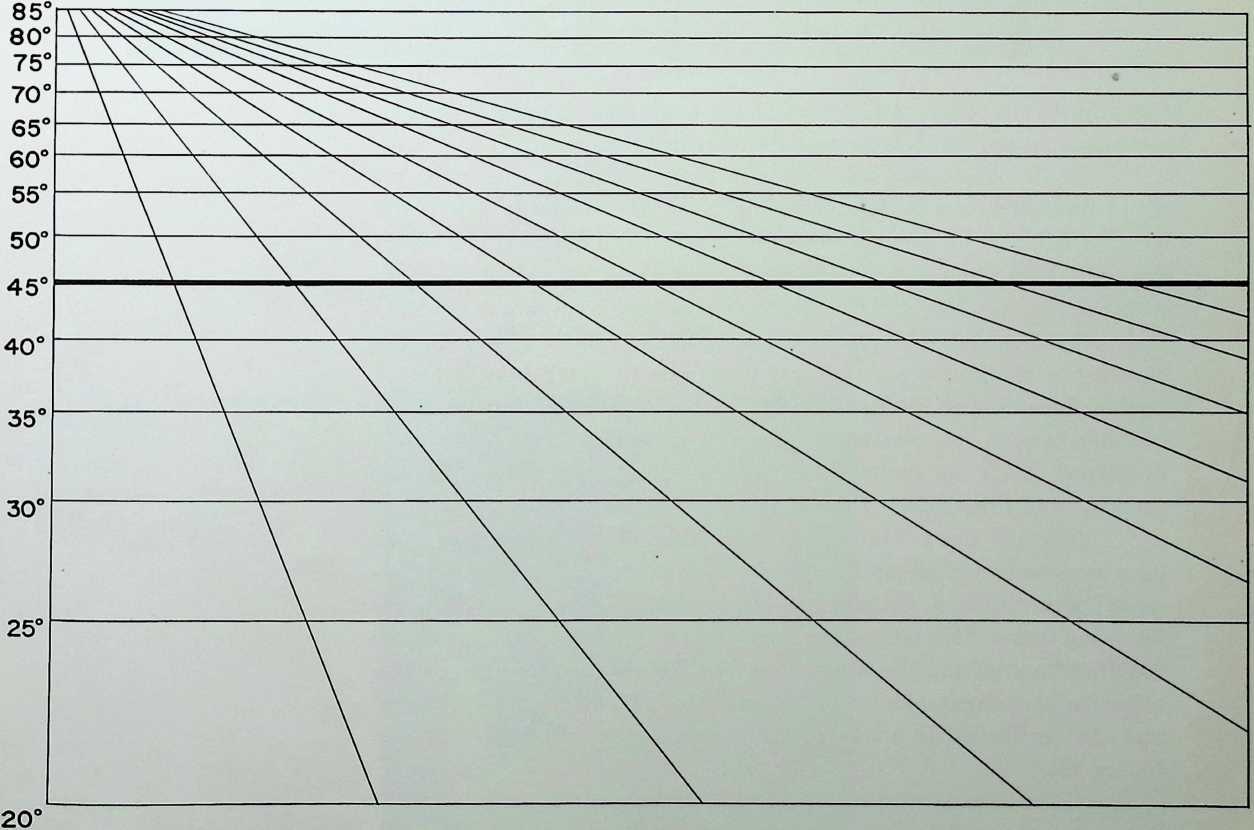 The heliodon enables one to analyze problems with the aid of models. Large schemes can be examined without difficulty. In essence it consists of a table to represent the earth and a light source to represent the sun. In the British heliodon there is a stationary light projected on to a tilting and rotating platform on which the model to be studied is placed. The platform rotates about a vertical axis to simulate changes of the fall of sunlight at different times of day and tilts about a horizontal axis for different latitudes. The only adjustment entailing movement of the lamp, which represents the sun, is for the season of the year, and
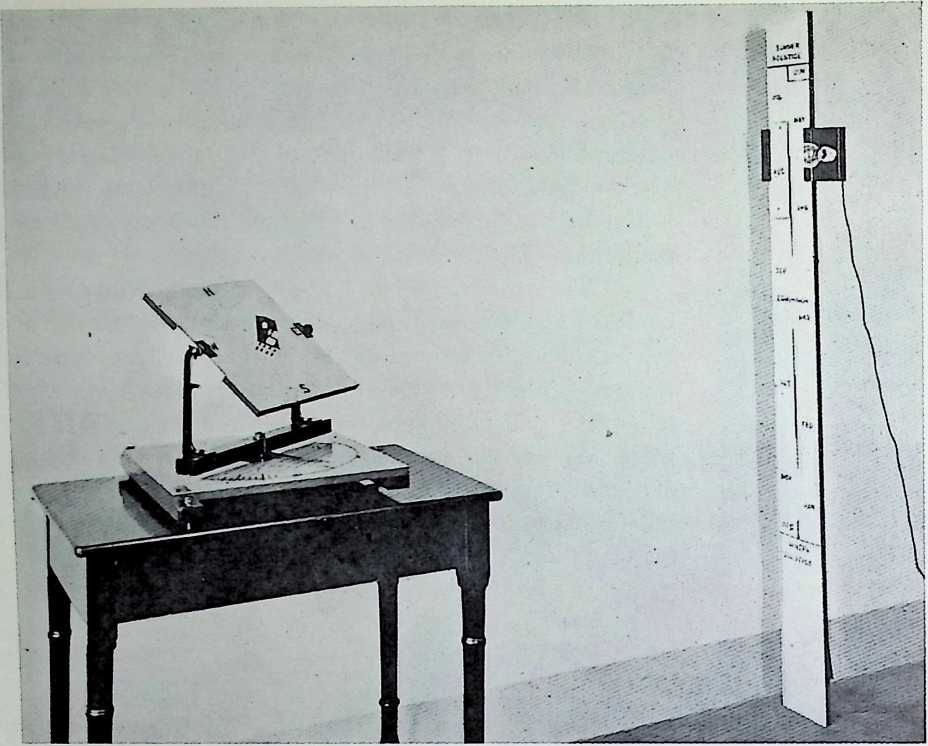 this adjustment is effected by sliding the lamp upon a vertical scale of solar declination, which is conveniently divided into months.
Figure 29. The British heliodon.
In the Australian solarscope, on the other hand, the model remains immobile on a platform which neither tilts nor rotates. It is the beam of light, on an arm controlled by a worm and pinion drive, which revolves about the platform according to settings for latitude, season, and time of day. Thus it is possible to demonstrate to groups of students with a fixed model, whereas with the heliodon it is necessary for the observer to change his position and sometimes to watch from awkward angles. According to the British, it is interesting to note that when the heliodon is used and plastic models employed, an attitude to design is developed which can probably best be described as “the sculptor’s approach,” and to architects this often has a significant value.
There is also a little device called The Little Sundial which has been designed by Gunnar Pleijel whose Swedish Soldiagrams have already been noted. A pamphlet issued by Pleijel describes this in the following terms: “No intricate set-ups and no expensive instruments are required for studying the distribution of shadows on a town or the distribution of sunlight admitted through a window into a room.” The sundial can be likened to a box with an open top and inclined sides (see Figure 30).
“The sundial works as follows [Pleijel explains]. A pin fitted at the centre of the dial serves as a style, and casts a shadow on the horizontal bottom surface and the four inclined side walls. The bottom and the walls are provided with a shadow diagram consisting of month curves (full lines) numbered from I to XII (January to December) and hour lines (dash-lines) numbered from 1 to 24. Moreover, half hours are indicated by short cross lines on the month curves. The intersection of a month curve and an hour line marks that point, which the shadow of the pin head shall reach about the 20th of the month corresponding to this curve and indicated on the edge of the sundial, and the hour expressed by the number of the hour line. . . . These sundials are manufactured for every second degree of latitude (even numbers of degrees), and can be used to a close approximation in the zone between the next higher and the next lower degrees of latitude.
“The source of light can be either the natural sun or an ordinary drawing-table lamp. In the former case, the model shall be placed outdoors or close to a window. In the latter case, the distance from the model to the lamp shall be as long as possible, not less than 3 metres (10 feet), in order that the rays of light should be as parallel as possible. . . .
“The sundial is placed on the model or on its base plate, e.g., a drawing-board, so that the bottom of the sundial is parallel to the horizontal plane of the model and the arrow marking north and south line of the sundial is parallel to the corresponding arrow of the model and points in the same direction. After that the position of the model is adjusted by turning and tilting until the shadow of the pin head touches the point on the sundial corresponding to that time at which it is desired to study the shadows or the sunlight.”
As accurate studies require certain time corrections in order to correlate true solar time and mean solar time, the architect has provided a simple correction table of minutes which must be added to or subtracted from that time of the clock at which the shadows are to be studied. There is also a correction for longitude which is given in a s[imi]{.underline}- lar table and can be easily applied.
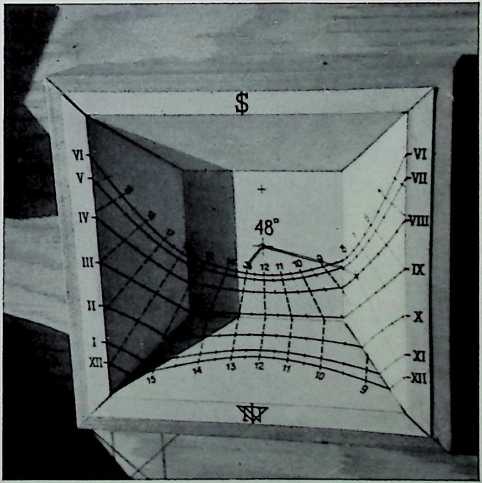
Figure 30. The Little Sundial designed by Gunnar Pleijel.
Figure 32 (right). Solaranger designed by Dr. L. W. Neubauer.
Figure 31 (left). The Little Sundial and school model.
Figure 31 shows an analysis photograph of sun conditions on a proposed school, which Pleijel, as a consultant architect, made using the Little Sundial (to the left in the photo). The model represents part of Hogasenomradet in Arvika, Sweden, and illustrates a suggested place for a school playground designed by Bengt Ostnas, Vattenbyggnadsbyran, Goteborg. The playground is seen in the cleared area on the top righthand side of the site. This photograph simulates conditions in March or September at 10 a.m. Shadows of the trees appear as small cones on the model; Pleijel joined up such shadows for different times of the day, month, and year to determine what the shadow contours would be and whether it would be advisable to site the playground in that location from the insolation point of view.
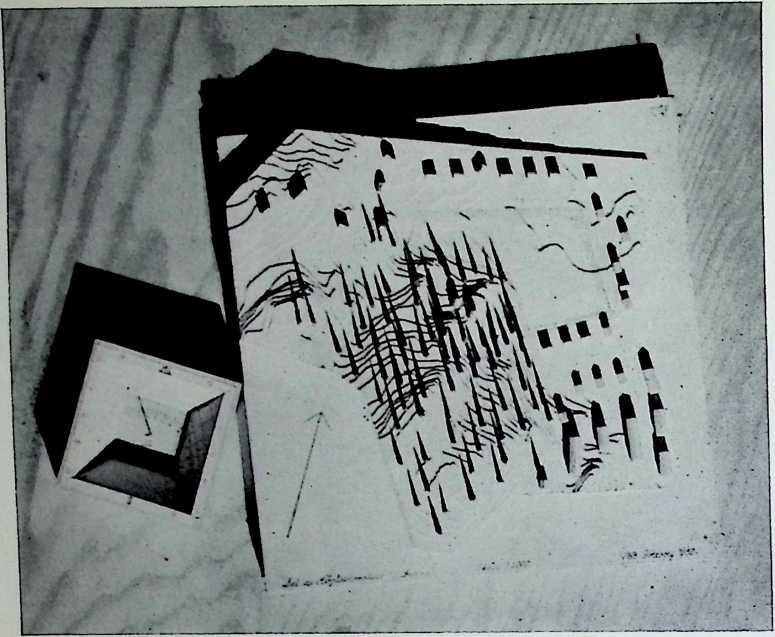
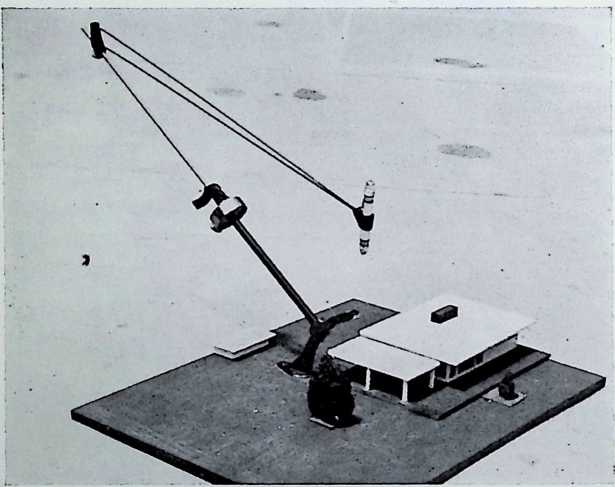
Similar to the Little Sundial, but less accurate, is an American instrument known as the Solaranger, designed by Dr. L. W. Neubauer of the University of California, Davis, California. Its specific purpose is “to study the positions and effect of light and shadow around farm buildings and through windows and to aid in orienting buildings and locating doors, windows, roof overhangs, and shade trees.” The designer claims that the Solaranger can be easily transported and set up on a table or a drawing board. Figure 32 shows the Solaranger with a flashlight set in a sun position of early afternoon, casting shadows under the carport and under the south overhang. This exact position, notes Neubauer, applies only to the center location on the board where the carport is shown. He says that the small house model to the left rear is actually of better size for studying shade and shadow but is not as accurate as the larger model.
Its uses are described as follows:
-
House. In connection with housing problems, particularly for south exposures, special interest lies in window heights and sizes, roof overhang, and size and position of shade trees. In some cases, east and west walls are closed to avoid extreme sunlight and heat in the summer period.
-
Poultry. The poultry house problem may be similar to that for residences. In fact, this study probably preceded the other, as chicken houses for many years have generally faced south and often utilized roof overhangs and large wall openings. Some have also used special screens, shades and louvers.
-
Hogs. Hog houses are frequently similar in design to poultry houses. Special consideration may be given to hot regions and seasons, in order to provide large, cool, shade areas. Monitor roofs are sometimes used to obtain maximum fight and heat in cold weather.
-
Cropped furrows. Paper shields and ‘brushing up’ will aid in conserving sunshine on planted furrows. They reflect and re-radiate extra sunshine onto a narrow strip of soil.
Some may contend that these remarks are not of immediate relevance to problems of architects! Yet they do serve to illustrate some of the features and to acquaint the architect once more with the fact that he must often turn to other sciences for inspiration in his own work.
The artificial sky, as developed by the Australians, refines the problem of studying sunlight to a greater degree than any of the devices above described. It is designed for the study of direct and reflected light inside a building. Its purpose is to overcome the problem of the continual change in natural light intensity from the sky caused by cloud movement and other factors. “While direct light from the sky received at a point inside a building can be calculated,” advises the RAIC Journal, “this is not so -with light reflected from walls and ceiling. Measurement is necessary for reflected light, and unless the source of the reflected light is of constant strength, the series of measurements covering a whole room or building is useless.” It is pointed out that the artificial sky offers the only chance of obtaining such a constant source of original
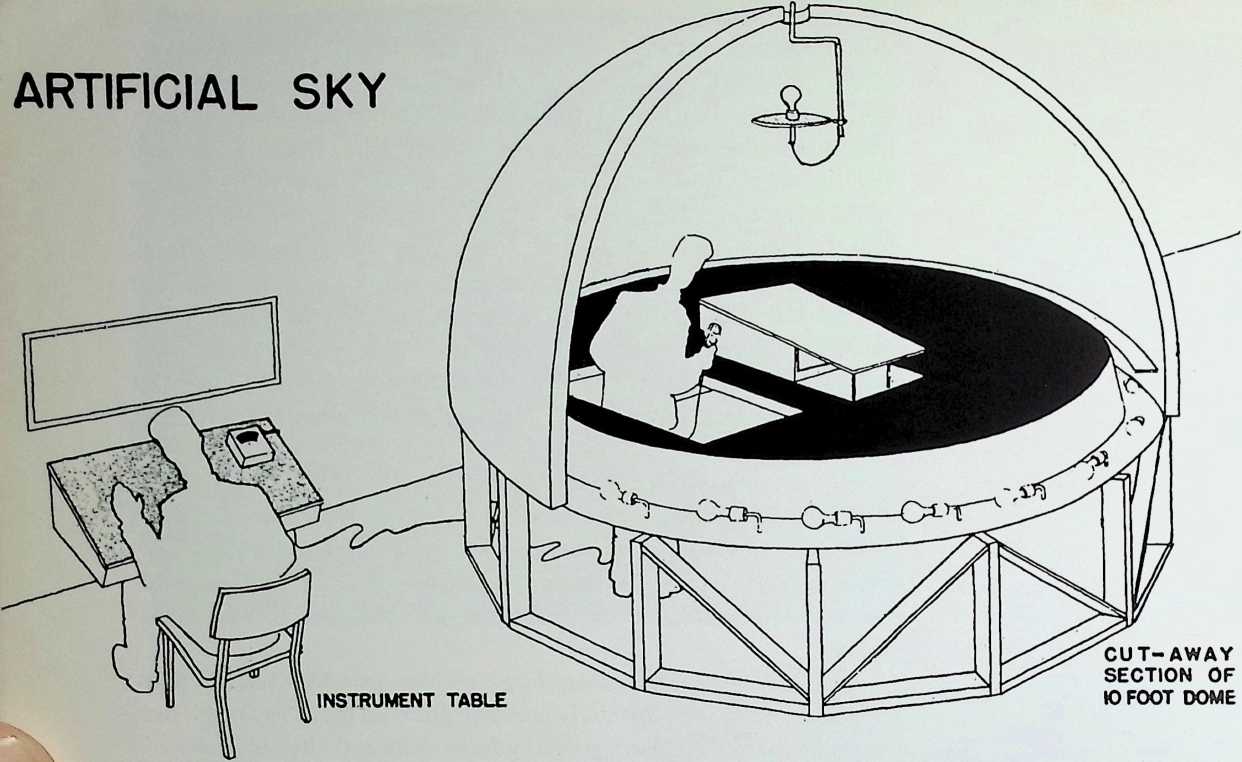
 light. Scientists of Australia will soon begin a continual series of measurements of the light of the sky so that these can be related to the readings made with models and some comparison made with the intensities provided by artificial lighting.
Figure 33. Artificial sky built at the University of Texas by Vezey, Caudill, Reed, and Bellomy.
The full-scale apparatus will have a bowl about 24 feet across and 7 feet deep. It will be elevated and fitted with a platform so that scale models can be held at the level of the bowl-base and measurements taken inside them. Thus it is a little too large for almost all private architectural offices to handle, which is quite unfortunate.
At the University of Texas, Vezey, Caudill, Reed, and Bellomy have constructed an artificial sky with a 10-foot inside diameter, “the surface of which is finished white and illuminated by thirty lamps placed in a trough.” (See Figure 33.) Their report concerning this equip nent notes further that the “lamps are adjustable so that the intensity as well as distribution of illumination on the walls of the hemisphere can be controlled.” There is also a fixture hung from the center, with which other lamps might be used to attain a still greater variation. The Texans studied the accuracy of results obtained by using the artificial sky, and they found, significantly, that it is feasible to draw conclusions from observations on models made in the artificial sky, provided certain methods are followed. It is notable that their decision was based on comparisons of full-size and small-scale models of buildings under question.
In Sweden, architectural lighting authority Gunnar Pleijel has devised and used -with success his own versions of the artificial sky. There are three basic types of models that he used: the basic artificial sky; the exterior model, used to represent streets, courts, and an unob-
structed sky; and the room model for testing lighting conditions in rooms. The first type is shown in Figures 34 and 35. Pleijel notes that this artificial sky could have been designed by constructing a cupola and lighting it from below; however, several difficulties in trying to obtain a passably uniform brightness are met with this way. So he constructed a box, 1.60 by 1.60 meters in plan and 0.70 meter in height, joined together by means of 1 inch by 1 inch wood bars. “The bottom of this box consisted of cased opal glass, the opal layer being depolished and facing downwards. The interior of the box was painted white. Four incandescent lamp holders were fitted on the lower side of the lid, and were placed so that the illumination of the cased opal glass bottom should be as uniform as possible. The lamps were provided ■with hanging bowls so that only indirect light and no direct fight from the lamps should reach the glass bottom. By means of this arrangement the glass bottom was lighted very uniformly. On the other hand, it was not possible to depolish the glass bottom so evenly as to obtain equal transparency at every point. Irregularities were visible to the naked eye. Seen from below, the cased opal glass bottom served as an artificial sky. The second type is illustrated in Figure 36. It portrays a three-dimensional framework of the exterior
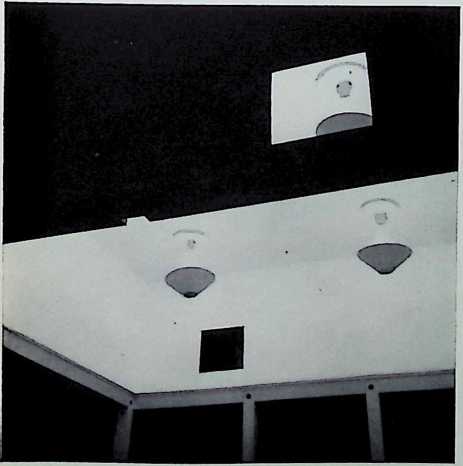
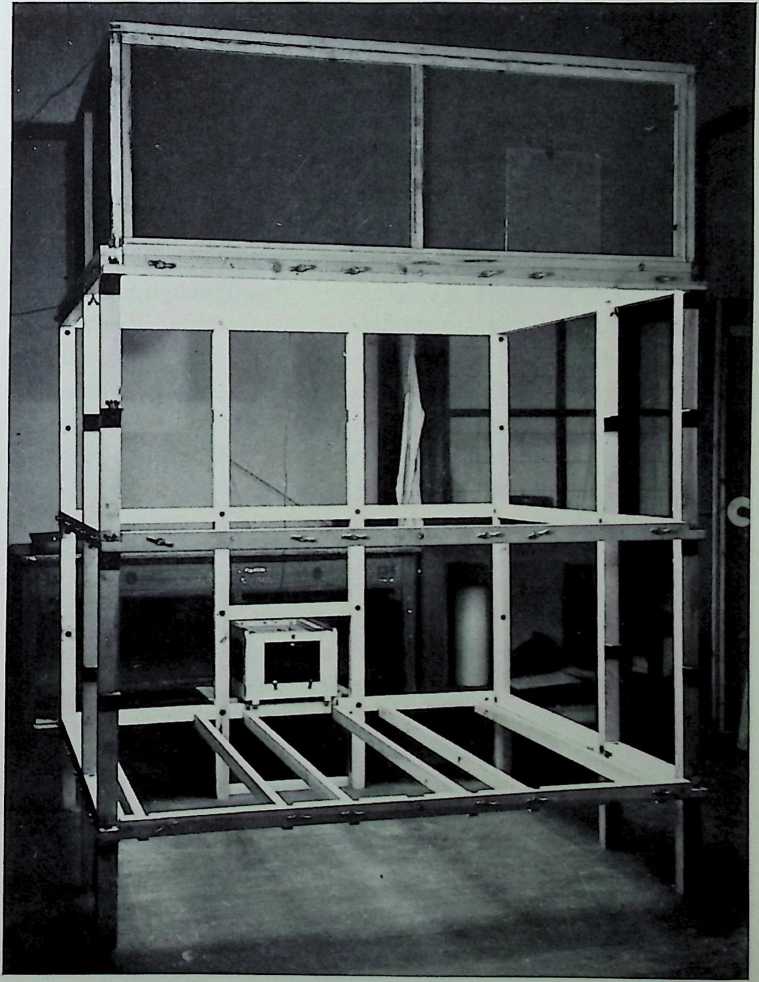
Figure 34 (below) and Figure 35 (right). Gunnar Pleijd’s artificial sky.

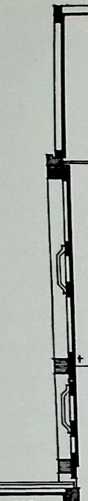


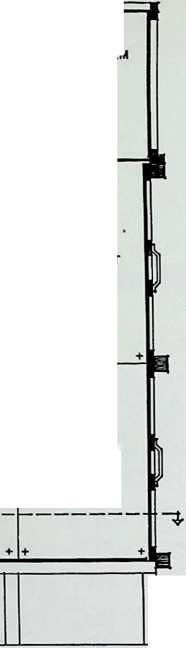


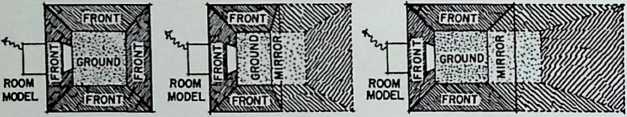
PHOTOCELL
TO GALVANOMETER
HOUSE FRONT OR MIRROR
HOUSE FRONT OR MIRROR
ROOM MODEL
300 DLM
GROUND^
HOUSE FRONT OR MIRhOR
HOUSE FRONT OR MIRROR
HOUSE FRONT OR-MIRROR
HOUSE FRONT OR MIRROR
300 DLM
[CASED OPAL GLASS BOTTOM-^]{.underline}
FLOOR
COURT, 20X20 M COURT.26X20 M
C0URT.40X20M
Figure 36 {top). Chart of Gunnar Pleijel’s artificial sky. Figure 37 {bottom). Pleijel’s room model set-up.
model, with the artificial sky located on the top. Figure 37 shows the room model set-up, which is fairly similar to the second type.
From tests performed on this equipment, Pleijel prepared tables listing various conditions for different types of sunlighting in a very detailed manner that is quite readable and interesting. Pleijel used these statistics to elucidate certain aspects of daylighting problems concerned with type of town plan, spacing of houses, height of houses, color of house fronts, and color of ground surface; height of windows above ground level; height, width, and design of windows; position of windows in walls; and dimensions and colors of rooms.
Another very interesting device in this category is the Loomis Sunshine Analyzer. It was developed privately by a client of William Lescaze, in cooperation with him, and there are said to be only three models in existence. It will be noticed in the close-up view of the Analyzer, in Figure 39, that the top disk can be turned and adjusted in any desired manner. When models are affixed to the top, sun analyses can be made for any given day of the year. Thus the device is, in effect, a heliodon, and a very handy one too. Mounted on the Analyzer in Figure 40 is Lescaze’s model of sun louvers for a proposed office building in mid-town Manhattan. By adjusting the angle of the louvers themselves, Lescaze decided on an appropriate design for the entire west wall. The result is seen in the attractive building depicted in Figure 38.
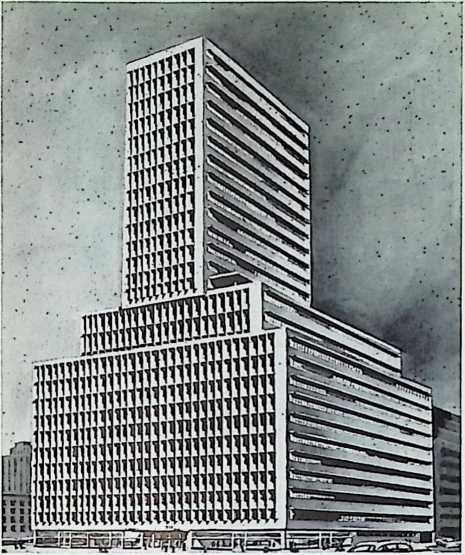
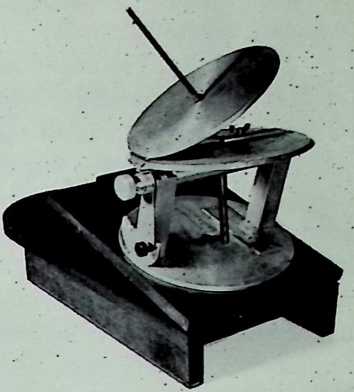
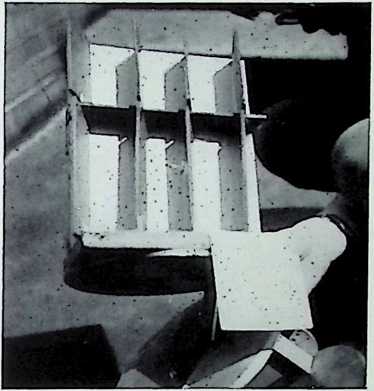
Figure 38 {left). Proposed office building for midtown Manhattan by William Les- caze, architect. Figure 39 (right). Loomis sunshine analyzer. Figure 40 (below). Model of sun louvers mounted on sunshine analyzer.
A third way to determine and record the sun’s position is the statistical method. Here the various altitudes and azimuths of the sun for different months and hours are listed in and used from table form.
The architect must use these figures in trigonometrical processes to determine where sun and shade will fall in various architectural situations.
Frank Lloyd Wright has taken account of the path of the sun in the design of many of his buildings. The results are perhaps particularly evident in his design for the Sturges home, 449 Skyway Drive, Los Angeles. The overhang is not symmetrical with the rest of the structure when viewed from the “front” because of the path of the sun. See Figure 41.
To determine the azimuth and altitude of the sun for a particular date or hour, one must first of all have a knowledge of the precise meaning of certain terms.
Azimuth is the angle of the sun measured horizontally from the North meridian. For morning hours it is measured in an easterly direc
Figure 41. Sturges home. Frank Iloyd Wright, architect.
tion; for afternoon hours, in a westerly direction. Thus noon is represented by 180° 00 E. or W.
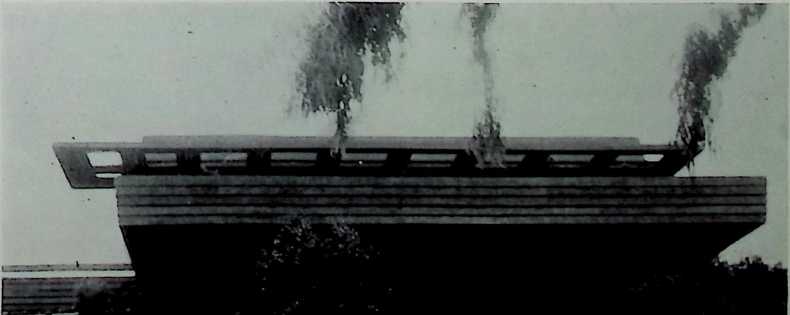
Altitude is the angle, measured vertically, between the sun and the horizontal plane of the horizon. The altitude is zero at sunrise and sunset and is a maximum at noon.
Declination is the angle between a line connecting the centers of the sun and earth and the plane of the equator. It is 0° 00 at the equinoxes. When north of the equator it is given a plus sign; when south, it has a minus sign. It is 4*23° 27 on June 22, and ° 27 on December 22. Between these dates it varies. The declination of the sun for any day of the year can be obtained from the Nautical Almanac, issued by Her Majesty’s Stationery Office, London, or the American Nautical Almanac, United States Naval Observatory, Washington, D. C. They change very slightly from year to year. However, in order to provide the reader with a handy guide, here are the sun’s declinations for key dates:

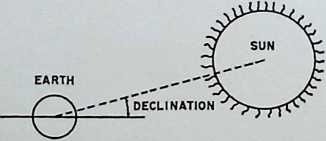
-23° 27 December
° 22
January ° 54
° 05
° 54 November
° 24
° 36
February ° 33
° 17 October
° 50
- 8° 16
March - 5° 35
- 2° 51
°
+ 2° 41
April + 5° 46
+ 8° 24
-10° 54 August
-13° 16
May -15° 44
-17° 41
-19° 23 July
-20° 49
June -21° 57
-22° 47
-23° 17 June
-23° 27
TABLE 1
Figure 42
Figure 43
Time is the local apparent sun time. Many, who know this as “sun dial time,” will realize that this is not the same time as indicated on their railroad timetables (although the author, as an often-late commuter, frequently thinks that maybe the railroads do operate on such solar time systems after all!) The time in the accompanying formulas is expressed in degrees. Since there are 24 hours and also 360° in one revolution of the earth,
1 hour = 15°
1 minute = 15
1 second = 15"
This angle is always measured from the noon position of the sun. Therefore, noon = 0°; 11 a.m. and 1 p.m. = 15°; 10 a.m. and 2 p.m. = 30°; 9 a.m. and 3 p.m. = 45°; 8 a.m. and 4 p.m. = 60°; etc.
Now, when one has established the time from this degree method and wishes to convert it to standard time, two steps must be followed:
1. Convert to local civil time by adding to or subtracting from local apparent sun time, as obtained from the degree method noted above, a certain number of minutes, which varies according to the day of the year. According to R. W. Justice, local civil time may be determined from Local Apparent Sun Time by means of the following table:
TABLE 2
On January 22
On February 22
On March 22
On April 22
On May 22
On June 22
On July 22
On August 22
On September 22
On October 22
On November 22
On December 22
Add 1 1 minutes Add 14 minutes Add 7 minutes Subtract 1 minute Subtract 4 minutes Add 2 minutes Add 6 minutes Add 3 minutes Subtract 7 minutes Subtract 15 minutes Subtract 14 minutes Subtract 2 minutes
2. Convert to standard time. Standard time is in reality the local civil time at particular meridians, which are at 15° longitude intervals east and west of 0°, which is Greenwich mean time. (The 0° longitude runs through Greenwich Observatory, which is in a borough that is part of London, England.) Four of these meridians cross the United States, as follows: Eastern Standard Time Longitude 75° W. (approximately through Philadelphia, Pa.); Central Standard Time Longitude 90°W. (approximately through New Orleans, La., and St. Louis, Mo.); Mountain Standard TimeLongitude 105°W. (approximately through Denver, Colo.); and Pacific Standard TimeLongitude 120° W. (northern part of California-Nevada boundary). In Canada there are these same time zones, plus two more: Atlantic Standard TimeLongitude 60° W. (approximately through Sydney, N.S.); and Yukon Standard TimeLongitude 130° W. (approximately through Prince Rupert, B.C.). Each standard time zone, being 15° wide, comprises 7J^° on each side of the meridian indicated above (with the exception of Yukon Standard Time). Thus, for example, Eastern standard time zone is from 67} 2° W. to 82} £° W. although there are some irregularities in this in order to provide for the same time zone in various states or along major transportation routes, as railroads, which change time at junction points only. When one is not directly on such a meridian, as is the likely case, it is necessary to adjust the local civil time obtained for the locality under consideration, by adding or subtracting some minutes as follows:
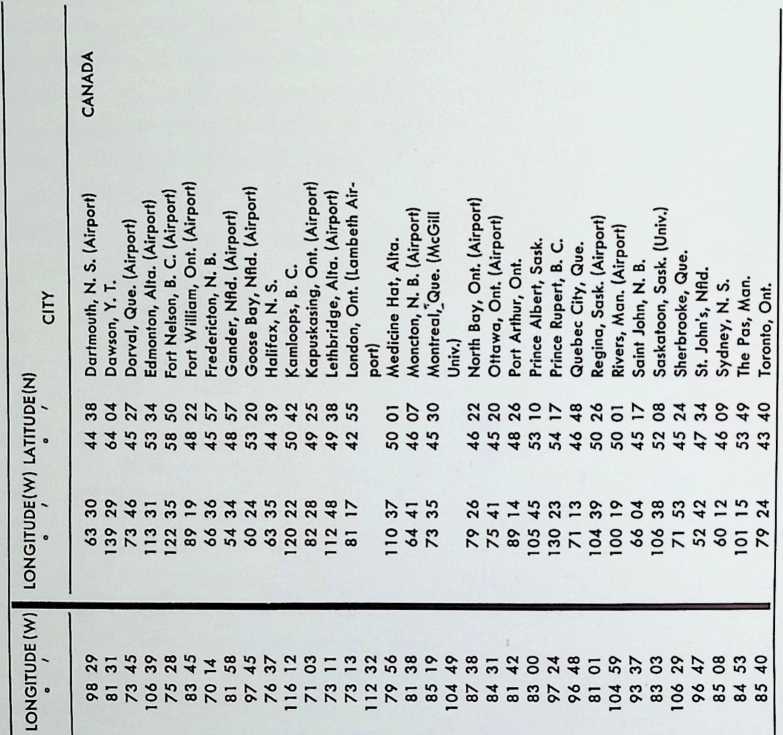
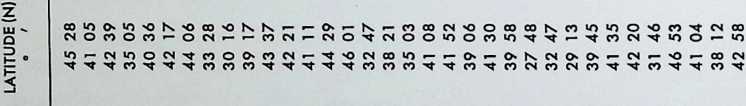

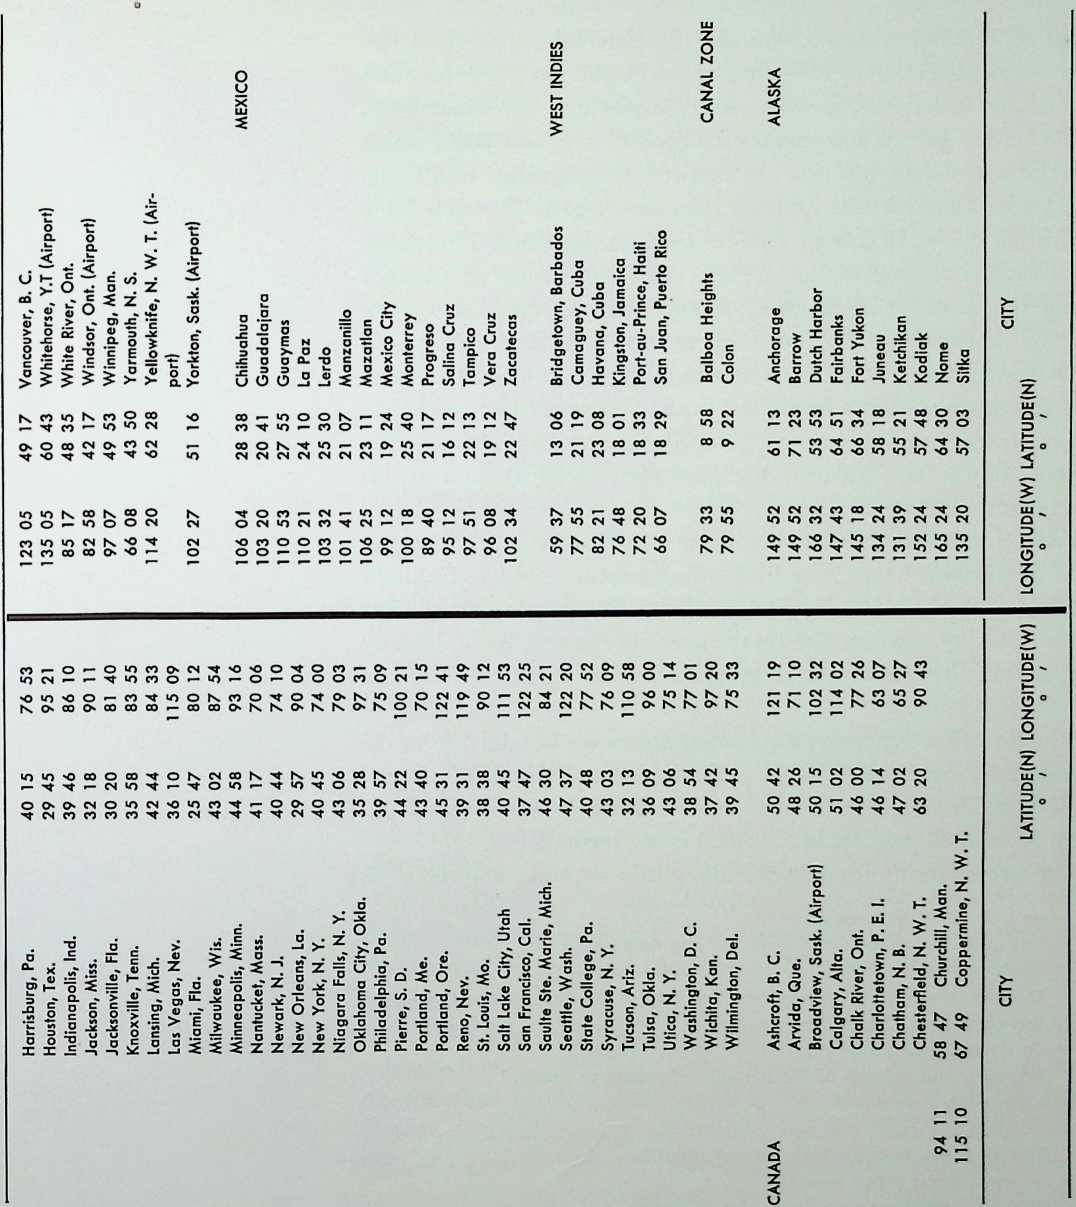
(For other listings, consult leading atlases, encylopedias, local observatories, or U. S. Weather Bureau, U. S. Coast and Geodetic Survey, Meteorological Division of Department of Transport, Canada, etc.)
If the standard time meridian under consideration is east of the locality under consideration, add 4 minutes for each degree of longitude that is in between.
If the standard time meridian under consideration is west of the locality under consideration, subtract 4 minutes for each degree of longitude that is in between. The resulting time will be the standard time.
Let us take an example. Suppose the time calculated from formula 5 in the next section is 15°this would be the local apparent sun time. Translated into hours, as we generally know them, 15° is one hour. One hour on either side of noon makes the time 11 a.m. or 1 p.m., which is still the local apparent sun time, but expressed a different way. Using just the 11 a.m. time for this example, to convert to Local Civil Time for, say, March 22, we find from Table 2 that we must add 7 minutes. Therefore, local civil time would be 11:07 a.m. Now, supposing we are considering the town of Nantucket, Massachusetts, from Table 3, we find that its longitude is 70° 06. Let us say that it is 70°, which makes this town 5° east of the Eastern Standard Time meridian. Therefore, to convert Nantucket’s local civil time to Eastern Standard Time, we must subtract 4 minutes times 5, or 20 minutes from 11:07 a.m., which gives Nantucket’s Eastern Standard Time as 10:47 a.m. in this particular example.
From 2 a.m. on the last Sunday in April to 2 a.m. on the last Sunday in September, many American cities and states observe Daylight Saving Time. The clock is advanced one hour during this period. Thus Nantucket’s Daylight Saving Time in the previous example is obtained by adding 1 hour to 10:47 a.m., which gives its time as 11:47 a.m. Eastern Daylight Saving Time.
Standard time signals in the United States are obtained from the U.S. Naval Observatory in Annapolis, Maryland, and from the National Bureau of Standards, which broadcasts on Station WWV, over 2.5, 5, 10, 20, 25, 30, and 35 megacycles, a signal every second.
Once these terms are understood, certain formulas may be used.
- sin h = sin L sin d + cos L cos d cos t
This gives the altitude of the sun for any time of the day.
- sin Z = sin t cos d sec h
This gives the azimuth of the sun for any time of the day; one must, however, first calculate “h" from formula 1.
- cos Z = sin d sec L (when h = 0°)
This gives the azimuth of the sun only at sunrise or sunset.
, sin h sin L sin d
- cos t = -
cos L cos d
This gives the local sun time for any situation.
- cos t = tan L tan d (when h = 0°)
This gives local sun time for sunrise or sunset.
It should be noted that formula 4 is, in reality, a rearrangement of formula 1; and that formula 5 is merely a simplification of formula 4.
The following formulas quickly give the noon altitude of the sun:
-
h = 90° (L d) when L is greater than d
-
h = 90° (d L) when d is greater than L and when L and d have the same sign
-
h ° (L – d) when L and d have contrary signs
The symbols used above are:
L = latitude
d = declination
t = time
Z = azimuth h = altitude
The position of the sun may be determined by the “gadget method.” The “gadget” is usually a small device on which is noted data which can also be presented under the statistical method. Such is the graphic solarmeler, designed and distributed by R. W. Justice of Raleigh, North Carolina. Altitude and horizontal direction of the sun’s rays for specific dates and hours at given latitudes are shown when a plastic disc is revolved. Mr. Justice has pointed out that the solarmeter is transparent, so as to be used directly on top of a drawing or print. The figures are in red, in order to create visibility when used over a blueprint. Another good feature, he notes, is that as long as the north arrow on the solarmeter and the north arrow on a plan under consideration are parallel, the gadget may be moved about the drawing at will. From only one simple setting the meter gives both direction and inclination of the sun at different times of the day of the yearand it can be used just as easily in the field as in the office.
At the present time a new model is being prepared, which, in the opinion of the designer, makes the device even more useful. Instead of the top disc being circular, as shown in Figure 44, it will be rectangular. Two sides of this rectangle, when the disc is revolved, will always be parallel to the north point printed thereon, and these edges can be used directly to fine up the device with lines on a drawing, thus eliminating any necessity for fumbling around with tee-squares, triangles, and other instruments. There is also printed on the new model a table of tangents with a method for reading depths of sunlight penetration in a room.
Incidentally, among those distinguished gentlemen who have commented favorably on the graphic solarmeter, as fisted on a circular advertising the device, are Isadore Rosenfield (whose hospitals we shall mention shortly), Jean Labatut (formerly of Princeton), William Wilson Wurster (Dean, University of California’s School of Architecture), John Bland (Director of School of Architecture, McGill University), and A. A. Coddington (Consulting Mechanical Engineer of San Francisco, California).
Another very fine device is the sun angle calculator, developed by Libbey-Owens-Ford Glass Company, Toledo, Ohio, and prepared by Aeronautical Services, Incorporated, Washington, D.C. It is designed to give the true altitude, profile angle, bearing and angle of incidence of the sun’s position, for any hour of any day for any latitude from 24° to 52° North, for windows and walls facing any direction. There are detailed instructions in an attractive booklet on how to determine the dimensions and locations of sun control devices, how far the sun’s rays will penetrate openings in buildings, and many other items. There are also some very handy charts for determining direct solar and sky (diffuse) energy incident upon a vertical surface, in B.T.U.’s per square foot, per hour;
THIS INSTRUMENT IS No OF A SERIES OF NINE SOLARMETERS. EACH DESIGNED FOR A BAND OF LATITUDE 2lj° WIDE. No. 6 IS CALIBRATED FOR LOCALITIES LYING BETWEEN 38’Z & 4IJ-/ NORTH LATITUDE, AT ANY LONGITUDE.
HOURS OF TIME REFERRED TO ARE LOCAL APPARENT SOLAR TIME, COMMONLY CALLED “SUN TIME”. THIS INSTRUMENT IS ACCURATE TO WITHIN APPROX- IMATELY 3° WITHIN THE AREA SPECIFIED.
60
69
74
51
66
33
59
42
25
48
33
17
5
24
40
28
21
25
o
S
£
26
T
80
85
90
95
WO \05‘
80° -85* ■90 :95 W ^05 //O ?//5° .
°O
GRAPHIC SOLARMETER
PATENT AFWEO fOU
DIRECTIONS. THE CENTER OF THE DISC REPRESENTS THE POSITION OF THE OBSERVER. HEAVY CURVED LINES ON BOTTOM SHEET ARE HOUR LINES EACH SMALL CIRCLE ON TOP DISC REPRESENTS ONE DATE, OR EITHER OF TWO DATES IF SO NOTED POINT NORTH ARROW ON BOTTOM SHEET TO TRUE NORTH TURN TOP DISC UNTIL CIRCLE REPRESENTING SELECTED DATE COINCIDES WITH ONE OF THE SMALL CIRCLES LYING ALONG THE LINE REPRESENTING THE SELECTED HOUR ARROWS ONJOP DISC-WILL THEN BE POINTING IN THE DIRECTION OF THE SUN S RAYS ON THE DATE & AT THE HOUR SELECTED, AND THE FIGURE WITHIN THE SMALL COINCIDING CIRCLES WILL SHOW (IN DEGREES) THE ANGLE WHICH THE SUN S RAYS MAKE WITH THE OB- : SERVERS HORIZONTAL PLANE AT THAT SAME MOMENT.
Figure 44. Graphic solarmeler by R. W. Justice.
[hucheo ano]{.smallcaps} oisiiiiuuo n t. w. [iiatke.]
and a map indicating magnetic compass variations in various parts of the United States. An illustration of the main device, for latitude 40° North, is shown in Figure 45.
The “direct-observation” method of determining the sun’s position may be used on buildings already constructed or on models at the site. Observations may be made roughly by the eye, or more accurately by “shooting the sun” with a sextant. In either case, the results obtained apply only to conditions on a given day at a given hour at a given place. Thus it is usually more convenient for the architect to refer to any of of the four previous design aids.
For a discussion of how data obtained by the foregoing methods can be applied to the determination of various aspects of design, see
overhanging eaves, page 79 ff., general orientation of buildings, page 62 ff., and siting of buildings with relation to one another, page 106 ff.
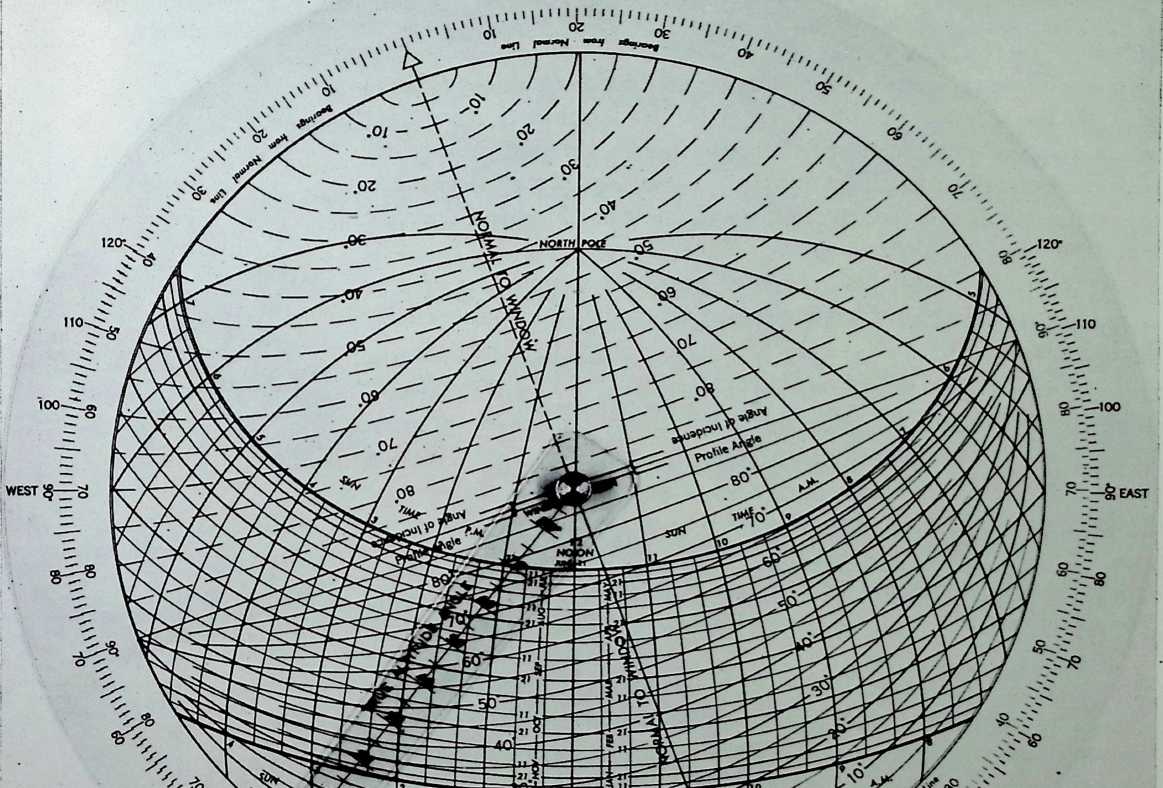
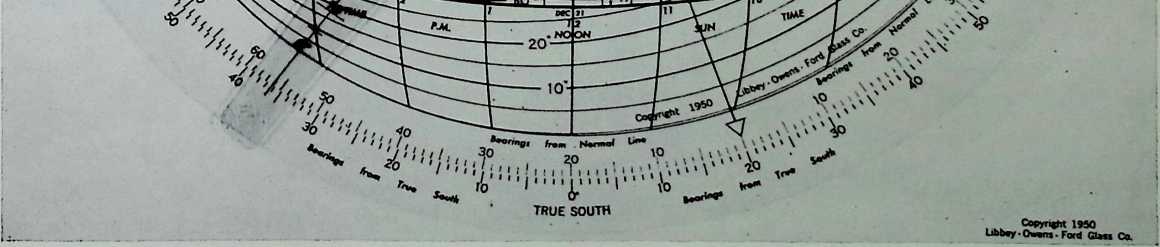 The third factor upon which the amount of radiation depends is the influence of clouds and other obstructions. If there were no clouds or other obstructions in the way, the sun would shine for the total number of hours between the calculated sunrise and sunset times each day. But there are clouds and obstructions, so there is rarely a recording of 100 per cent of the possible sunshine at any station. This is especially so at a station like McGill Observatory, Montreal, even on cloudless days. Squatted at the base of Mount Royal, it is under the influence of the hill’s great shadow. Because of the open surroundings, observations at Montreal Airport in Dorval would provide a better indication of the sunniness of this area. However, no sun recorders are kept at the airfield
Figure 45. Sun angle calculator for 40° N as derodoped by Libbey-Owens-Ford Glass Company, Toledo, Ohio.
40° SUN CHART I [ma* m]{.smallcaps} i
TABLE 4. SUNSHINE HOURS AT McGILL OBSERVATORY (lot. 45° 30)
Month Total Possible at this Latitude No. of Recorded 69-Year Means Percentage of Possible 69-Year Means
January
February
March
April
May
June
July *
August
September
October
November
December
* It is more in July than in June because July has 31 days, whereas June has only 30 days.
TABLE 5. SUNNY DAYS AT McGILL OBSERVATORY (1946-1950)
. Month Total Recorded Average
January 41
February 42
March 54
April 34
May 35
June 44
July 55 .0
August 52
September 49
October 49
November 20
December 30
Year .0
and we must resort to data from McGill, which, although non-repre- sentative of the general situation, are here included as an example. From the table the architect can determine the probable amounts of sun that will be received on a horizontal surface in Montreal during each month. He can also realize that if he wants to capture the sun particularly in the winter months in the buildings in such areas as Montreal, he must make the most of every minute of sunlight.
The information just presented may be interpreted in another way: the days may be divided into mostly sunny days and mostly cloudy days. See Table 11.
For the same period as for sunny days, that is, 1946-1950, the average number of cloudy days in Montreal were:
TABLE 6. CLOUDY DAYS AT McGILL OBSERVATORY (1946-1950)
Month Total Recorded Average number
January
February
March
April
May
June
July
August
September
October
November
December
Year
In preparing an analysis of this sort it is difficult to distinguish between clear and cloudy days. Yet this information serves to illustrate to some extent that Montreal has, on the average, per year, more cloudy days
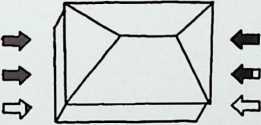
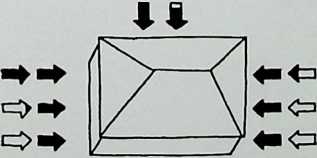 than clear ones. Charts similar to the above three can easily be prepared if not already obtainable by abstracting data from the records of any meteorological station.
NORTH
rttti
Figure 46 {above}. Sun heal gain on vertical walls in summer. Figure 47 {below). Sun heal gain on vertical walls in winter. Diagrams based on data from Solar Radiation by Henry Wright.
NORTH
ttr
The “exposure” of a certain slope is governed by the direction of the slope and the angle of the slope. These two factors also affect the amount of radiation received from the sun. There has been little work done in this field; Rudolf Geiger in The Climate Near the Ground lists only seven authors. But in addition to these, the United States Weather Bureau and the Blue Hill Observatory have made some investigations.
The amount of heat which a slope receives is made up of direct insolation and diffuse sky radiation. Direct insolation varies with the direction and angle of the slope. Diffuse sky radiation varies with the angle of the slope only. Thus, according to Geiger, a 20° north slope receives just as much diffuse radiation as a 20° south slope, and the amounts of heat received by each do not differ greatly from that falling on a horizontal surface. “Sky radiation”, he writes, “moderates differences of exposure. The greater the ratio of diffuse sky radiation to total radiation, the more are the differences between the slopes effaced.” It follows that large differences in exposure will be encountered in clear weather; small differences in exposure will be encountered in overcast weather. These differences parallel conditions on many winter days in cities like New York and Montreal. This theory has been confirmed by Geiger in observations on the Hohenkarpfen, a symmetrically round mountain cone of the Swabian Alps.
The cloudiness analysis for Montreal in this chapter shows those times when the advantages of certain slopes are minimized with relation to other slopes. Actually, in our latitudes this is quite an important consideration, although farther north and south it is not. For example, in the tropics the differences due to direction of slope are very small: at mid-day direct insolation is strong; there are few or no shady areas since the sun is right overhead. At the poles the differences due to direction of slope are also small: the diffuse sky radiation predominates, and each quarter receives just about the same exposure.
But we in the temperate zones he in between; there are variations which should be taken into account in architectural designs when orientation to the sun is considered.
A further discussion of radiation received on differently oriented surfaces is given in the chapter devoted to temperature. See pages 115 ff.
Geiger also states: “From the amounts of radiation for vertical walls we find that in midsummer the east side of a house is most favored. Compared with a horizontal surface, an east or west wall receives less heat throughout the whole year, while a south wall, from September through March, receives more. The highest totals of radiation falling on vertical walls occur in early spring and late autumn on a south wall. This explains early flowering on south walls.” Baker and Funaro have illustrated this graphically, as seen in Figures 46 and 47. Each arrow represents a possible heat gain of 250 B.T.U. per day, at the latitude of New York, on the surfaces indicated. That part which is shaded represents actual conditions in New York itself, which, as has been explained already in the case of Montreal, is less than the total maximum possible because of the interference of clouds and other obstructions.
Geiger notes, further on, that although a 30° east slope receives more radiation than a west slope, the morning atmosphere being clearer, ground temperatures are lower in the east because of the shielding effect of moisture. These remarks channel us into a study of the radiation received on different angles of slope.
It has been found that on clear days the intensity of the sun on a horizontal surface is greatest at noon because the rays at that time have the shortest path to travel through the earth’s atmosphere. However, the maximum possible intensity at noon or at any other time at a given site is on that surface which is perpendicular to the sun’s rays. Thus at the latitude of Montreal, the June 22 noon-maximum occurs on a surface inclined at an angle of 22° 3 to the horizontal, and the December 22 noon-maximum occurs on a surface inclined at an angle of 68° 51 to the horizontal. For New York, the figures are 25° 48 for June 22 and 64° 12 for December 22. Formulas 6, 7, and 8 on page 52 will quickly give such sun angles for any other location. The Swedes have made a lot of experiments and investigations on this subject. A summary of the work conducted by G. V. Pleijel at the Royal Institute of Technology, Stockholm, which appears below, illustrates the amazing differences of solar radiation received on surfaces at Karachi, Pakistan, (lat. 24° N.) and Goteborg, Sweden, (lat. 58° N.) In the summer months a south-facing vertical wall on a clear day in Karachi receives 0.01 Mcal/m2 per day, whereas on the same wall in Goteborg 2.86 Mcal/m2 per day is received. And yet the mean maximum temperatures at Gote- borg are about 11° C (52° F.) less than those at Karachi in the month of July. These facts are illustrated in Figure 49. The situation on the same wall at Karachi, Stockholm, and Goteborg when cloudiness is considered is shown in Figure 50.
An architect, knowing these principles, can, among other things, select a site suiting his requirements (e.g., other factors being equal, a steep south slope would receive the most winter radiation) and select suitable slopes for roofs, walls, and other surfaces, according to whether he desires more or less heat from solar sources at given times of the year. (For solar-house design fundamentals, see page 66 ff.)
The sixth factor upon which the amount of radiation depends is the height of the station. The higher one ascends a mountain the more solar radiation is normally received. This is probably one reason why it has long been the practice to construct sanatoria at greater altitudes.
At great heights there are sizeable differences in the amounts of radiation hitting the several exposures. For example, Geiger has illustrated that in the Alps the north and south slopes are two fundamentally different habitats for all life dependent on the sun. “At a certain time in the spring when everything is dormant on the snowcovered north slopes, the first flowers are in bloom on the south slopes between banks of melting snow or even under them.”
Figure 48. Insolation received on vertical surface during sunny day with clear sky in Goleborg (58° [jV)]{.smallcaps} and Karachi (24° N) during summer solstice (5), equinoxes (D), and winter solstice (Tz). Graphs by Gunnar Pleijd.
Figure 49 (above). Mean maximum temperatures at Goleborg and at Karachi. Figure 50 (right"). Insolation received on vertical surface with unobstructed horizon at Karachi (K), Goleborg (G), and Stockholm (S), corrected for cloudiness and without diffused radiation. Graph by Gunnar Pleijel.
DAILY SUM
SUM
DAILY M CAL/M2/DAY
S = O,OI
D=2,44
V=4,50
S=O,57
D=O
v=o
s SC iUTH [‘facai]{.smallcaps} [5e]{.smallcaps} °
***\\/t***
N NC )RTH ‘ FACA DE
CM
O
CJ
0 3 6 9 12 15 18 21 24
TIME
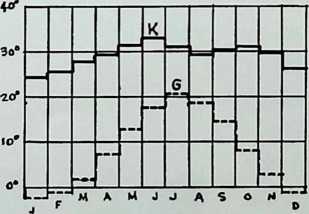
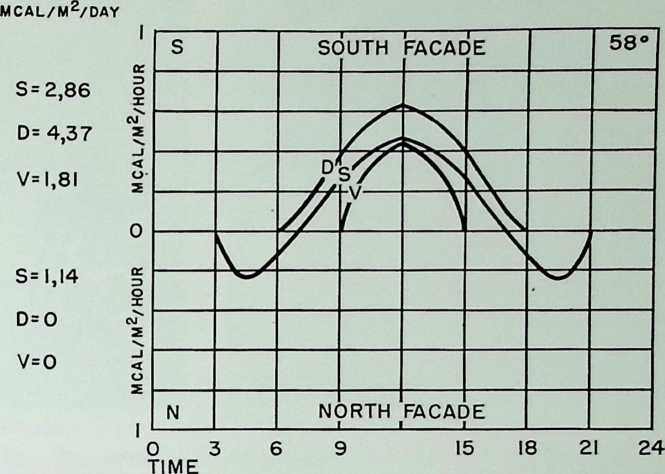
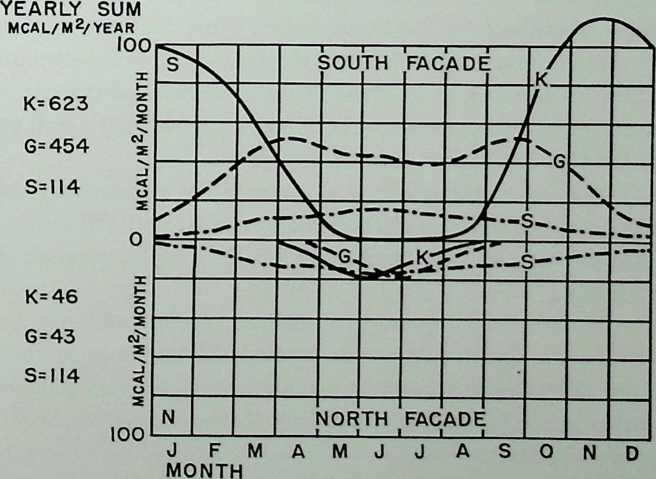
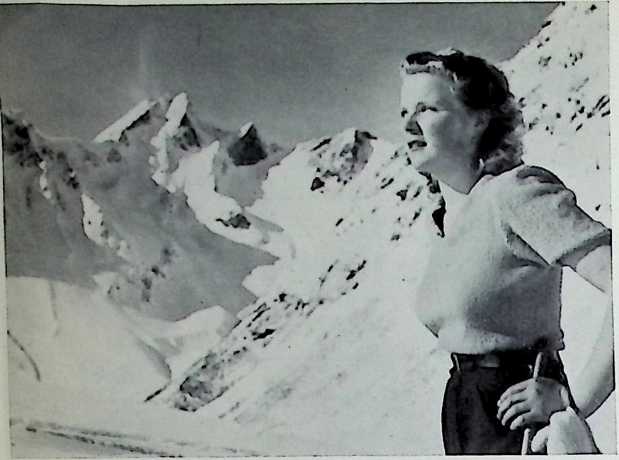
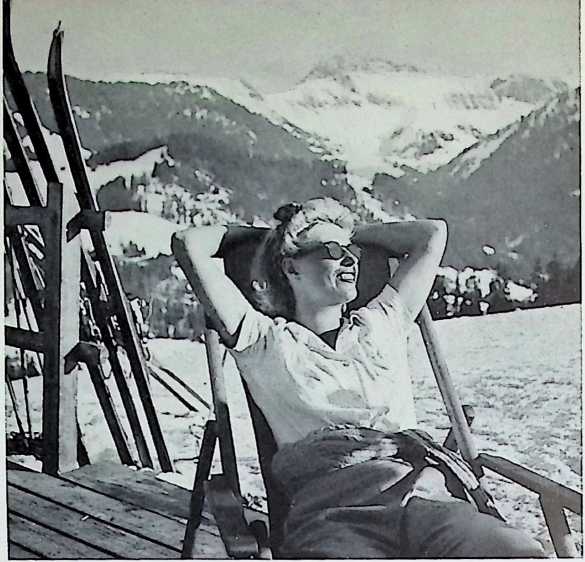
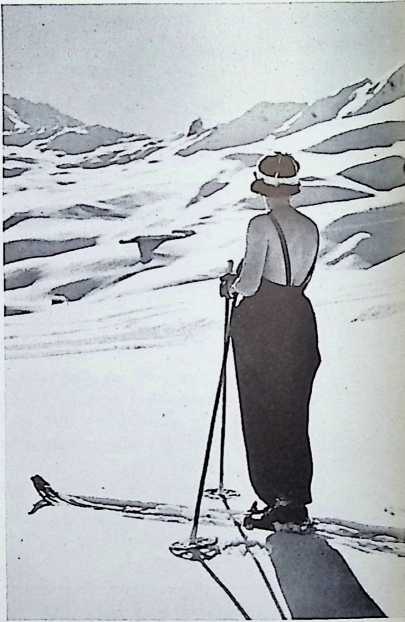
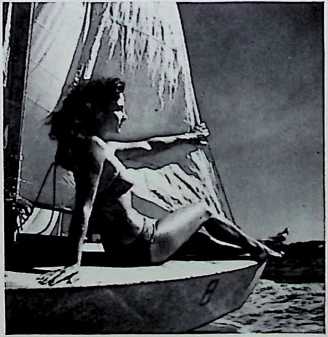
Figure 51 (above left). Norway. Figure 52 (above right) and Figure 53 (right). Switzerland. Figure 54 (right below). France.
High up in such snow-covered mountains, however, skiers can keep extremely warm on any sunny winter day. Figure 51 illustrates a a perfectly-comfortable lightly-clad maiden in the mountains of Norway. Figure 52 shows a similarly-attractive young lady relaxing in French- speaking Switzerland, while Figure 53 depicts a fair skier in bathing costume absorbing the sunlit splendor of the Swiss Alps above Arosa.
The amount of insolation received on a surface may also be a function of the reflective qzialities of the surroundings. If snow or water is present, for example, the amount of sunshine reaching a wall is increased considerably. See Figure 54.
Because of the presence of snow in the northern latitudes of our hemisphere during most of the winter months and the low angle of the sun’s rays, benefits may be derived if a building in question is designed accordingly.
If additional insulation is desired, provision should be made to try to keep as much as possible around the buildings or the exposures affected. This can be achieved by avoiding the clearance of snow on paths (or other surfaces) and by providing shelves below windows, on which snow could collect.
This topic will be resumed in a discussion of the reflective qualities of various surfaces on page 100 ff.
After we have the information about the relative position and intensity of the sun under different conditions, it is necessary to apply it to the problem of designing and siting buildings for sunlight.
We may ask: why is sunlight in buildings desirable? A sampling of answers might include-
There is an evident desire of people to have sunlight (according to the British Post War Building Studies No. 12 among other sources.)
Sunlight is a powerful bactericidal agent. Some hospital authorities have noted that the germs of tuberculosis, diphtheria, typhoid, and cholera are killed in from two to ten minutes exposure to direct sunlight. But, according to J. M. Desranleau, Assistant Bacteriologist with the Department of Health, Province of Quebec, the blue spectrum of sunlight even has bacteria-killing capabilities after it has passed through glass. The time it takes to destroy the bacteria varies -with the disease in question. Tuberculosis is destroyed only after two to three days’ exposure by this method, although other baccilli are killed in less time. The ability of sunlight to kill bacteria has been attested to by Isadore Rosenfield, noted architectural consultant for hospital design. He indicated in his book, Hospitals Integrated Design, that medical investigations have shown that “light from gray skies, even though filtered through two thicknesses of ordinary glass, is still germicidal.” In other words, although such light is not quite as potent as direct, uninterrupted sunlight, it is nevertheless still very effective in killing bacteria.
Sunlight exerts a specific curative effect too on tuberculosis, and is a powerful stimulant to a person’s ability to resist it.
The degree of sunlight suggests, or assists in suggesting, the type of weather that prevails outdoors. An example is close at hand, for the author has worked in an office which, although air-conditioned and possessing the most up-to-date facilities, equipment and furniture, has no windows. Consequently, he has been asked frequently why the architect did not install periscopes through the wall, or at least provide a direct teletype machine to the local meteorological office so that the inhabitants would be appraised of the prevailing weather conditions! The office boy would thus be relieved of his task of reporting the situation every hour on the hour and could undertake more worth-while projects!
Sunlight is essential for the growth of children as well as all sorts of plant and animal life. It is source of vitamin D.
Sunlight facilitates ventilation by warming the air and causing gentle convection currents.
Sunlight can be used as a source of heat.
Sunlight has a psychological effect on well-being.
Sunlight helps to keep the areas around buildings clean.
In certain architectural works the admittance of sunlight may be de[sir]{.underline}- able. In others it may be a nuisance. This is a problem for the architect to solve; the tools are here given, but he must finish the job according to the specific circumstances.
¶ design and the sun
The architect, having appraised the qualities of a site with regard to the sun according to the information previously given, may approach the problem of the individual unit of design: room, terrace, driveway, etc.
After that he may assemble the individual units to form a mass usually termed “the building.” Then he may consider the relation of buildings to one another, to the open spaces, and in new developments to the street patterns, in that order.
¶ the individual unit
Tables 7 through 12 give suggested lists of appropriate sun orientations for various rooms in different building types above latitude 35°N. However, variations may be made to suit individual tastes or requirements. (Each dot in the tables below suggests that the orientation indicated at the top of the column is suitable for the given type of accommodation, other factors such as wind and view not being considered here.
As for residences, “Aspects in the quarter between NW and NE,” advises H. Myles Wright, “should be avoided for habitable rooms in dwellings.” And the U. S. Housing Authority in Planning the Site says, “Orientation to sun is most successful when it makes sunshine available in the kitchen in the morning, especially in winter, and provides for some sunshine in the living room in the afternoon.”
While north light has generally been recommended for classrooms, there have been objections raised in some quarters. Alonzo J. Harriman, a prominent Auburn, Maine, architect, feels that sun should enter a classroom sometime during the school day, at least in Maine, where schools and other buildings should not be designed the same way as in California or Texas. In fact, Harriman also found in preparing a survey that every teacher wanted sun, preferably from the south, and if not that, at least from the east or west, in that order. Harriman prevents any possible overheating of the west wall by screening with trees, which subject shall be discussed in a later paragraph.
Figure 55 shows a view from the west of his design for the new Washbum School in Auburn. Lighting in a typical north-wing classroom is obtained partly from the north and partly from a high clerestory facing the south, as seen in Figure 56. The main wall of the south wing is indicated in Figure 57; notice that there are no overhangs, the only sun control being the Venetian blinds, which can be adjusted according to the outdoor light conditions. Harriman’s reason is as follows- “Some shading…is necessary when direct sunlight enters the room in such a way as to cause glare on the floor and desks or in the eyes of children at
**N** **NE** **E** **SE** **S** **SW** w **NW**
bedrooms 0 0 0 0 0
living 0 0 0 0
dining 0 0 0 0 0
kitchen 0 £ 0 0
library o 0 0
laundry o 0 0
play 0 0 0 0
drying yd 0 • 0 0
bathrooms o o 0 0 0 0 0 0
utility o 0 0
garage o 0 0 0 0 0 0 0
workshop o 0 0
terraces 0 0 0 0 0
sun porch 0 0 0 0
Table 7. RESIDENCES (private dwellings and apartments)
Figure 55 (above). Washburn School, Auburn, Maine. View from the west. Alonzo J. Harriman, architect. Figure 56 (left). Typical north wing classroom, showing clerestory facing south. Figure 57 (below). Main wall of south wing.
Table 8. SCHOOLS
N NE E SE S SW W NW
classrooms kindergarten workshops domestic science libraries locker rooms toilets cafeteria administration teachers lounge labs auditorium
gym utility
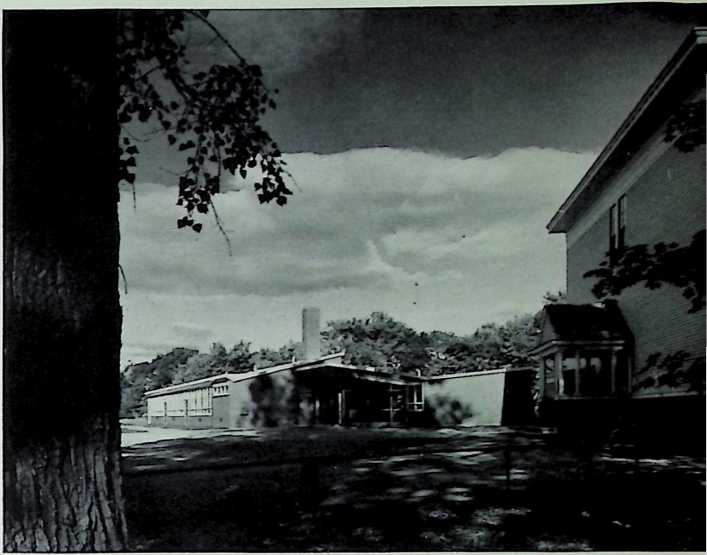
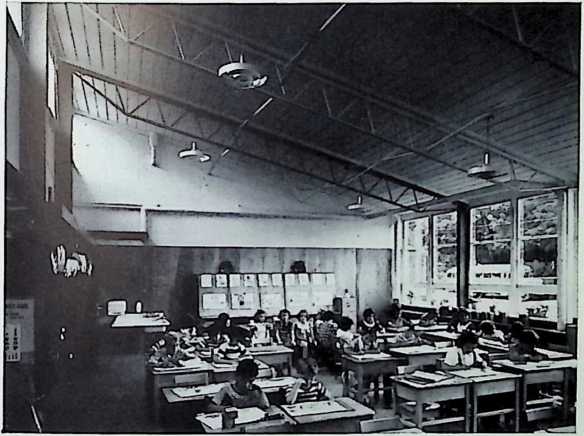
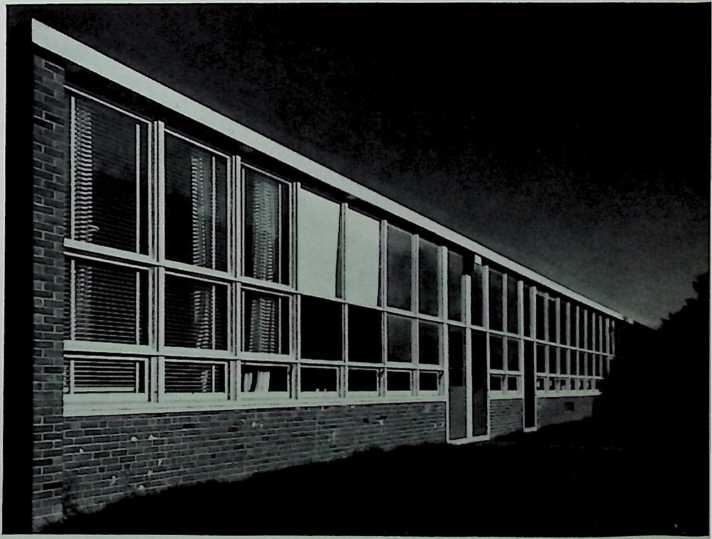
all other times shades should be kept completely rolled up. Probably no one feature of most of the older schools is more abusing to the child, and of such poor economy, as the prevalent practice of keeping the shades halfway down the window and then using artificial light to light the room, often inadequately.”
In hospital design the important thing to remember is that fight should be admitted into every room, no matter how insignificant it may seem. According to Isadore Rosenfield, light is extremely necessary in hospitals for three main reasons: proper vision, psychological effect, and protection from cross-infection. The above arrangement can perhaps be considered a preferential orientation where space is limited. Skylighting possibilities should not be overlooked.
The sun-orientation of various main units in industrial buildings is dependent on the manufacturing processes involved. The sun may be desirable or undesirable in different circumstances, and the architect should ascertain whether or not to provide the sun in buildings of this sort before the planning is commenced. Subsidiary accommodations in industrial buildings should be oriented in the same manner as those indicated under “office buildings.”
In general, where bright light is preferred, an aspect to the south is desirable. The south-east quarter will receive the morning sun and the south-west the afternoon and evening sun. Dining rooms in this quarter will receive the sun’s rays at a low angle of incidence, which might render the occupants quite uncomfortable. Personal taste must therefore influence the decision in this regard.
North light is the most even throughout the day. In this aspect one avoids for the most part of the year any direct rays from the sun. Thus no sun movement is evident, as in other quarters; and one avoids the variation of light intensity due to clouds passing between the sun and the observer. These facts make north orientation most suitable for clothing establishments, drafting offices, libraries, etc., where a relatively steady illumination is desirable for optimum working conditions.
A notable departure from usual orientation techniques is seen in the State-aided Veterans’ Housing project for Wellesley, Massachusetts, designed by Hugh Stubbins, Jr. He purposely oriented the dwelling units towards the north and south. This was done primarily to avoid eastern and western exposures and also because he felt that a northern outlook is more pleasant than one looking toward the south, for a view to the north presents objects with full sunlight falling on them, whereas to the south objects are in silhouette and one sees the shadow side. Stubbins feels that both exposures have advantages, but if sunlight can be brought into a north-facing room, the solution is ideal.
In the case of the north-facing dwelling units, a south-facing clerestory is used in the living room to admit sunlight during the winter months. The overhangs, with the set-back of the walls underneath them, are so arranged that no sunlight enters any of the rooms during the hottest months of the year. All rooms are protected from view on the entrance


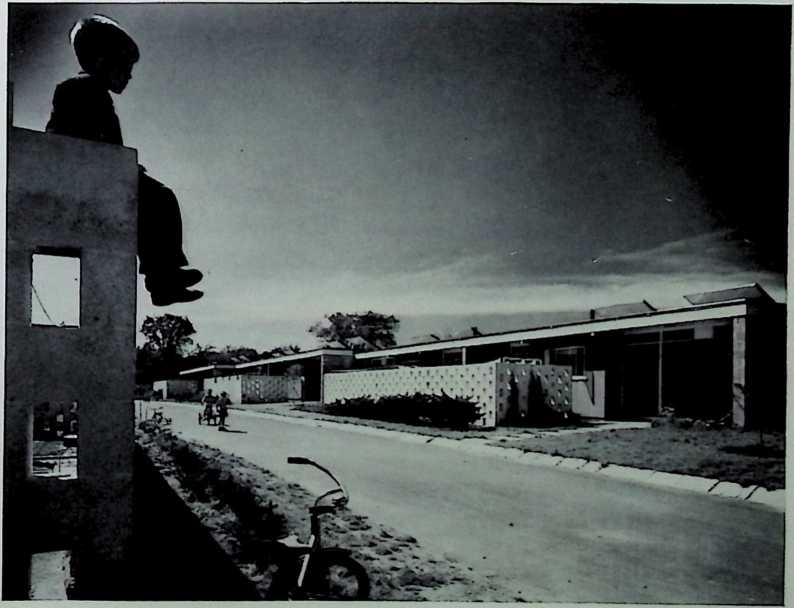
Table 9. OFFICES, STORES
drafting rooms libraries servicing, supply utilities toilets
N NE E SE S SW W NW
general offices, ad minis- tration
reception areas restaurant, bar store
toilets entrances stage
church altars main room lobby
restaurant administration lounge workshop offices
N NE E SE
S SW W NW
Table 12. ATHLETIC BUILDINGS, COMMUNITY
CENTERS
**N** **NE** **E** **SE** **S** **SW** w **NW**
patient’s rooms • • •
terraces • • •
administration • • •
kitchens • • •
utilities • • •
operating rooms
labs • • •
x-ray • • •
toilets • • • • • • • •
physiotherapy • • •
ambulance entrance • • • • • • • •
nurses’ residence • • •
pharmacy • • •
nursery • • •
dentist offices • • • • •
doctors offices • • •
Table 11. HOSPITALS
N NE E SE S SW W NW
toilets, showers locker rooms swimming pool gym
game rooms administration kitchen cafeteria meeting rooms
Figure 58. Southern wall of veterans’ housing project. Wellesley, Massachusetts. Hugh Stubbins, Jr., architect.
Table 10. AUDITORIUMS, CHURCHES
side either by use of obscure glass or by the perforated cinder-concrete block wall which also forms a service court for drying clothes.
The picture in Figure 58 shows the walls of these houses and the clerestories from the South.
In general, east and west orientations have properties which may be likened to those of north and south according to what hour of the day they are used at least insofar as sunlight is concerned. Thus, for example, accommodations suitable on the north may also extend to the east if employed only in the afternoon or night.
One of the most outstanding applications of this knowledge in the building field is the solar house. Arizona engineers did experiments on solar collectors as early as 1911, but it was first popularized in the U. S. A. about 1930.
Although man had been aware of the “solar house” concept for many years, there are several factors preventing its realization until recently. Among these was the tax on windows in the Colonial days of America, and in England until the middle of the nineteenth century; and until 1916, when the flat-drawn process of glass making was developed, glass was hand blown in cylinder shape, and large panes were impossible, according to W. Everett Eakinalthough Fitch says in American Building that production of glass was industrialized in the Victorian era and made huge plate-glass windows possible then.
The purpose of the solar house is to attain more efficient use of the sun for light and heat. As far as the lighting is concerned, no elaboration is required. The heat can be utilized in two different ways: by trapping the sun inside the house, using large-paned windows of two or more glass layers, the popular version of the solar house; and by using the sun’s heat to warm a liquid or solid solution, which is then employed as a fuel to heat the house, a type still in the experimental stage.
In January, 1942, Chicago temperatures dropped to 17 below zero and never rose higher than 5 below. Yet in an experimental building at the Illinois Institute of Technology, according to Your Solar House, edited by Maron J. Simon, “automatic controls set at 72 degrees shut off the furnace at 8:30 a.m. and did not turn it on again until 8:30 p.m.! For the major part of the day the sun, streaming in through the windows which made up virtually the entire south wall, had taken over the job of heating the house.” Fairly accurate experiments have been organized by Dr. Maria Telkes of the Department of Metallurgy, Massachusetts Institute of Technology. She notes that large glass areas can dissipate a large amount of heat at nights and on cloudy days, offsetting any gains at other times. And M. I. T.’s director of the Department of Architecture and chairman of the Space Heating Committee of their Solar Energy Research Project, Professor Lawrence B. Anderson, has said, as quoted by W. Everett Eakin, “In climates and latitudes similar to Boston’s, a south window of single glass has a net thermal loss unless heavily curtained at night during the coldest months. Double glass shows a net savings which can be increased by curtaining.” Also, one may recall that
different wall materials have different heat-retentive qualities and may influence the amount of heat that the building, as a mass, retains or dissipates. A thick-walled stone building can retain heat to a remarkable extent in winter, yet in the summer it is often comfortably cool.
C. C. Handisyde in New Ways of Building has said on this subject: “Experiments have shown that for similar rooms facing north and south the heat requirements over a full season may be 15 to 20 per cent, the difference due to solar heat effect. This gives a clear lead towards planning to take advantage of sun heat so far as the winter is concerned, although it may at the same time result in a need for more careful treatment to reduce overheating in summer. This heat gain from the sun leads to the suggestion of sun-trap’ buildings with large windows.
“The Solar House is already a feature with some architects in America, but there is less certainty of the value of very large windows in our climate, [i.e., England’s,] where the heat loss through large areas of glass at night and on dull days may not balance the heat gained from the comparatively small amount of sun received. . . .
“Such factors as the probability of insulation of the windows at night by thick curtains will affect the balance quite appreciably.”
Isadore Rosenfield recognizes the problem in the following terms: “The small window has the virtue of resulting in low heat loss. If weatherstripped and protected by storm sash or integral double glazing, it is perfectly satisfactory so far as heat loss is concerned. On the other hand, it does not bring much light or heat into the room that would be desirable in winter.
“For the solar’ house it is claimed that plenty of glass facing south actually brings heat into the house and thus cuts down the fuel bill, but consideration must be given to heat losses at nighttime and on days when there is no sun… . . The less daylight and sunlight in a given location, the more reason, from a germicidal point of view, to exploit it to the full with more glass.”
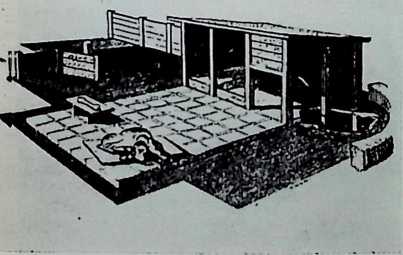 Solar houses, however, cannot be mass-produced; there are different requirements in each locality. For example, there were notable experiments planned by Dr. F. W. Hutchison at Purdue University, Lafayette, Indiana. Two identically-shaped test houses were constructed. However, one had the conventional window area, and the other, the “solar house,” had a large expanse of glass on the south side. What happened? The “solar house” required 16% more fuel heat than did the conventional house during a December and January test period.
Figure 59. Bay area style dog house as it appeared in the San Francisco Chronicle.
It is not the purpose here to discuss heating requirements in detail. Yet these notes serve to illustrate that there is no a-b-c formula for designing solar houses.
But so much has the solar home idea swept the country that in the San Francisco Chronicle were published designs for a “Bay-area style dog house.”
The Chronicles caption, as quoted in the Architectual Forum edition, The Magazine of Building May, 1951 was in part: “. . . planned
by a Bay area architect who believes the dog-house is a machine for living, the orientation provides a maximum of year-round outdoor living. With the additional feature of solar heating, no dog need spend winter days huddled under the kitchen stove, even if he could find a modern stove to get under… . Too often, the so-called dog lover shelters his pet as though he really hates him. Proportions are out of scale to the dog. The house is furnished with a chewed up gunny sack. There is no site planning. Result: a slum area for dogs.” This doghouse substituted floor to ceiling glass for “dark tunnel entrance,” notes the Architectural Forum. It offered privacy “through planting a hedge and a few shrubs.” The terrace of varnished, end-grain wood blocks was declared “ideal for lounging on those long, lazy, summer dog-days.” A pool, penetrating space through one wall, “is suitable for drinking from or gazing upon.” A low screen hid “dog’s other outdoor living appointments: digging yard and hardwood post.”
Yet, the San Francisco Chronicle and others might be surprized to learn their cartoon is not so funny as it first appears when one considers that for years agriculturists have recognized the sun’s advantages and have provided solar milk houses, solar hog houses, solar calf barns, solar dairy bams, and solar poultry houses. For example, let us examine the following photographs of farm buildings, furnished through the courtesy of Libbey-Owens-Ford Glass Company. The windows in each illustration are glazed with special farm insulating glass, with satisfactory results reported in each case.
Figure 63. Solar hog house at Rosemount Experiment Station, University of Minnesota.
Figure 60 shows a summer view of a dairy barn at Breeding Center, Pennsylvania State College, with the windows in complete shade. Figure 61 depicts a winter view of the same barn, after stucco has been applied, showing a shadow line above the windows on December 21; and in Figure 62 is seen a spring or autumn view showing shadow lines for March 21 or September 21.
In case one’s next client wants a hog house perhaps a few pointers can be obtained from Figure 63, the solar hog house at Rosemount Experiment Station of the University of Minnesota. It is significant to note that with only heat lamps in the brooders for the pigs, the interior temperature of buildings such as this never drops below freezing during the winter, despite outside temperatures which may be as much as 25 degrees below zero. Such a thing occurred at Michigan State College’s solar hog house, an interior view of which is seen in Figure 64.
Figure 65 shows an interior of the solar poultry house at Pennsylvania State College, the first farm building design that has permitted this much sunlight to enter; it was found to be quite successful.
Figure 64. Solar hog house interior at Michigan State College.
In Figure 66 may be seen the interior of a dairy barn in Eastern Pennsylvania with a combination of fixed and ventilating windows of farm Thermopane facing south.
How do the animals like the sun? Figure 67, of two lambs basking in their sunlight barn in North Central Pennsylvania, provides the
Figure 61. Winter.
Figure 60. Dairy barn, Breeding Center, Pennsylvania Stale College. Summer.
Figure 62 (above). Spring or Autumn.
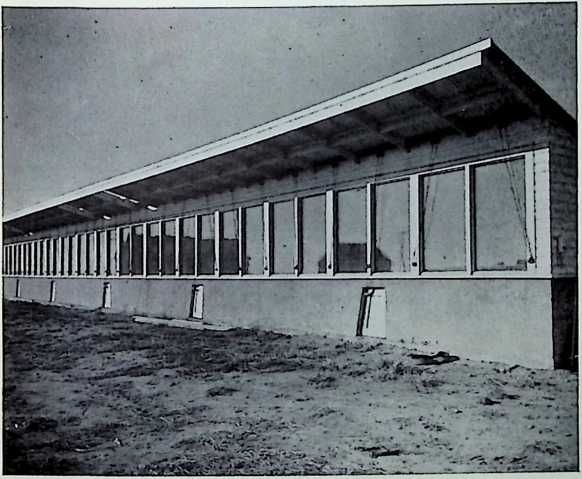
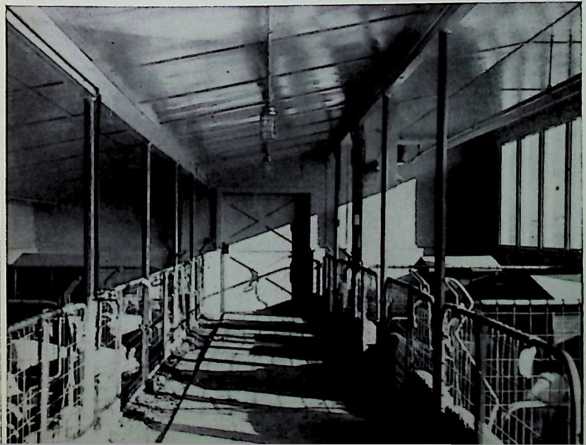

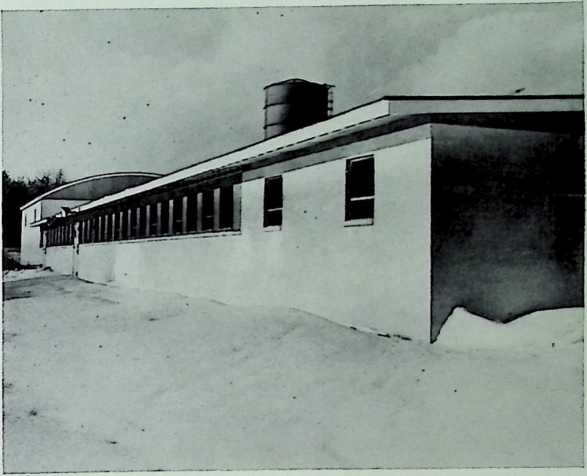
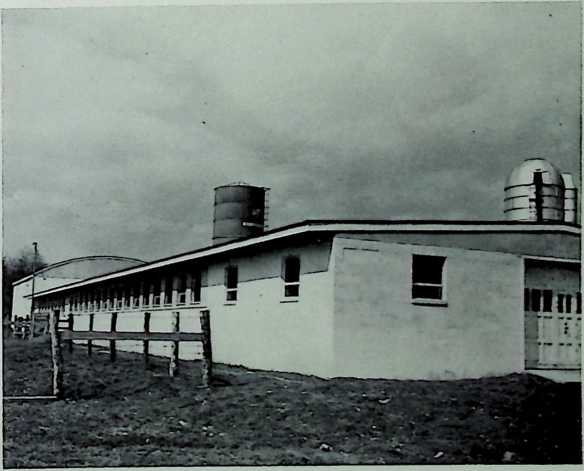

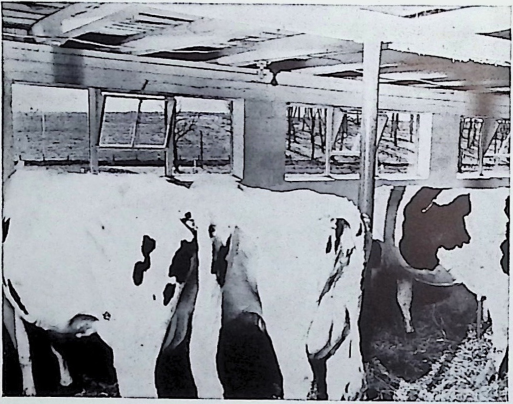
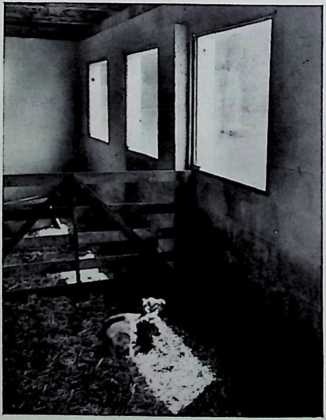

Figure 65. Solar poultry house at Pennsylvania Stale College. October.
Figure 66 (below). Dairy barn in eastern Pennsylvania. Facing south.
Figure 67 (below). Lambs seeking the sun in a north central Pennsylvania barn.
Figure 68 (below). Temperature recorder operating in March.
answer. Incidentally, according to W. Everett Eakin, interior temperatures in such insulated buildings may be kept quite constant when a thermostatically controlled ventilation system is also employed. Figure 68 illustrates a recording device operating in mid-March, when outside temperatures were 15 to 20 degrees Fahrenheit. The secret of this performance is the fact that the thermostat increases air movement as solarheat input gains; this air movement and the heat absorb moisture and carry it out of the building. When the sun goes down, the thermostat shuts off the fans to assist in heat preservation within the building. Interior air temperatures are then maintained by the radiation of heat previously absorbed by the litter, bedding, or the concrete floor, as well as that emitted by the animals themselves.
The glass companies of the United States and Canada have fostered the solar house idea for some time. Of course, they have many reasons to promote this. Yet it does seem that the insulating value of such double-paned glass items as Thermopane and Twindow, rather than the conventional single paned window, is necessary to keep in the sun’s heat once it has been trapped, keep out warm air in summer, prevent frosting of windows and other moisture problems, increase window sizes without increasing the heat loss, and prevent accumulation of dirt. If frosting occurs there is moisture on the surface of the glass and dirt collects readily. This is not apt to occur if the double-paned variety is used.
Rosenfield has remarked: “Clouding and frosting of glass has long been a problem, one fairly well solved for traditional windows by storm sash. Contemporary design calls not merely for more windows but for larger areas of glass uninterrupted by muntins, mullions, or transom bars, in order to interfere as little as possible with the view outdoors. Storm sashes of the same proportions are out of the question because of the difficulty and hazard of handling: yet without some protection much condensation may accumulate on the window sill and floor under certain conditions of relative indoor and outdoor temperature and humidity. In store show windows special drainage facilities are provided in the bottom members of the frames. A more plausible arrangement in schools would be double glazing, and the form of double glazing which offers the most positive protection would seem to be the factory-assembled unit consisting of two or more sheets of glass with mechanically sealed edges and dehydrated air spaces between them.”
Solar houses of this type should be practical in cities like Montreal or other northern cities, even though cloudiness cuts out three-quarters of the sun in winter, for then diffuse sky radiation provides a certain amount of heat. There have not been many instances of solar house design in the Montreal area, however, so that not many conclusions can be drawm. Evidently, the only trouble wnth one particular solar porch in that district wras that birds could not see the large expanse of glass, with the consequence that every evening the owmer was obliged to dispose of not a few broken-necked robins, blue jays, and other assorted winged animals.
Figure 69. Main elevation of house in Laurentian Mountains. Windows face south. Fred Lebensold, architect.
Figure 71 (left above). Main elevation of Kenneth C. Welch house in Grand Rapids, Michigan. Figure 72 (lejl). Indoor-outdoor living area.
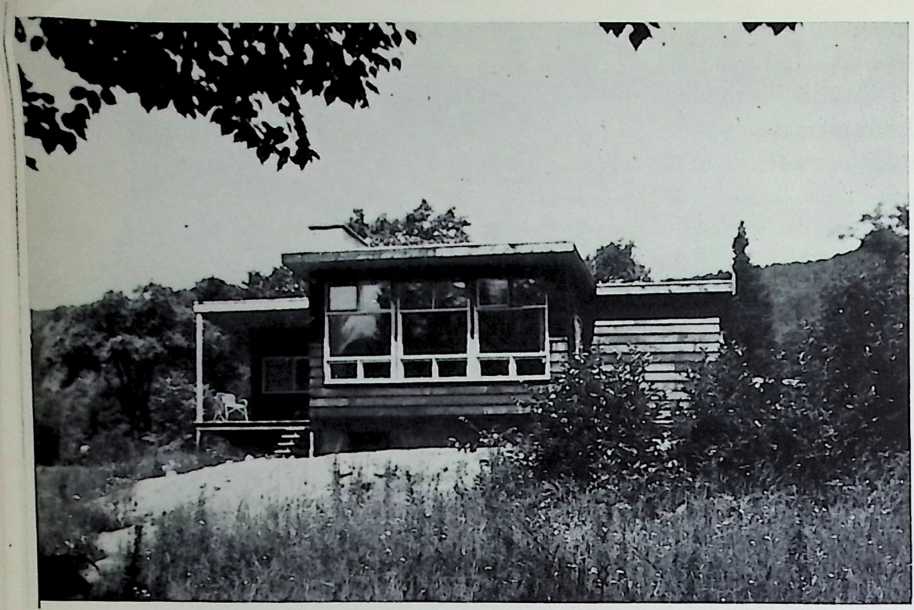
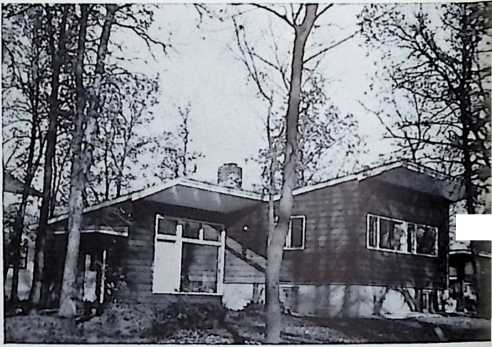
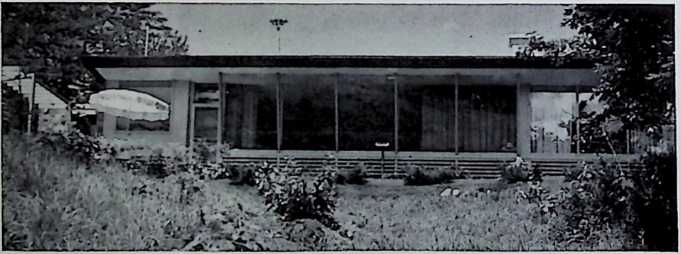
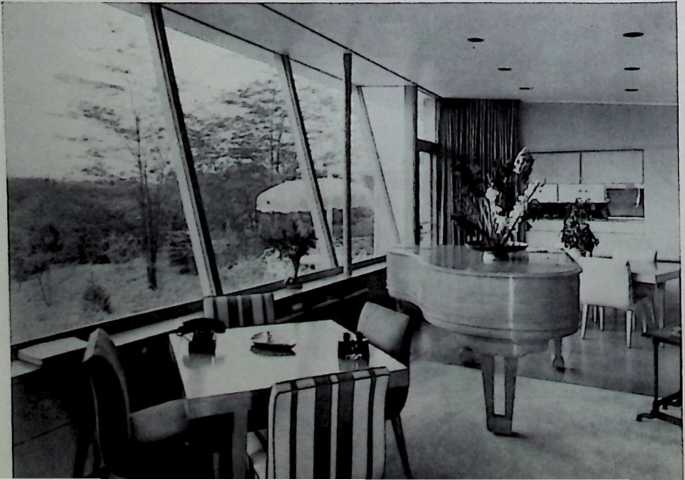
Architect Fred Lebensold has employed the solar idea in designs for relatively small buildings in the Province of Quebec. Typical of his approach to the problem is his own home, which is situated in the heart of the Laurentian Mountains, a little over an hour’s drive north from Montreal. As can be seen from Figure 69, the large south-facing windows dominate the main elevation, and according to Lebensold, “have, as expected, helped to provide a large amount of heat on a bright, sunny winter’s day.” On the other hand, he notes, in the summer he gets almost no direct sun in the living-room because of the sizeable overhang of the eaves. Here, certainly, is a home design built for a sum that was not exorbitant and yet containing many desirable features from the climatic and other points-of-view.
Another Canadian solar house is the residence of Professor and Mrs. Herschel A. Elarth, located in the severe climate of Winnipeg, Manitoba. Here again is a home design by the architect-owner, built where climatic considerations have been governing influences. The roof plane rises from a low point on the north side to a high point on the south, where the overhang is designed to permit the entry of winter sun to the windows and to obscure the summer sun. A perspective view of the entire house is shown in Figure 70. Says Elarth: “The sun angles were calculated by methods similar to that used by Dr. Paul Siple. The house is closed on the north and west, and the large openings of Thermopane are on the south by southwest. We find this design approach to have been quite satisfactory in that the summer sun’s effects are modified; and the winter sun’s benefits are most evident after January 15th, when solar radiation heats the whole house for six hours of the day.” This is in Winnipeg, where on the average there are 19 days in January with air temperatures below 0° F.!
Figure 70 (left). House in Winnipeg, Manitoba. H. A. Elarth, architect.
The noted American architect Kenneth C. Welch recently built his first house in a number of yearshis own home in Grand Rapids, Michigan. It is every bit as good as his store plans, which include such developments as Shoppers’ World, for which he was one of the team of collaborators. It is designed on the solar principle and employs many other new ideas in lighting, heating and ventilating. The main elevation, oriented 12° to the east of south, is seen in Figure 71. A view looking through the large living room windows of this exposure is seen in Figure 72. (See also other pictures and details of this building in Figures 116, 117, and 118.) Solar heat enters through these large windows during the day and is stored in the floor slab, to such an extent that the house is kept warm long after sundown without using the mechanical heating system. As shall be seen in a later view (Figure 117) the windows are tilted to prevent interior glass reflections from spoiling nighttime scenes.
Chicago architects George Fred Keck and William Keck have been designing solar houses since before 1940. They were responsible for Solar Park, Glenview, Illinois and for the solar home project in Rockford, Illinois. This latter development, built in conjunction with Green’s Ready Built Homes, consisted of pre-fabricated solar houses that sold for $6,500 each in the mid-1940’s. A photograph of the south wall of one is seen in Figure 73. All the important living and sleeping spaces are on this side, whereas the north is used primarily for servicing and circulation and as a buffer against any cold winds. Note the vertical sun louvers, which add interest to an otherwise-monotonous length, besides providing shade and privacy for the rooms behinds. (For photograph of the roof of this home, see Figure 161.)
More recently, in 1952, the Kecks designed a 24-unit solar home development in Glencoe, Illinois, on a speculative basis. Prices of the buildings (the plan and perspective of one of them are shown in Figures 74 and 75) are in the $28,000 to $29,500 range. All are provided with double-paned insulating glass. The Kecks expect that heating in these homes, as in their earlier ones, will be taken over by the sun for much of the time. Writes William Keck: “I personally remember one specific instance in December where the heating plant was off all day long when the temperature was 10° F. outside. It was also necessary to open the ventilators between 10 a.m. and 2 p.m. in order to keep the temperature within the house under 75° F. Many of our clients do not believe us when we predict what will happen, only to discover it by themselves and call us to tell that the condition exists.”
Mechanical ventilation sometimes is almost a prime necessity in solar-designed rooms. Even with all that the architect can do, the room may become overheated. The occupant cannot turn to open the windows (as they are usually of fixed glass), so adjustable louvers and/or mechanical ventilation (preferably both) are the only solutions.
The second type of solar housewhere the sun’s heat is used to warm a liquid or solid solution which is then employed as a fuelhas captured the attention of Dr. Telkes and her M. I. T. staff. Investigation has been made on the problems of collection of solar energy, storage of solar energy, and the distribution of stored solar energy, with specific reference to Telkes’ solar house in Dover, Massachusetts.* Of particular note here is the fact that the collector is oriented in such a position, according to the discussions in previous sections, to receive a maximum of sunshine in the winter, when heat is needed the most.
Figure 76 shows the south wall of this sun-heated home. The large windows have a glass area consisting of 18 double-glass-paned sections, each section being 4 x 10 feet in size, for a total of 720 square feet. Figured glass was employed, for, besides being relatively inexpensive, it reflected and scattered some of the sky’s color. This effect was more attractive, it was felt; if regular window glass had been used, it would have permitted the unpleasant black color of the metal collector plate behind it to pass through. The warmed air circulates behind this and is forced, by fans, down through ducts to collector bins (see plan, Figure 77). Here the solar heat is stored in 5-gallon drums filled with a chemical solution of anydrous sodium sulfate (Na2SO4) mixed with the
* This is distinguished from the two solar houses built on the M.I.T. campus
Figure 74 (above). House for Chicago construction company. George Fred Keck and William Keck, architects. Figure 75 (right). Plan.
Figure 73. Green’s ready built houses, Rockford, Illinois. South elevation. George Fred Keck and William Keck, architects.
Figure 76 (left). South wall of sun-heated house at Dover, Massachusetts. Eleanor Raymond, architect. Figure 77 (above). Plan.
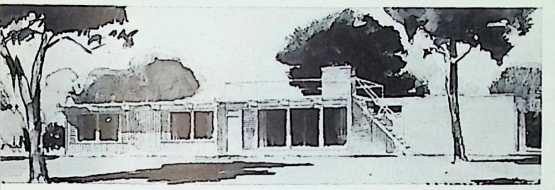
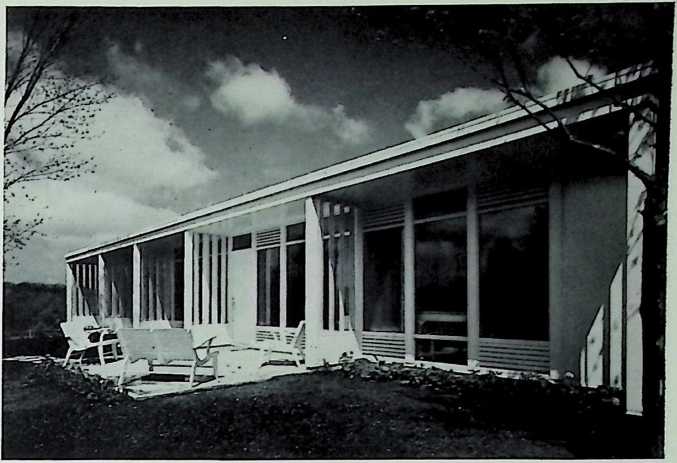
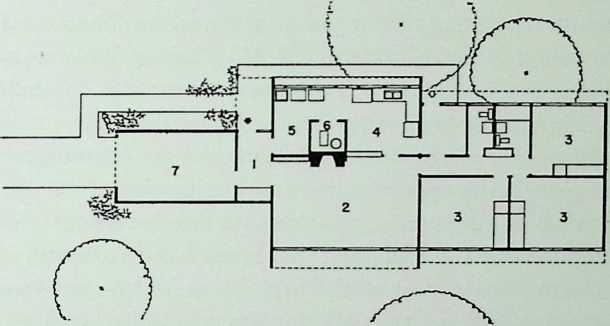
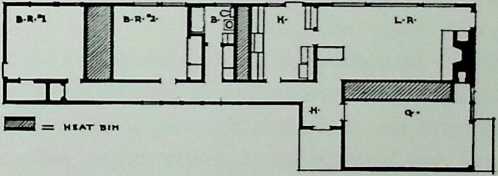
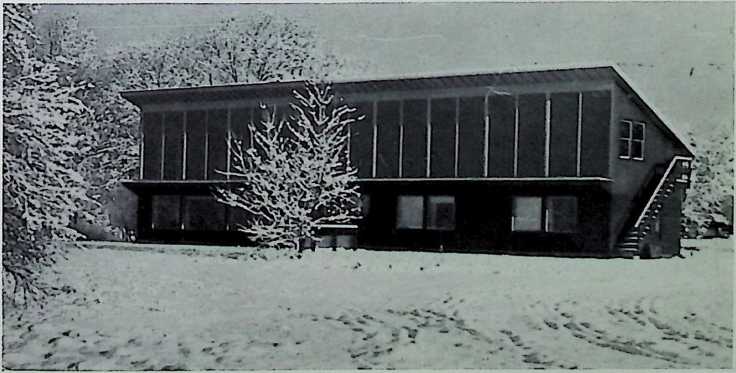
required amount of water and small amounts of additional agents for the promotion of crystallization and the inhibition of corrosion. Heat is transferred from the bins to the rooms by use of fans. The average amount of collected solar heat by this method in one February was 429 Btu per square foot per day, which corresponds to a collection efficiency of 41.2%. The total heat obtained that month, through the collector and windows, was 11,600,000 Btu and the heat loss was 10,400,000 Btu. Credits for this distinctive house all go to women: Eleanor Raymond, Architect; Amelia Peabody, owner; and Maria Telkes, Department of Metallurgy, Massachusetts Institute of Technology.
Another expert in the matter of collecting and storing the sun’s energy is Dr. G. O. G. Lof, Director of the Industrial Research Institute at the University of Denver, Denver, Colorado. According to Dr. Lof, the work in solar heating, and particularly solar cooling, has been in the experimental stage for the last five years. The equipment developed, he remarks, is not yet ready for public sale and use. But, according to the Architectural Forum edition of The Magazine of Building (Feb. 1947), the researchers in Colorado have provided us with the following data: “The optimum tilt for heat collection during this winter period could be found by adding approximately 3 degrees to the latitude. . . . The three- degree figure is the approximate mean declination of the sun during this period, that is, its average position is 3 degrees below the equator. To collect and utilize the solar heat in a house having a heating requirement and collector area similar to the experimental house and having one-day heat storage capacity, the collector should ideally be tilted at an angle equal to the latitude plus approximately seven degrees.”
Different slopes are necessary for heat collection and heat utilization because in the fall and spring a large portion of the collected heat would be discarded as a result of the small heating load in those seasons. The slope for heat utilization, therefore, must be one that will favor the sun in the winter months.
According to the directors of the M. I. T. solar research program, an appropriate collector tilt for utilizing the sun’s heat in different sections of the country is the sum of the latitude and 15 degrees. Yet they add that a variation of plus or minus 8 degrees from the angle thus obtained would make little difference in the heat absorbed and takes in a period from the middle of October to the beginning of March, the greater part of the heating season.
The reason for this is as follows. Taking Boston as an example, we see that its latitude is 42° 21 N. If we add 15° for the rule-of-thumb method we get 57° 21, and another 8° (for the suggested leeway) makes the angle 65°. Now, at noon on December 21, the altitude of the sun at Boston is 90 -=• (42° 21 + 23° 27) = 24° 12. Thus, a surface perpendicular to this would be approximately at an angle of 65°, the same obtained by the rule-of-thumb method.
However, it does not make much difference whether this angle is 65°, or 57°, or 60° or 70°. Naturally, the optimum incidence would occur
if the sun’s rays were perpendicular to the collector wall; but if they are not absolutely perpendicular, the actual radiation received may be calculated according to the cosine law, where the cosine of the angle is the determining factor. The cosine for 5° is 0.996, for 10° is 0.985 and for 15° is 0.966. Thus if a surface is 5° “off” being perpendicular it would still receive 99.6% of the sun’s rays; if it is 10° it would get 98.5%; and if 15°, 96.6%. Actually, a south-facing vertical wall collects practically as much sunshine as an “optimum-tilted” surface does, because during the winter there is generally snow on the ground which reflects additional sunshine to a vertical wall; ground reflections received by a tilted wall would be somewhat less. A tilted wall is also apt to receive less sunshine if a heavy snowfall covers it in winter and too much sunshine in the summer, when the heat is not needed. It must also be pointed out that a vertical wall is useful in that it is a natural component of the house, whereas a tilted wall is not.
It would thus appear that for a 40° latitude, or that running on a line just north of Philadelphia, the following angles would be suitable: For the latitude of Montreal the following angles are appropriate: for heat collection, tilt wall at 40° plus 3°, or approx. 43° for heat utilization, tilt wall at 40° plus 7° to 22°, or approx. 47° to 62°
What is the practicality of the heat-storage type of solar house? According to John Kobler, writing in The Saturday Evening Post: “At present the majority of authorities in the solar heating field are inclined to draw a line from below Boston to West Virginia, across Kentucky, Missouri and Kansas; through the southern areas of Colorado, Utah and Nevada, and rising to encompass most of California. North of that line solar heating may not be practicable. Hottel* himself does venture to predict that in the not too distant future solar houses should be generally available below that boundary at no greater loss than ordinary houses. In about ten years, he thinks.”
The Architectural Forum edition of the Magazine of Building in February, 1947, noted that other considerations for the use of collected solar energy include: “the possibility of using the heated air to operate an absorption type of refrigerating air conditioner. Such a unit is available commercially, and the application of solar energy to its operation is considered to have excellent possibilities. It is apparent that the period in which the greatest energy is received corresponds exactly to the period in which the greatest cooling is required. The apparatus would therefore be able to provide the most cooling at the time it is needed.”
Methods of capturing the sun’s rays have been discussed. But there is also an important consideration regarding the exclusion of solar heat under certain circumstances. Examples might be that we want to avoid the hot, low western sun in the evenings; we might want the sun in certain rooms only at various hours; or we might want an even light for certain types of work.
* Prof. H. C. Hottel, chairman of M. I. T.s Solar Energy Committee.
Figure 79. Example of the Youtz-Slick lift slab method of construction.
Figure 78. House in Englewood, New Jersey. George Nenieny and A. W. Geller, architects.
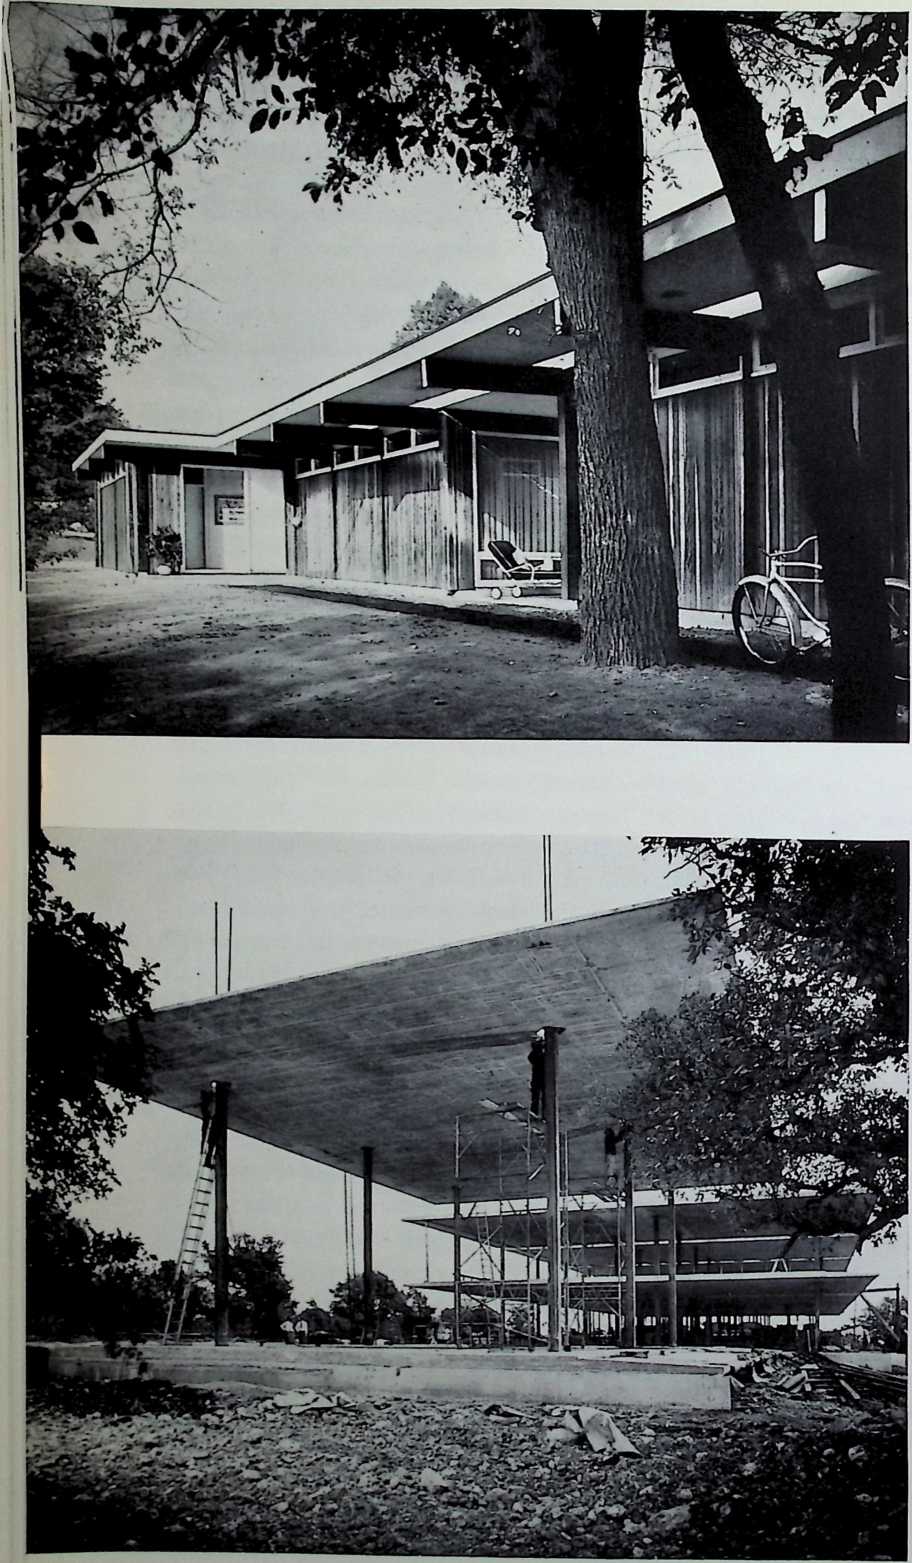
If we cannot provide for this need of avoiding the sun in the basic planning, we can turn to several devices, included in any of the four following methods: shading, reflection, insulation, and shape of materials. However, these should be resorted to only if there is no other previous means of accounting for undesirable sun.
Control of the sun by shading removes the sun before it has a chance to light or heat a surface. The principle involved is that the sun should not be given the opportunity of entering the fabric of the building in the first place. This can be accomplished by artificial means and by natural means.
One widely-used artificial means is the overhang. Overhangs can be designed to exclude the sun from various vertical surfaces at any time of the day or year. Much use has been made of this idea, so that one may expect “ten-gallon-hatted houses” or “crew-haircut houses” (according to the degree of overhang) in almost any part of the country.
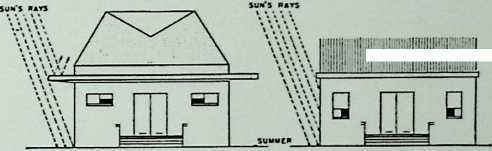
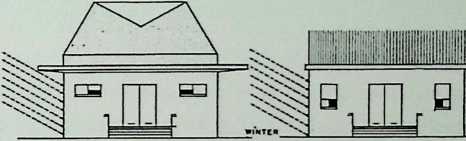
[TCH SALLOW - MAT T tQ HQUSC C»EW-HAI«CMT MCUX]{.underline}
Figure 80. Overhangs on “ten-gallon- hatted houses” and “crew-haircut houses” designed to exclude sunlight in the summer and allow sunlight to enter in the winter.
How do we design a suitable overhang? Well, for the day of the year and hour in question we must consider the positions of the altitude and azimuth of the sun. Then determine if the azimuth is such that the sun will hit the wall in the first place. If the sun does hit the wall, determine at what angle it will do so. By means of trigonometry or the various charts previously discussed, determine what depth of overhang is necessary to produce the desired results.
A graphical method is outlined in Time-Saver Standards. It is a complicated method, so is not here reproduced. However, the reference is provided in the bibliography for the convenience of the reader who desires more complete information.
Figure 78 depicts an overhang on a home designed for Morris Winograd in Englewood, New Jersey, by architects George Nemeny and A. W. Geller. Note the simplicity, and the opening near the wall, on the main section, to permit air circulation.
Farther south, in Texas, overhangs have been considered quite a desirable feature by architect O’Neil Ford, of San Antonio. In fact, he even provides an overhang to shade the workmen while a building is being constructed. This is because Ford is one of the leading developers of the Youtz-Slick lift slab method of construction. The Institute of Inventive Research in San Antonio, for which Ford is a consulting architect, has described this method as consisting basically of pouring upper floors and roof of a structure at the ground level in their relative positions in the building, and then mechanically lifting them to the proper elevations, where they are permanently fastened to the columns. In other words, the floors and roof are prepared, like pancakes one atop another, on the ground; then they are lifted by hydraulic jacks to the desired elevation. As can be seen in the photograph, Figure 79, once the slabs are up, the workmen can go about their other business in constructing the walls, rooms and other components of the building, while shaded completely from rain and the hot Texas sun. Ford terms this “the very essence of shade and shelter.”
The classroom-and-administration building for San Antonio’s Trinity University is the first building that was constructed by this technique, and it has proved so successful that many large structures have now been put up this way. Credits go to architect O’Neil Ford, Jerry Rogers, Bartlett Cocke and Harvey Smith; to consulting architect William Wilson Wurster; to mechanical and structural engineer Frank P. Drought; to consulting engineer Fred N. Severud; and to general contractor James T. Stewart and Company. Figure 81 illustrates the south elevation when completed. Note the eight-foot wide overhangs which allow no sun to enter, and which prevent glare in the classrooms.
The south wall of the library (Figure 82) depicts an overhang plus sunshades, which are very necessary in fall, winter and spring. These shades are made of 2" x 4" rough redwood on adjustable steel outriggers, supported on stainless steel adjustable cables. This photograph is poor in that it was taken in the summerthe time of year that no sun ever hits the shades, being kept off by the roof overhang or by vertical obstructions.
In the dormitory wing (same credits as above, except G. W. Mitchell was the general contractor) there are also wide overhangs along the passage fronting the south exposure (see Figure 83) as well as louver devices made of redwood. There is little traffic in the corridor, so this area may be used on hot evenings as a study porch, adjacent to the rooms which occupy the entire depth of the building, so designed as to permit cross-circulation of the south breezes.
Another set of buildings which illustrates how relatively-inex- pensive overhangs can be provided through the use of lift-slab techniques is the 200-unit (86.35 per square-foot) Public Housing Administration project in Corpus Christi, Texas. (See Figure 84.) Richard Colley was the architect, Blucher and Naismith were the structural engineers, and C. C. Hinchberger was the general contractor.
William Lescaze, in his design for the Longfellow Building, 1201 Connecticut Avenue, Washington, D. C., built in 1940, combined overhangs with balconies. Installed on the west wall (see Figure 85), they provide protection from the sun during the hottest hours of the day. Fred
Figure 81. South elevation of classroomadministration building, Trinity University, San Antonio. ONeil Ford, Jerry Rogers, Bartlett Cocke, and Haney Smith, architects.
Figure 82 (above). Overhang and sunshades on south wall of library, Trinity University.
Figure 83 (below). South elevation of dormitory, Trinity University.
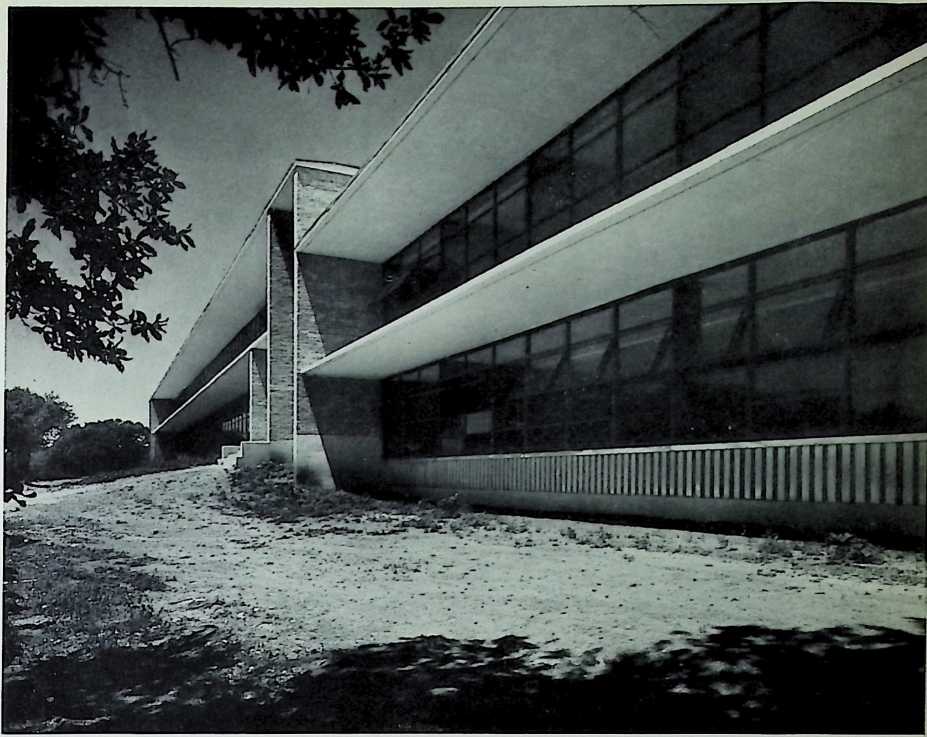

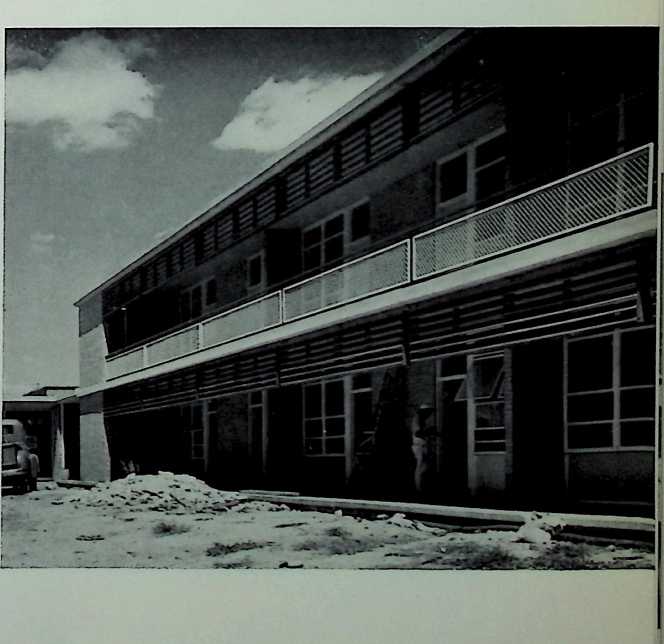
Figure 84. Public Housing Administration project, Corpus Christi, Texas. Richard Colley, architect.
Figure 85 (below). Overhang balconies on west wall of Longfellow Building, Washington, D. C. William Lescaze, architect.
Figure 86 (below). Shades overhanging the windows of the professional building, Swifton Shopping Center, Cincinnati, Ohio. Ketchum, Gind and Sharp, architects.
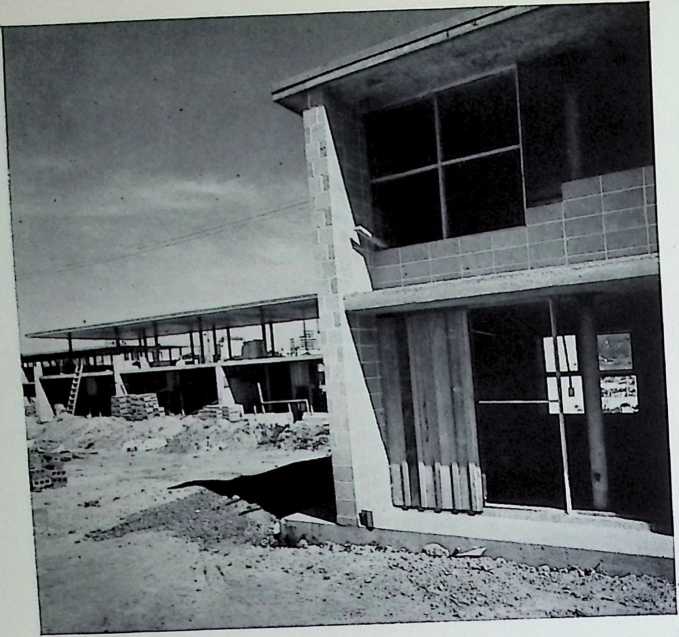
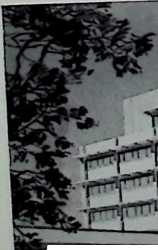
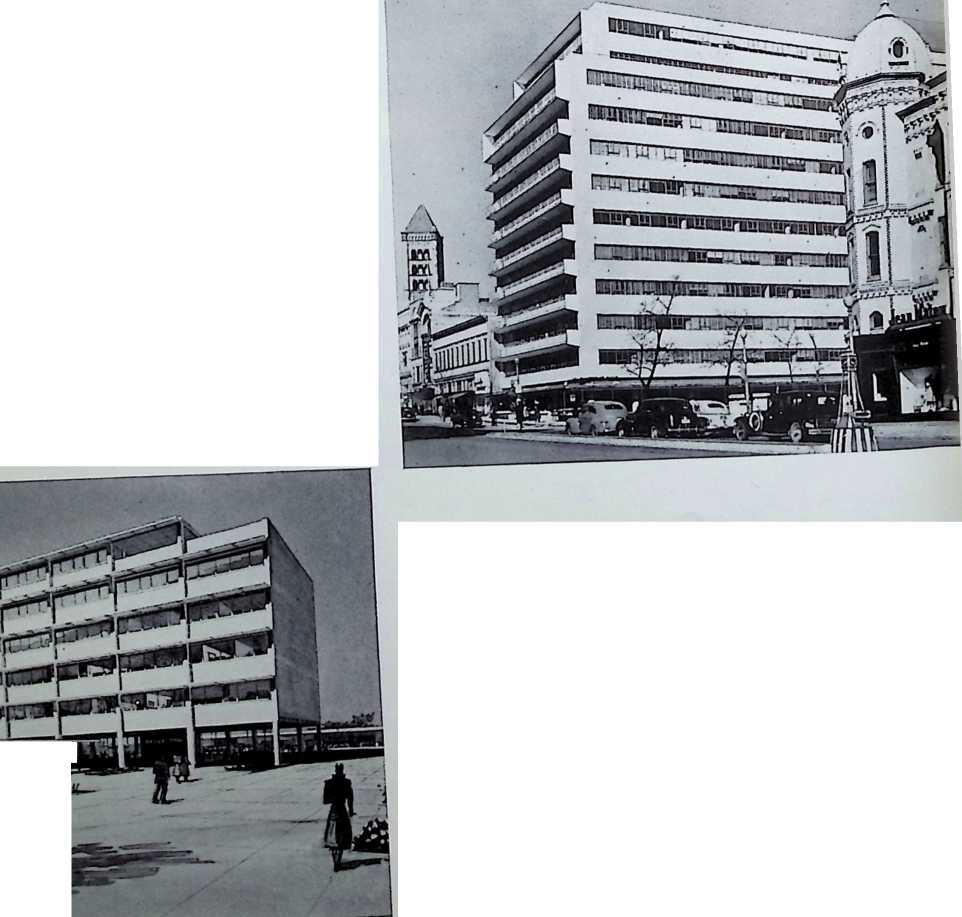
N. Severud and Leslie J. Hart were the structural and mechanical engineers respectively. Hart reported, incidentally, a considerable reduction of the air cooling load through the use of shading devices, which shows that not only do they add to comfort but they also provide for economy.
A similar effect was achieved in the new design for Swifton Shopping Center, Cincinnati, Ohio. A one-third reduction in the cooling load was obtained by using shades overhanging the windows. Figure 86 shows a view of the professional building from the south. Ketchum, Gina and Sharp were the architects; Severud, Elstadt and Krueger, the civil engineers; Syska Hennessey, the mechanical engineer; and Jonathan Wood- ner Company, the owners and developers. Homer Hoyt prepared the economic survey.
Louvers can be of either the exterior type or the interior type. The exterior type is known as sun breakers or sun brakers (English), brise- soleil (French), quebra sol, or quebra luzes (Brazilian Portuguese).
The brise-soleil, as it is known today, can be attributed to the inspiration of Stamo Papadaki. Le Corbusier, however, has probably used it in more buildings than anyone else. He began experimenting with Papadaki’s idea in 1921, and in 1928 his thoughts were first expressed in studies for a villa at Carthage.
It was entirely surrounded by a brise-soleil, which was formed of long horizontal overhangs calculated to keep out the sun at certain hours. More advanced features were used in buildings by Le Corbusier at Barcelona a few years later. The existing pattern of design began to emerge; in 1933, the problem of sun control presented itself once again in an Algiers apartment building. The north and east sides were fitted with glass unprotected from the sun’s rays, but brise-soleil were installed
Figure 87 (below). View of the southern facade of Christopher Columbus Memorial
on the south and west facades. However, Le Corbusier soon discovered
Lighthouse designed by Stamo Papadaki for a competition held in 1928. Horizontal louvers of reinforced concrete cantilevered from the main structural columns protect the north, east, and south facades of the chapel, which were to be entirely glazed.
Figure 88 (above). Model of a wood workshop and dwelling unit designed by Stamo Papadaki and built in Athens in 1930. Between two parly walls and facing on the south a street less than 17 feet wide, the building is recessed 8 feel from the building line; further protection of the southern facade is achieved by means of an overhead slab high enough to permit circulation of air.

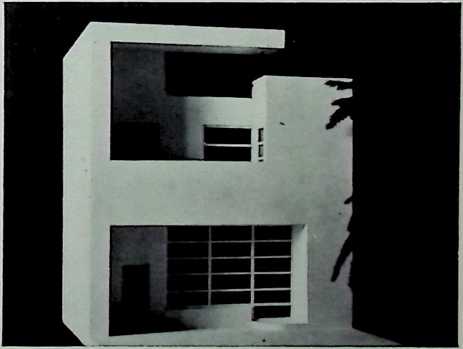
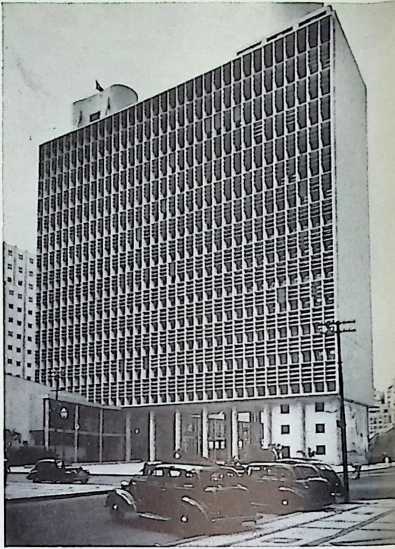
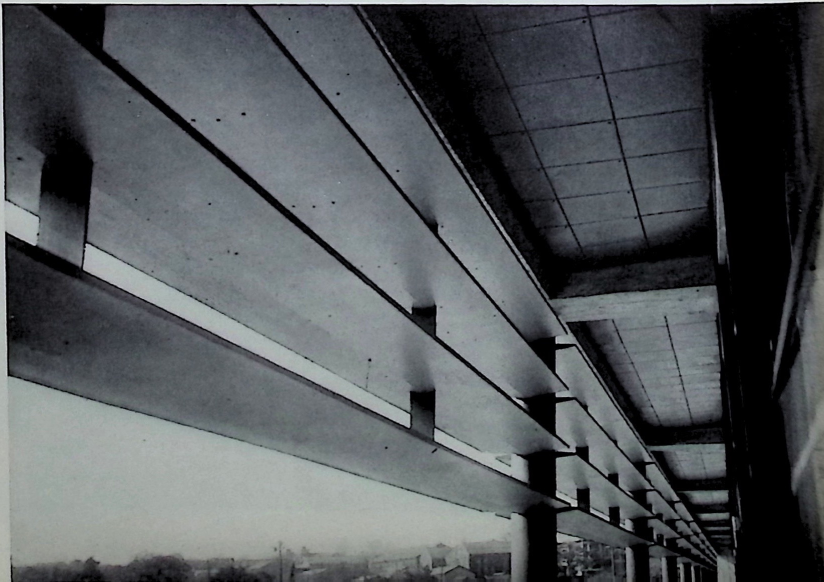
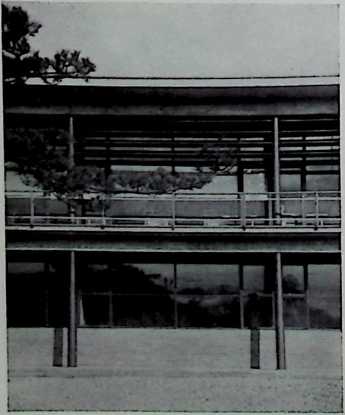
Figure 89. Ministry of National Education and Public Health, Rio de Janeiro. Le Corbusier, Lucio Costa, Oscar Niemeyer, Alfonso Reidy, Carlos Leao, Jorge Moreira, Ernani Vasconcelos, architects.
Figure 90 (below left). Horizontal-fixed type of brise-soleil on the south wall of the Reader’s Digest Building, Tokyo. Antonin Raymond and L. L. Rado, architects. Main elevation. Figure 91 (below). Louvers, looking outward.
that his horizontal shades were ineffective against the setting sun in the west, and this led him to replace these with vertical louvers set perpendicular to or oblique to the wall. This he regards as a significant step in the advancement of architecture.
In 1936 Le Corbusier went to Rio de Janeiro, where, in cooperation with some Brazilian architects[4], he designed the offices of the Ministry of National Education and Public Health. The sun-breaker used here is a combination of the studies at Barcelona and Algiers. The Brazilians liked the brise-soleil, and almost immediately began to use them and develop them in all their new buildings. Le Corbusier himself, when he returned to Brazil after the war, was pleasantly surprised to see the progress that had been made there during his absence.
In 1938 Le Corbusier designed the Palace of Justice in Algiers and transformed the brise-soleil by giving it the importance of an accessible “loggia.” That same year some laboratories were built with three kinds of brise-soleil-. egg-crate or honeycomb shades called “les alveoles,” for south orientation; the accessible “loggias”a sort of shaded porch; and vertical brise-soleil for west orientation. In describing these features, Le Corbusier employed unconventional terms in the French language. This rendered it difficult not only for the reader but also for spokesmen at the Consulate General of France to interpret his remarks.
The horizontal or vertical types of brise-soleil may be either fixed or mobile.
The horizontal-fixed type of brise-soleil is shown in the south wall of the Reader’s Digest Building, Tokyo, Japan, designed by Antonin Raymond and L. L. Rado. The main elevation can be seen in Figure 90, with a closeup of the same louvers, looking outwards, in Figure 91. This latter picture shows without a doubt that although the fins cut out direct sun it is by no means dark inside the structure. Figure 92 portrays fine drawings of these louvers as well as a section through part of the building.
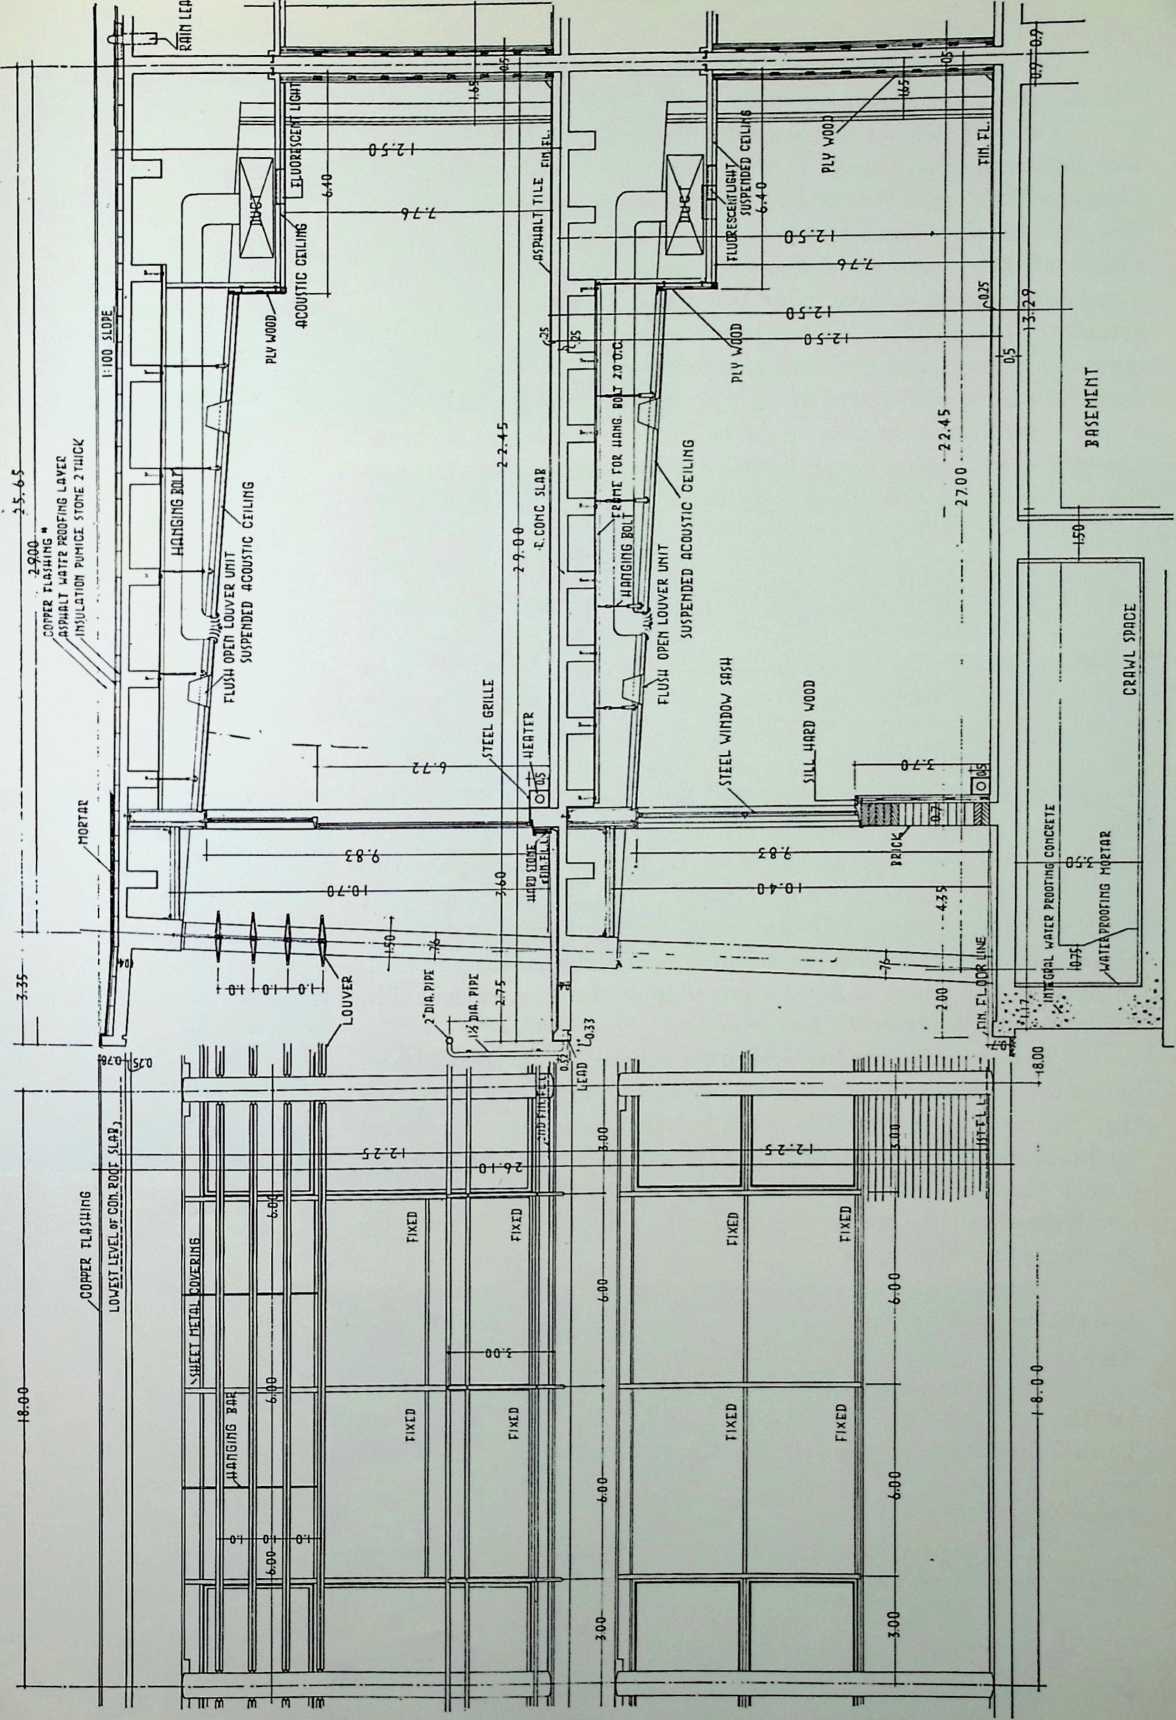
Figure 92. Louvers and building section, Reader’s Digest Building, Tokyo.
Le Corbusier, incidentally, has used the horizontal-fixed type with success in the Algiers apartment house, amongst other places.
Voorhees, Walker, Foley and Smith, New York architects, have used horizontal-fixed louvers in their design for the Mene Grand Oil Company Building in Puerta La Cruz, Venezuela. Figure 93 depicts a view from the south-east. As this site is near the equator, the sun, at one time or another, shines on all four walls; hence, the brise-soleil here surround the building entirely. Note that the exterior line of columns is actually on the outside of the structure. The windows are installed on the inner side of these, and the louvers are fixed to the outer side, a few feet away. Thus, there is created an air space with a chimney effec-t, which assists in ventilating the area. As can be seen from the absence of vegetation, the country is very arid; but all aluminum brise-soleil and fixtures were necessary because of the corroding influence of the salt water in the area.
The horizontal-mobile type of brise-soleil occurs in the Ministry of National Education and Public Health in Rio de Janeiro. (See Figure 89.)
It has also been employed admirably by Antonin Raymond in his design for the Dormitory for the disciples of Sri Aurobindo Ghose, in Pondichery, French India. (See Figure 94; for roof detail see Figure 162.) The main consideration in using such louvers was to offset, without mechanical means the extremely hot, damp climate found there on the east coast of India. Operable, horizontal louvers were installed on the north and south sides so that there would be afforded protection not only from the sun but from the occasional violent winds and rain, allowing, at the same time, uninterrupted ventilation. Inside, sliding partitions between bedrooms are door-height, to permit air passage even when closed. In summer, also, many of the students sleep on the stone windows sills, similar to that in Figure 95, for coolness.
This type of louver has worked out very well in private residences and in such buildings as Raymond’s Dormitory. However, it is reported that they are not very good in public buildings, as in the one indicated for Brazil, because of the tendency of the employees to abuse their use; in such situations they get damaged very quickly. It is also not wise to install them near the sea, as the damp salt-air often assists in rendering the mechanism inoperable.
The vertical-fixed type of brise-soleil occurs in the Brazilian Press Association Building (A.B.I.) in Rio de Janeiro. There are fixed concrete blinds in this case, designed by Marcelo and Milton Roberto.
It is again seen very effectively in Raymond and Rado’s design for The National City Bank of New York building in Nagoya, Japan. Vertical-fixed louvers are installed on the west wall, and horizontal fixed ones on the south, as seen in the dramatic nighttime photograph of Figure 96.
The vertical-mobile type is seen in Oscar Niemeyer’s Rio de Janeiro day nursery. Here there are asbestos blinds. A simple mechanism
Figure 94 {above). Dormitory for the disciples of Sri Aurobindo Ghose, Pon- dichery, French India.
Figure 95 (left). Horizontal-mobile brise- soleil, Pondichery dormitory.
Figure 96 {below). Vertical-fixed brise- soleil on west wall and horizontal-fixed brise-soleil on south wall, The National City Bank of New York building, Nagoya, Japan. Raymond and Rado, architects.
Figure 93 {left). Horizontal-fixed louvers on Mene Grand Oil Company Building. Puerta La Cruz, Venezuela. Voorhese, Walker, Foley and Smith, architects.
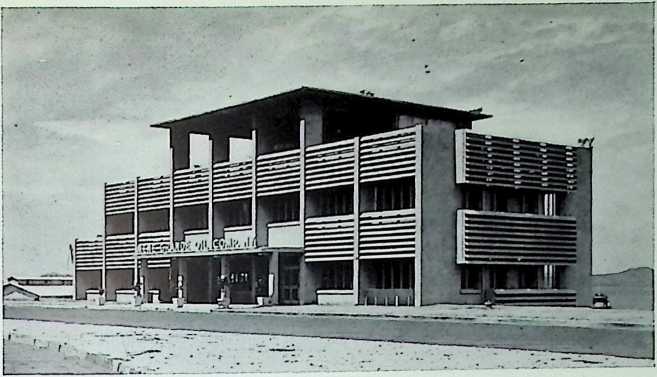

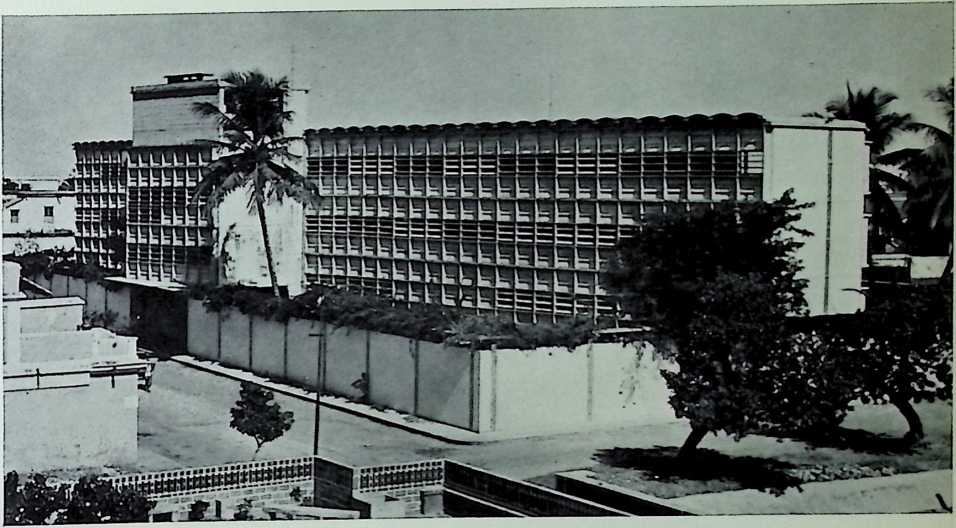
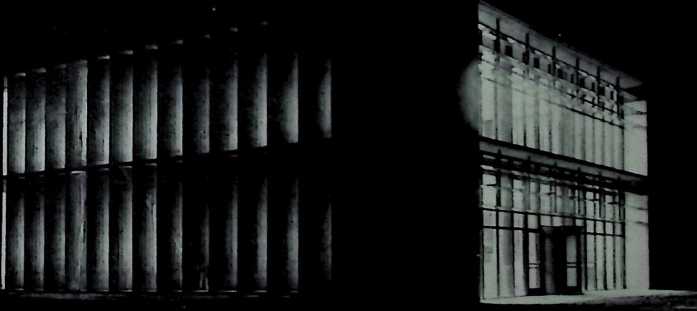
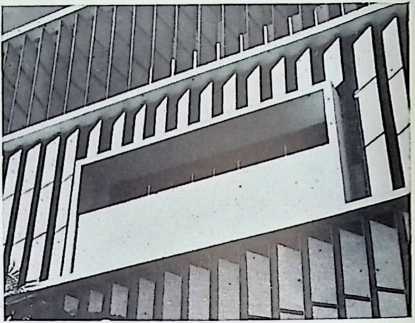
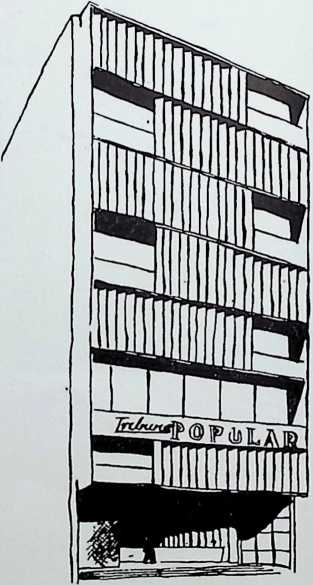
Figure 97. Vertical-mobile brise-soleil. Rio de Janeiro day nursery. Oscar Niemeyer, architect.
Figure 98. Vertical-mobile brise-soleil on the main elevation of Tribuna Popular, Rio de Janeiro. Oscar Niemeyer, architect.
adjusts them as desired, as seen in Figure 97. A similar brise-soleil to the above is used in a Niemeyer-designed newspaper office and plant, the “Tribuna Popular” of Rio, a sketch of which is seen in Fig. 98.
Movable vertical louvers, this time of aluminum, on the south wall of a structure closer at hand, were designed by Richard J. Neutra for the Northwestern Mutual Fire Association Building. (Figure 99.) The elevators are defined by the interesting block wall construction to the left of the main entrance; the planting, conceived by landscapist-team Mr. and Mrs. Samuel L. Harrison with Mr. Neutra, “adds a rich subtropical touch to the elegant color scheme of the building.”
Commenting on the merits of the Brazilian work, Philip Goodwin says in Brazil Builds: “Her great contribution to modern architecture is the control of heat and glare on glass surfaces by means of external blinds. North America had blandly ignored the entire question. Faced with summer’s fierce western sun, the average office building is like a hothouse, its double-hung windows half closed and unprotected. The miserable office workers either roast or hide behind airless awnings or depend on the feeble protection of Venetian blindsfeeble because they do nothing to keep the sun from heating the glass.” Le Corbusier strikes an interesting note when he comments, . le mot employe icile brise-soleil stipule quon s’est rendu maitre d’un element.” Had brise-soleil been used at the turn of the nineteenth century Jane Austen, through the mouth of Lady Catherine, in her novel Pride and Prejudice, might not have had occasion to say: “This must be a most inconvenient sitting-room for the evening in summer: the windows are full west.” Or, Mrs. Bennett could have replied: “It will be all right after Le Corbusier of Paris arrives on the Dover stagecoach today.”
Brise-soleil, to the knowledge of the author, have not been used in the Montreal district. Anyway, it is felt that one is not justified in using horizontal brise-soleil of any kind in Montreal, because shading that is offered by horizontal brise-soleil can be achieved more satisfactorily by overhands, snow is apt to collect on the horizontal types in winter and cut out the passage of light, and hot air is liable to stagnate under each blade of the brise-soleil-, it is produced by the sun beating down on the blade below. It is recommended that vertical-fixed brise- soleil be the only type employed in an area like Montreal, and then only to obstruct the low western (and, in some rare cases, possibly the eastern) sun.[5] Because of the snow and ice, it seems unlikely that the mobile types would be suitable in Montreal’s climate. However, louvers of this type will be used in New York shortly on a proposed new skyscraper designed by William Lescaze.
The interior type of louvers usually takes the form of Venetian blinds, which are good in that they are adjustable to suit various requirements. However, in summer they are sometimes unfavorable because they
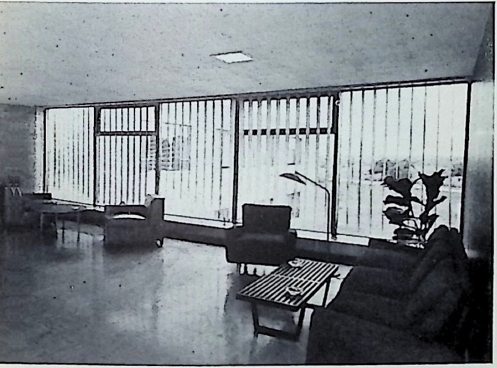
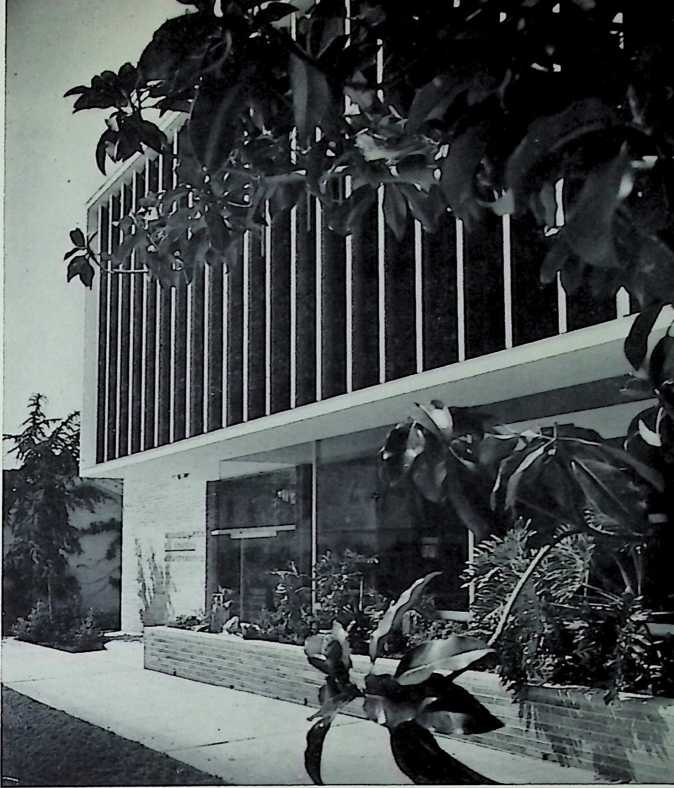 reflect the sun after it has passed through a window. Hence, a considerable part of the radiant heat is already absorbed inside the body of the house.
Figure 100. Interior vertical-mobile brise- soleil of canvas, Home for the Jewish Aged, Kansas City, Missouri. Kivett and Myers, architects.
Figure 99 (right). Aluminum vertical- mobile louvers on south wall of Northwestern Mutual Fire Association Building, Los Angeles. Richard J. Neutra, architect.
Architects Clarence Kivett and Ralph E. Meyers have employed an interior form of mobile vertical brise-soleil, made of canvas, in their design for the Home for the Jewish Aged, in Kansas City, Missouri (see Figure 100). Note the light and airy effect which assists in rendering this third-floor lounge, like the entire building, a place where old people go to live, not to die.
Sun screens can be in the form of screens attached to a building or of screens placed away from a building.
Jalousie blinds, attached to a building, are used quite frequently in warm climates. Figure 101 shows them on “Donagmore,” formerly the home of E. T. Weir and recently purchased by the United States
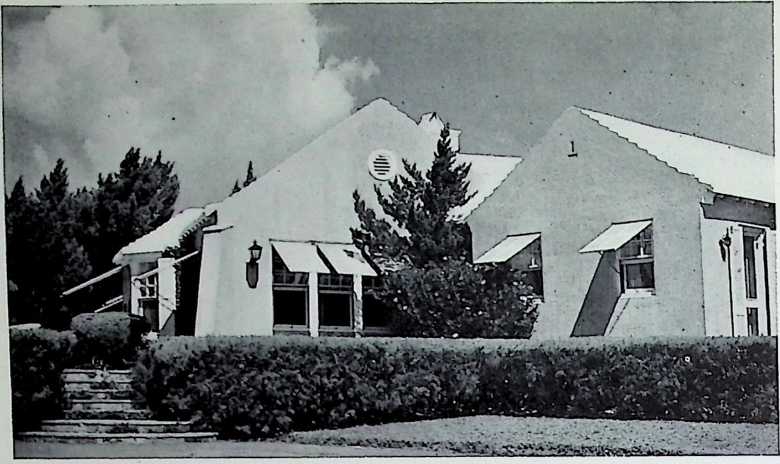 Government as the permanent residence for their representative in Bermuda,
Figure JOI. “Donagmore," Bermuda, showing jalousie blinds attached to building.
Push-out, roll-up wooden blinds on metal frames, such as designed by Saturnino Nunes de Brito for the Anatomical Laboratory in Recife, Brazil, are similar to the jalousie blinds, except that the blinds themselves can be moved up and down within the frames.
Shutters are common on American Colonial houses. However, they are also frequently employed on homes in Bermuda, as evidenced by the photograph (Figure 102) of a little cottage nestling among cedar trees. The roof here is peculiar to that island; the steps are designed to catch rain for drinking purposes.
Venetian blinds on the exteriors of apartment building windows have also been used in Brazil. These are undoubtedly quite appropriate for that climate and might be satisfactory for the southern U. S. A. all year, and northern U. S. A. and Canada in summer. However, if employed in northern areas, it would be advisable to detach them when their use is not so necessary in the winter. Possibly such a device could be integrally arranged with mosquito-netting screens in those localities which require protection from such insects.
Awnings are another type of sun screen, but they must be erected and removed according to the season. A very line detail of awnings is seen on the Philip Rosen house in New Rochelle, New York, designed by George Nemeny and A. W. Geller. Although they were not installed according to the architects’ directionsthey were supposed to be placed right at the window head, rather than above itthe solution is quite successful. (See Figure 103.) Note the sheltered sun-terrace too in this home. There is a fine view of a lake through the opposite window. In fact, the house was oriented to take advantage of the scenery even though it was on the north side; thus we see shading devices on the south wall only, as shown here.
 Although they are effective in shading areas, awnings sometimes tend to collect the heat underneath; and in localities where there is little
Figure 102 (below). Shutters on a house in Bermuda.
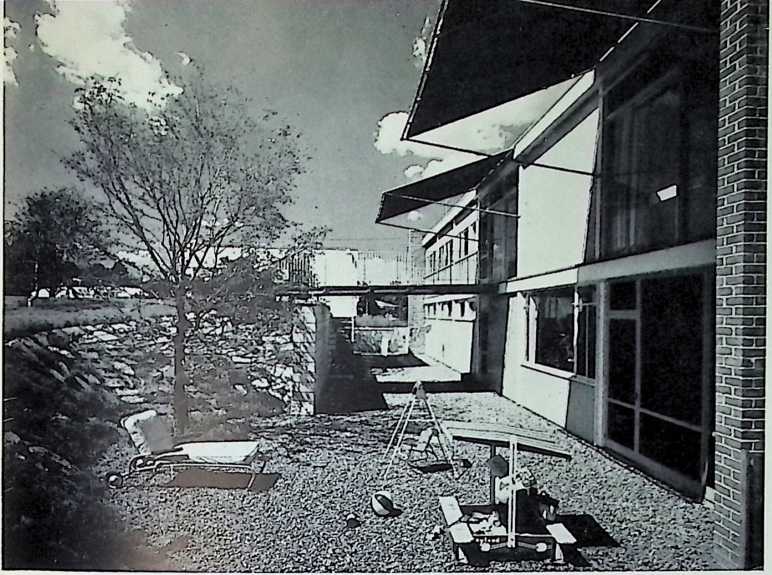
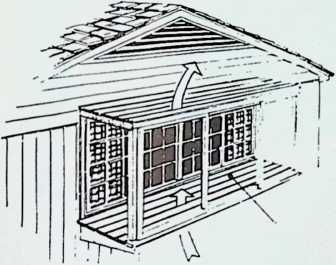
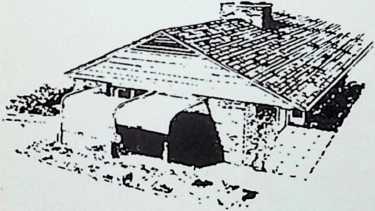
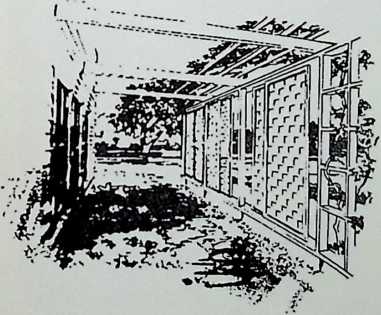 movement of air, this might be quite unbearable. The choice of such a device must rest on personal tastes. However, to avoid the accumulation of hot air in the awning type of device, Henry Wright has replaced the conventional canvas with a sunshade using heat-absorbent glass in a sash that slides back and forth, with an airwash behind it. It is also removable in winter. (See Figure 104.)
Figure 103. Awnings on house in New Rochelle, New York. George Nemeny and A. W. Geller, architects.
Figure 104. After Fitch.
Figure 105. After Fitch.
Figure 106. After Fitch.
The “overhead-door” type of solar shading device is especially effective on west walls. It is positioned towards the top at noon, but is lowered as the sun sinks in the sky towards evening. (See Figure 105.) In principle, this is very similar to the push-out, roll-up wooden blinds employed in Brazil. There is no climatic objection to using this where other means fail to provide the desired shade.
Horizontally-sliding shutters can be employed and operated in conformance with the movement of the sun. They are particularly suitable for shading west walls in summer. (See Figure 106.)
An adjustable canvas sun screen is often quite useful. Here it is shown as used by architects George Nenemy and A. W. Geller on the Jack Diamond home in Hewlett Neck, near Woodmere, Long Island. (Figure 107.) It is on the southwest side of the residence, adjoining the master bedroom.
A fixed curtain sun screen has been employed by O’Neil Ford and Jerry Rogers, architects, for the F. C. Hixon House in San Antonio, Texas. Here it is shown protecting the stair hall windows. Ford says that holding the shade away from the wall prevents a feeling of claustrophobia, allows a peek into the garden below, and permits better air circulation. Arthur Berger was the landscape architect for this fine dwelling and Bibb Brothers were the contractors.
A fixed sun baffle to obstruct direct sun rays from a roof has been conceived by Paul Lester Wiener and Jose Luis Serf for a hotel-club in Curasao, Netherlands West Indies (Figure 110), and resembles, in a way, a double roof detail which will be discussed again in Chapter 4. It is composed of concrete louvers on a beam and post structure, and
Figure 107. Adjustable canvas sun screen. Hewlett Neck, Long Island. George Nent- eny and .4. IF. Geller, architects.
Figure 110 (right). Electrically-controlled awnings and fixed sun bajjle on roof of Hotel-Club, Curasao, Netherlands West Judies. Paul Lester Wiener and Jose Luis Seri, architects.
Figure 108 (.below). Fixed curtain sun screen, San Antonio. ONeil Ford and Jerry Rogers, architects.
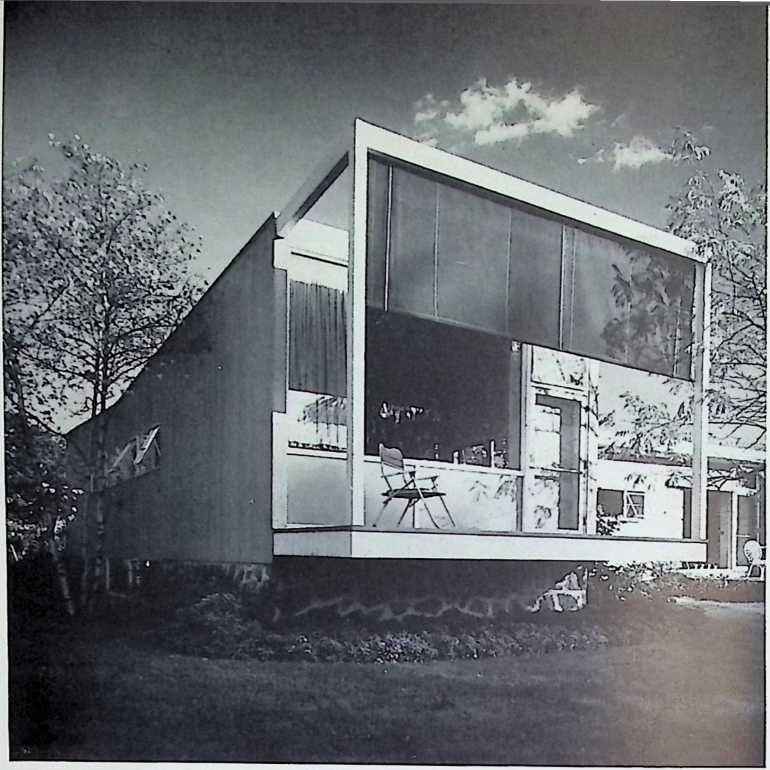

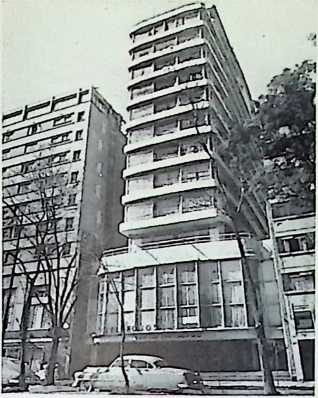
Figure 109. Interior Venetian blinds and curtains, Edijicio Continental, Mexico City. Carlos Lazo, architect.
through which the rain water falls to the lower roof, where cooling takes place by the evaporative principle.
In the patio of Wiener and Sert’s hotel in Figure 110 can be seen electrically-controlled awnings, which are adjustable according to the path of the sun. Compare them -with the “over-head-door” type mentioned previously.
Ordinary curtains as well as interior Venetian blinds just discussed in another section are also useful on occasions for controlling the sun. Both have been combined very nicely by Mexican architect Carlos Lazo in the Edificio Continental, Reforma 107, Mexico City (see Figure 109). Of course, in very hot areas they tend to let the sun’s heat inside the building and may thus be objectionable; but in Mexico City, noted for its eternal spring, they are probably quite suitable.
“Sudare” bamboo screens, as used in Japan (see Figure 8), are also very useful devices for obstructing the sun, while at the same time admitting proper ventilation.
Screens placed away from a building may be in the form of a fence, trellis work, stone wall, or other free-standing device suitable for
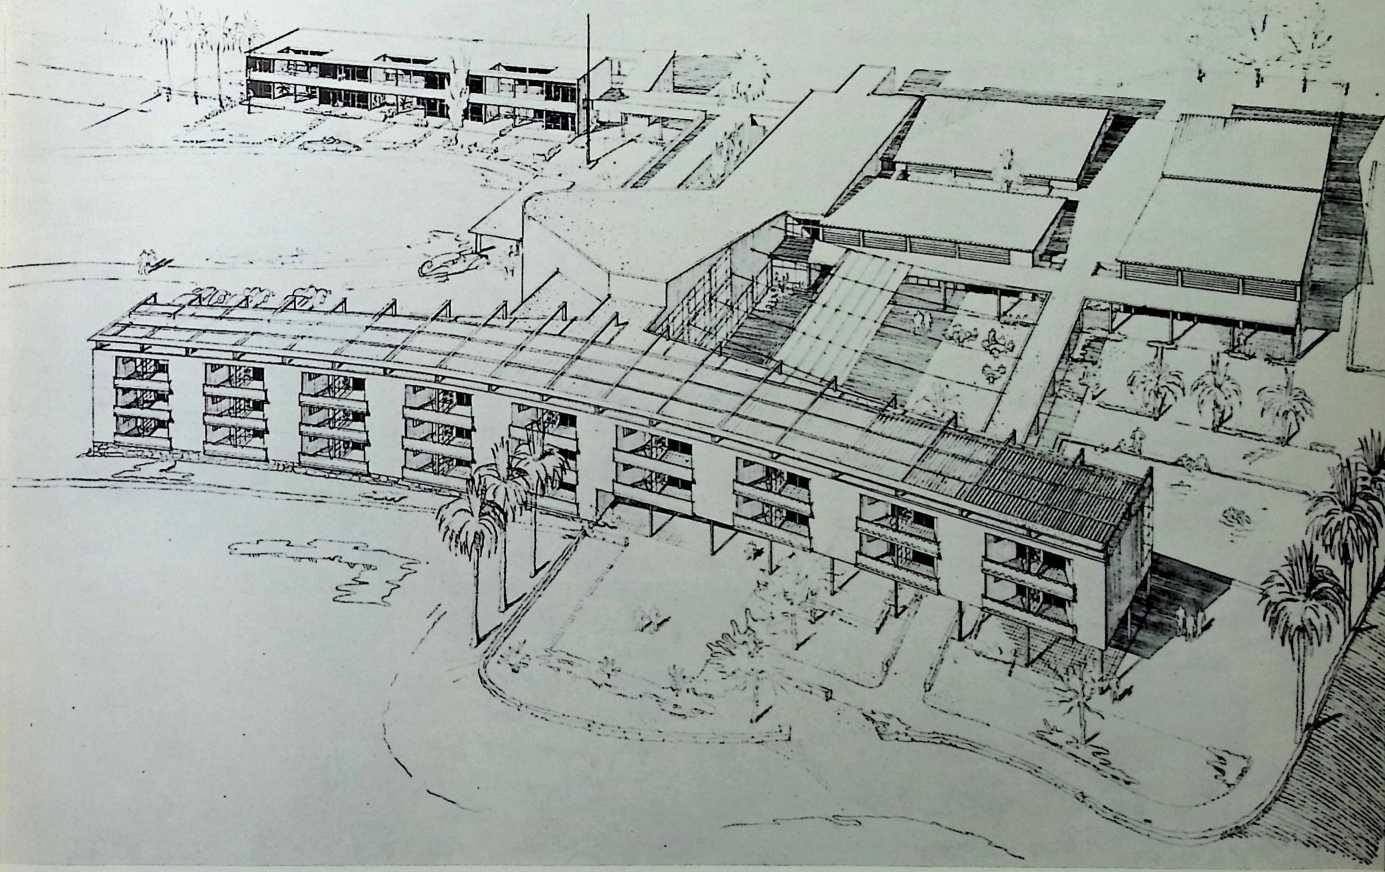
obstructing the sun’s rays. The architect’s ingenuity may be employed here to design interesting screens of different materials.
Natural means, devices found in nature, may also be used to shield the building from sunlight. Plants, vines, and trees which are used for shading can be placed either on the surface of the building or some distance away. The most useful item in favor of these methods, as opposed to the artificial devices, is that where the deciduous variety is employed, nature provides the shade and takes it away at exactly the appropriate seasons. Said the American landscape architect Garrett Eckbo:[6] “There is a specific functional value in deciduous trees, which we tend to ignore in our milder south and west zones in concentrating on evergreen material. This is the fact that they provide shade in the summer when it is needed, and let in the sun in the winter when it is needed. This simple fact makes deciduous trees (sycamores, elms, maples) the most relevant large trees for use anywhere close to buildings (except perhaps on the north side) or over garden or park spaces which are to receive fairly intensive use. The space beneath the big evergeen tree, cool and breezy Figure m (right). Clematis jackmani. in the hot summer, becomes dank and forbidding during cold and wet winter months.”
Ivy or other types of vines may be grown on a chain-link fence, trellis, or masonry wall. When used on fences it can provide, if properly placed, adequate shading for west walls as well as other elements in architectural designs. Vines are quite good in that they usually grow rapidly, and within a few months they can achieve the desired effects for the architect and his clients. In selecting vines one should consider their usefulness and attractiveness. They should be free from pests and diseases as well as being plants that will not succumb to extreme climates.
Three eminent plant-life authorities in Canada and the United States have been consulted concerning appropriate vines: Dr. R. D. Gibbs, Department of Botany, McGill University, Montreal, Quebec; Mr. E. J. Anderson, Superintendent of Parks, City of Westmount, Quebec; and Mr. Allan Dalsimer, nurseryman, landscapist, and flower- show medalist, Cedarhurst, Lons Island, New York.
Here are some recommended vines; but it should be stressed that climatic and soil conditions vary, and before doing any planting, one should check to see what vines are inclined to grow in the particular area under consideration.
ClematisPerennial. Herbaceous (dies to ground in winter). One of best vines. Grows 6 to 8 feet high. Needs trellis. Blooms all summer; blue, red, or white flowers. Is very good when used in combination with
Figure 111 (right). Vilis riparia, McGill University, Montreal.
Figure 113 (right). Grape arbor, Hewlett, Long Island, as planted by Allan Dal sillier.
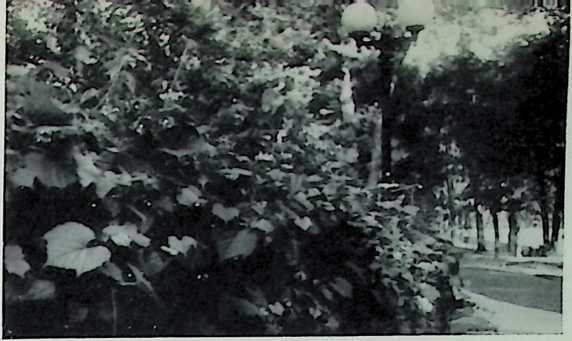
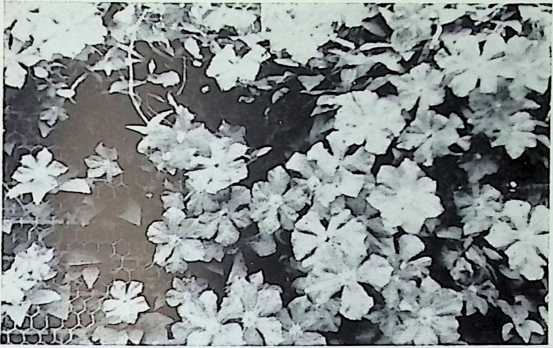
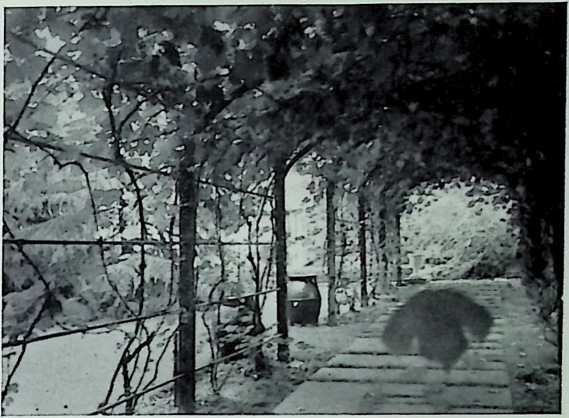
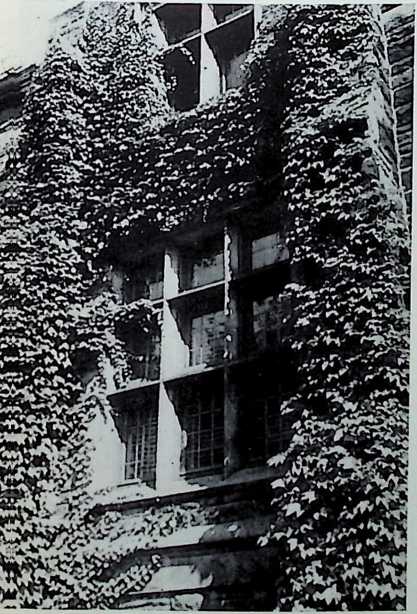
Figure 114 (below). Parthenocissus, Victoria Hall, Weslmount, Quebec.
c[lim]{.underline}bing roses; each gives the other protection. Roses flower in early and late summer, clematis in mid-summer, so there is a continuous display of blooms from May to September (see Figure 112).
Celastrus scandens (Bittersweet)Perennial. Very good. Needs latticework; cannot cling by itself to a wall. Has attractive and colorful winter berries. The Indians sometimes sell this seed by door-to-door canvass in winter it resembles small popcorn.
Vilis riparia (Frost Grape, River Bank Grape, etc.)Perennial. Quite good. Lattice-work or string required. Grows fairly high. Leaves from early in the year. Berries are edible. Figures 111 and 113 depict grape vines in Montreal and Long Island.
ParthenocissusPerennial. Grows high, and quickly. Does not require trellis as it will cling to masonry. Can be damaging if not cut back yearly. It tends to overrun everything in sight. Figure 114 shows this vine on Victoria Hall, Westmount, Quebec.
Hydrangea petiolarisPerennial. Grows 6 to 8 feet high. Good type for low walls or other surfaces. Quite attractive.
Wistaria (Wisteria)This is one of the most attractive vines, as it bears large, drooping clusters of white, blue, purple, or racemose flowers. It does not cling to masonry, but requires a frame of wire, wood, or other material. It grows rapidly, up to 19 or 20 feet in a season. There are several varieties, among which are the ver}- show}’, Wistaria chinensis, which is a native of China, and the Wistaria frutescens, which inhabits the United States.
Silver Lace VineA vine of a lighter shade. Blossoms end on June tenth, approximately.
Chinese Fleece VineLike the silver lace vine, also has attractive light shade. Blossoms die around June tenth.
*Clematis paniculate-*Often called “virgin’s-bower” although this term is correctly applied to the whole climbing clematis group. Is excellent vine in a large part of the United States.
Dutchmans PipePerennial. Good climber. Grows on trellis only. Hardy. ForsylhiaPerennial. Reaches 8 to 10 feet on trellis only. Quick growing; is in leaf in early spring.
Ipomoea (Morning Glory)Annual. Grows quite high, but only on trellis or latticework. Grows by July and dies in the fall. Attractive blue-purple trumpet flower, suitable for south or west walls; it requires a lot of sun.
Some vines may be undesirable because they cling to masonry with such strength that holes may be made in the mortar joints. In the winter moisture will accumulate here and freeze, damaging the wall to a greater, extent. In the close-leaved variety of vine, moisture may be trapped against a wall even during the warm parts of the year. It may thus be inadvisable to use such vines against surfaces, as wood, which are not always resistant to persistent moisture.
After the Annes are planted, one should train them to grow exactly in those positions necessary for the desired shading. This can be accomplished by pruning superfluous stems or by tying them in the places one wants them.
Trees, like vines, must be selected on the basis of usefulness and attractiveness. Climate is a criterion in both cases, for not only must the trees bear up to the rigors of the elements, but they must look as though they are appropriate for them. Thus, it is good to select trees that have a rugged appearance when the snow replaces the leaves in winter.
For example, Michigan architect Kenneth C. Welch, in his Grand Rapids home, when considering this aspect, found that two rather large Chinese elms were very helpful.
They are shown, together with other trees, of course, in Figure 116. The immediate succeeding pictures are all of the same view approximately but taken at different times of the day and year. Whereas Figure 116 depicts spring conditions, Figure 118 shows what it is like in the winter and Figure 117 at nighttime. (See other pictures, Figures 71, 72, and 171.)
The trouble with most elms, like these, is that they take such a long time to grow. Most architects would probably want shade immediately or in a few years time. Thus in the majority of instances it would be impractical to plant shade trees like those here or on the McGill campus (Figure 115) if quick results are desired. Recommended trees for shade purposes are:
 Populus sp. (Poplars)These are good for quick shade; however, they should not be employed for permanent planting. The roots eventually spread out a lot, near the surface of the ground; in doing so they may impair foundations and walls of buildings. Poplars should not be permitted to grow more than 10 years.
Figure 115. Shade trees on McGill University campus, Montreal.
Red Oak White Oak
Red Oak White Oak Chinese Elm
Chinese Elm
Figure 116. Trees seen through living room windows of Kenneth C. Welch home in Grand Rapids, Michigan.
Figure 118 (above). Winter scene, Kenneth C. Welch home.
Figure 117 (below). Night scene, Kenneth C. Welch home.
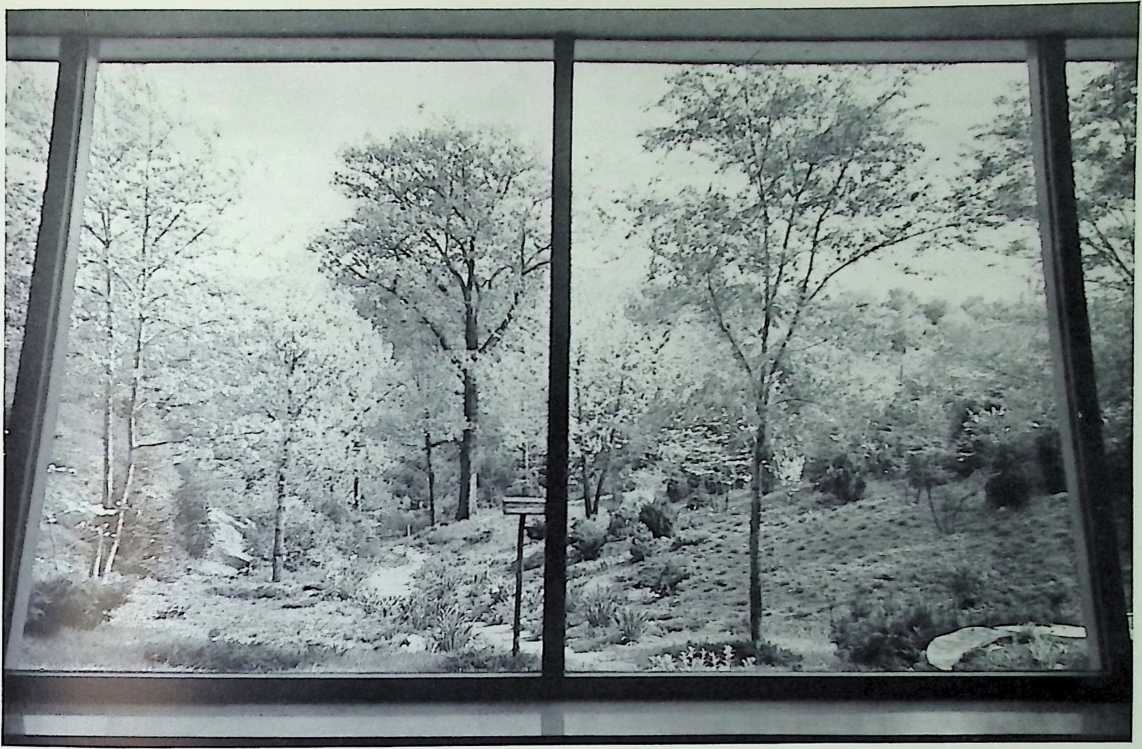
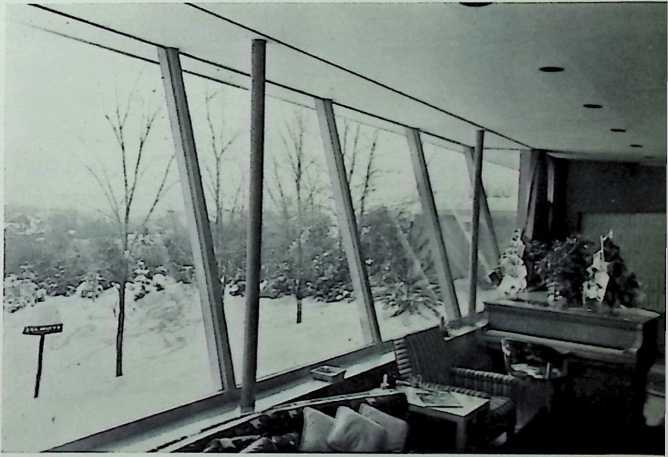
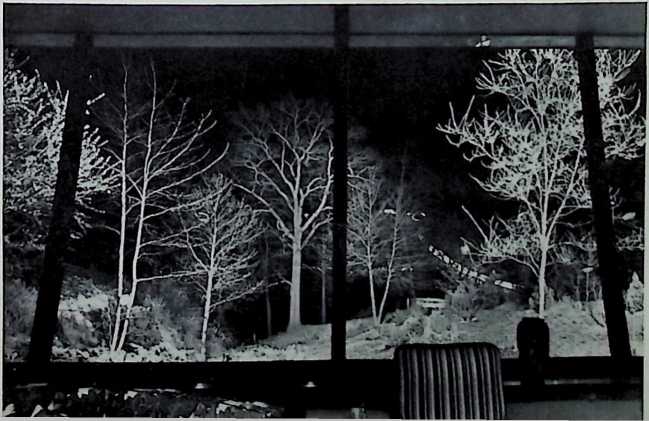
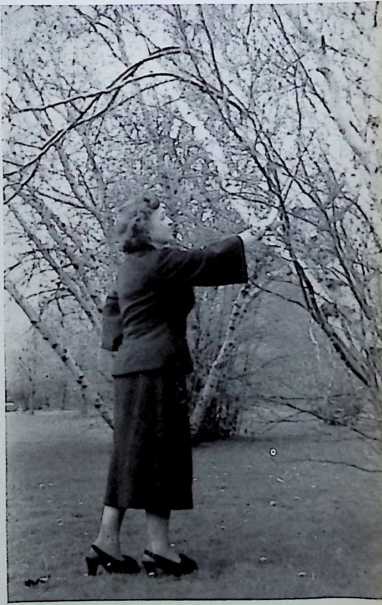
Figure 119. Betula papulifolia Marsh (Gray Birch) in Woodmere, Long Island. This is a small tree which grows up to 40 feet and adapts itself to both dry and moist sites. One should protect it from birch miners by such chemicals as Lindane.
Acer saccharinum L. (Silver Maple)Native Trees of Canada, published by the Canadian Department of Mines and Resources, says, “Very rapid growth and handsome foliage make this species . . . desirable …” Grows 80 to 90 feet in height and 2 to 3 feet in diameter. For permanent use, although Gibbs suggest that it be cut down after 20 years. Anderson notes that it can be made to spread out by consistent “dwarfing,” a type of pruning. Dalsimer prefers Norway Maple instead, as it is not prone to disease and cavities, as is the Silver Maple.
Acer saccharum Marsh. (Sugar Maple)This is slow growing; most small ones require 10, 15 or 20 years to approach any satisfactory size. When mature, they are about the same size as the Silver Maple, extremely colorful in fall and hardy in winter.
Acer schwedleri (Schwedler Maple)Red-purple leaf all spring, and green in summer. Attractive, easy to grow.
Betula papyrifera Marsh. (White Birch)When full-grown this is rarely over 80 feet in height or 2 feet in diameter. It does not provide dense shade. After 25 to 30 years it will succumb to a disease known as the “birch die-back.”
Gleditsia triacanthus inermis (Moraine Locust)Quick-growing shade tree. Thornless, seedless, storm-resistant, and hardy. Lacy foliage permits enough light to encourage lawn growth. Very good.
Ginkgo biloba (Ginkgo Tree)Quite nice. Slow growing. A native tree of Japan and China. There are separate male and female trees. The female has evil-smelling seeds, but it is impossible to foresee this nuisance; one must wait until the plant is 10 to 20 years old. Good specimens of this tree stand in the triangular plot in front of McGill University’s Art Building, and in the heart of downtown Boston. The clear yellow color in fall is very attractive; it is not a tree for small lots, although it is good for planting on a large lawn or along streets.
Picea abies L. (Norway Spruce)Good for Canada or northern U. S. A. Evergreen, consequently provides shade on a twelve-month basis. Quite colorful. However, the tree should not be placed too near a building, and it should be noted that it loses its attractiveness when oldsay, thirty years. The reason: just like most men it goes bald.
Syringa vulgaris (Lilac)Provides some shade. Has attractive pinkpurple flowers. Can be trimmed, so that it will grow up rather than sideways. (Possibly should be called a shrub.)
Sorbus L. (Mountain Ash)Dwarf tree, 20 feet high when mature. Yellow and red berries make it colorful. Often attacked by borers, which are liable to kill a beautiful tree quickly. For this reason, Dalsimer thinks it is quite poor.
Tilia americana L. (Basswood or Linden)Commonly 60 to 70 feet high, and 2 to 2L> feet in diameter when mature. European types better than American or Asiatic ones. Quite good, especially for street planting.
Malus coronaria L. Mill. (Siberian Crab Apple)Reaches to 30 feet, and is of a 2-foot diameter when mature. Sometimes known as “flowering crabs.” Attractive.
Fraxinus americana L. (White Ash)Reaches heights of 50 to 60 feet in open surroundings, and 100 to 120 feet in close stands. It is 2 to 3 feet thick when mature. Not very dense. Grows quickly from seed. Useful for shade and making baseball bats.
Quercus sp. (Oaks)There are many types of oaks, but the Red Oak is one of the most popular. It grows to 70 or 75 feet. Good for city environment. Fast-growing and easily transplantable, it reaches maturity in ten years or so.
Platanus acerifolia (London Plane Tree) and Platanus orientalis (Oriental Plane Tree)Excellent for rigorous city conditions and for salt-air breeze areas, trees grow to 85 or 100 feet. Emblem of New York City Park Department.
Pinus strobus (Eastern White Pine)A native tree that eventually grows to 100 feet on the average (although sometimes it reaches 175 feet), it transplants well when small. Reasonable in price. Hardy.
Elaeagnus angustifolia (Russian Olive)Grows to 20 feet. Very hardy, as it thrives well in a variety of soils, including sites near the ocean. The crooked trunk is covered with a brown shredding bark in the wintertime. Also has beautiful silver leaves.
Cormis florida (Flowering Dogwood)Reaches 40 feet on occasions. Has colorful berries in autunm, interesting branch shapes in winter, attractive flowers in spring, and clean leaves in summer. A good tree for street borders.
Liquidambar styraciflua (Sweet-Gum)Grows to 120 feet; it is scarlet- red in the fall. An excellent shade tree, it is also good for highway borders. Grass grows well under this tree.
Fagus grandifolia (American Beech)Grows to 85 feet. Native growing, although quite slow. Hardy, except in the city, where this is not suited for street trees. Long-lived.
Pynes ussuriensis (Ussurian Pear)Reaches almost 50 feet high. Hardy.
Very dense, narrow growth. Flowers are pinkish white.
Cellis laevigata (Sugar Hackberry)Grows to 90 feet. A native tree of the South, it is good there as a street shade tree.
Cercidiphyllumjaponicum (Katsura Tree)About 75 feet in height. Wide- spreading tree, but airy, loose leaves that make wonderful shade. Attractive.
Magnolia acuminata (Cucumber Tree)-Very wide-spreading branches that sometimes touch the ground. Good for shade purposes. Needs room to grow. Reaches to 85 feet in height.
Phellodendron aimirense (Amur Cork Tree)Fast-growing tree grows to 40 or 50 feet. Good for light shade, it has a nice character in winter because of its interesting branches.
Zelkova serrata (Japanese Zelkova)Good for shade; very’ similar in appearance to the elm, with wide-spreading branches. Another tree that almost reaches the 100-foot height mark, but usually does not quite make it.
Salix babylonica (Weeping Willow)Fairly fast-growing. Especially good
for boggy sites. Provides shade and beauty. Hardy. The branches are green when young and brown when mature. Foliage is green. Figure 120 shows such a tree in Woodmere, Long Island.
The trees should be placed in such positions that will provide the desired shade at various times of the day and year. Sun angles and azimuths, as described earlier in this chapter, are useful and necessary for determining this exactly. Planting should not be so dense as to interfere with the circulation of air around the building. Trees in large masses, as forests, tend to produce their own microclimates. Their value in the consideration of siting buildings is discussed in the chapters on temperature, wind, and precipitation.
Control of the sun by reflection takes into consideration the fact that reflection can occur on different surfaces of the earth and on artificial man-made surfaces. In the former there are several main surfaces to considerland, water, and snow. Land can vary considerably- insofar as the soil alone is concerned; countless variations are offered by different types of vegetation growing on its surface.
Reflection is expressed usually in a percentage form. By “reflection number,” “reflectivity” or “albedo” is understood the ratio of reflected radiation to the insolation. For example, a reflection number of 0.3, or 30%, indicates that a surface reflects 30% and absorbs 70% of the radiation which hits it. Geiger points out that according to Kir- choff’s law, the ratio of emissivity to absorptivity is constant for a given wave-length and temperature. If, therefore, a body has a high absorptivity and low reflectivity for a certain wave-length (as in the above example), it has high emissivity in the same range of wave-lengths. There are three spectral bands: ultraviolet (wave-lengths below 0.36 p), visible spectrum (wave-lengths 0.36 g to 0.76 /z), and long wave or infrared (wave-lengths 0.76 p to 100 p).
According to Geiger, who quoted other sources, here are reflection numbers of various surfaces, in the ultraviolet wave-lengths:
 Table 13.
Figure 120. Salix babylonica, Woodmere, Long Island.
snow 80-85% stone (gravel, granite, chalk) 22% dry dune sand 17% sandy beach 8-9% garden soil 6% dune heath 2%
The architectural import of this knowledge is that for certain building types, as hospitals, where ultraviolet rays are of particular benefit to the occupants, a snow cover surrounding the structure, on the ground or on overhangs, would be desirable. Here is yet another indication why sanatoria have for many years been placed at higher altitudes where snow is abundant. It has been remarked by Geiger that “Today, before building a clinic in hilly country, the microclimatic conditions would be investigated with a sunshine recorder.”
A contemporary example is Richard J. Neutra’s design for the Associazione Sanatoria Universitario Italiano (called SUI, for short) at Agra, Italy, looking down over beautiful Lake Maggiore. In the perspective, looking from the east, in Figure 121, the main entrance is in the middle, nurses’ residence on the left, and main building on the right. The latter wing contains classrooms, library, cultural director, kitchen, laundry, and service rooms on the two lower levels; patients’ rooms on the nine upper floors; and rooftop chapel and staff apartments at the top of the building. Near the main entrance wing are lounges, music rooms, auditorium, and a suite for the medical director.
Two main approaches to design are evident: the informal arrangement of the rooms, and the climatic considerations. Touching on the latter, complete meteorological records for the area were examined, so that the best site could be selected from the point-of-view of the sun and for quick and easy snow-removal (from the highways only) in winter, with the resulting economies and fine transportation to the building. Of course the snow on the surrounding hills would reflect a high percentage of the sun’s ultraviolet raysa large part of it towards the hospital itself. Figures 122 and 123 show, respectively, a south-facing two- patient room, with sun balcony beyond; and the rooftop chapel, opening to a southern terrace. Both are designed for maximum sun penetration for the occupants’ psychological and healthful benefits.
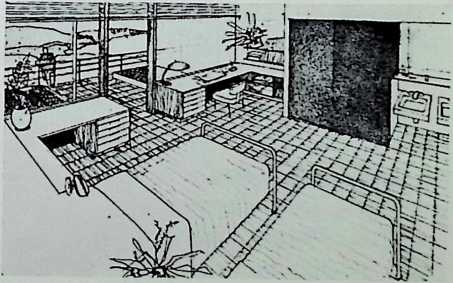
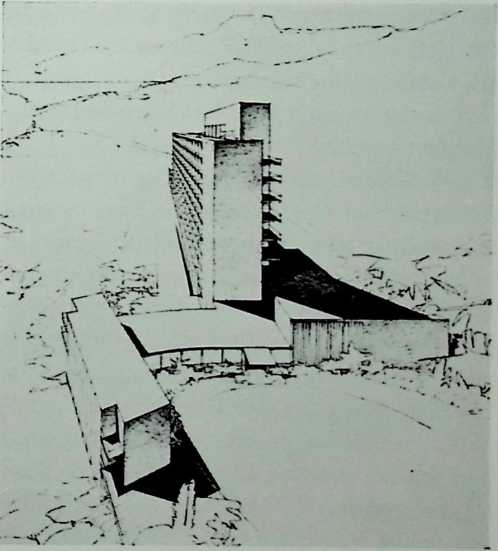
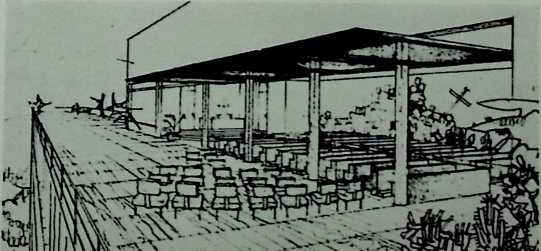
Figure 122 (below). South-facing two- patient room and sun balcony, Associazione Sanatoria Universitario Italiano.
Figure 121 (right). Associazione Sanatoria Universitario Italiano, Agra, Italy. Richard J. Neutra, architect.
Figure 123 (right). Rooftop chapel and southern terrace, Associazione Sanatoria Universitario Italiano.
Ultraviolet rays have powerful chemical effects. They are the cause of sunburn, among other things; and when these rays are cut off, as by smoke and fog in cities, people assume a pallid expression. Children, in fact, often get rickets as a result.
The reflection numbers of various surfaces for the visible portion of the spectrum, according to Geiger, are as follows:
Table 14.
fresh snow cover 80-85% older snow cover 42-70% fields, meadows, tilled soil 1 5-30% heath and sand 10-25% forests 5-18% surface of the sea 8-10%
An interesting point is that the albedo of moist surfaces is less than that of dry ones. If dry sand is moistened, it appears darker. (See Figure 124, the sand and ocean at Atlantic Beach, Long Island.) Wetting a surface around a building would thus reduce the visible reflection from 33% to 50%. Excessive light can thus be cut down.
The effect of underlighting a body with reflected light from another surface can be illustrated by the benefits derived when steep vineyards are placed alongside a lake. This supplies the plants with considerable additional radiation. The reception of additional radiation may also be effected by siting buildings on the shores of lakes. Geiger notes: … the west shores receive a noteworthy additional reflected radiation by the morning sun and the east shores by the evening sun. In this connection, the preference for a westward sloping shore is . . . mostly self-delusion; the western slopes are more often observed, because modern man is not an early riser by choice and seldom sees the eastern slopes in morning sunshine.”
There is the practice of covering roofs with a layer of water. The reflection from this, however, will not be the same as that for the surface of the sea or lakes, becausenf the difference in depth. Yet there is a value in such a device. It lies in the fact that it is an evaporating agent which induces cooling of the roof. Incidentally, where roofs are so designed it is important to keep the liquid in motion. Otherwise stagnation and the possible breeding of mosquitoes and other insects might be very objectionable. For a further discussion see page 147.
Regarding problems of big windows, especially those in hospitals and schools, Isadore Rosenfield says in the Journal of the Royal Architectural Institute of Canada: “The first problem is control of strong sunlight when it is not wanted. This is usually solved by pulling down the shade; however, this eliminates ventilation and plunges the room into darkness.
“A better way is to introduce a shelf outside over the window. (See Figure 125, illustrating similar requirements for classrooms.) It must be designed for the solstice in relation to height and depth of the
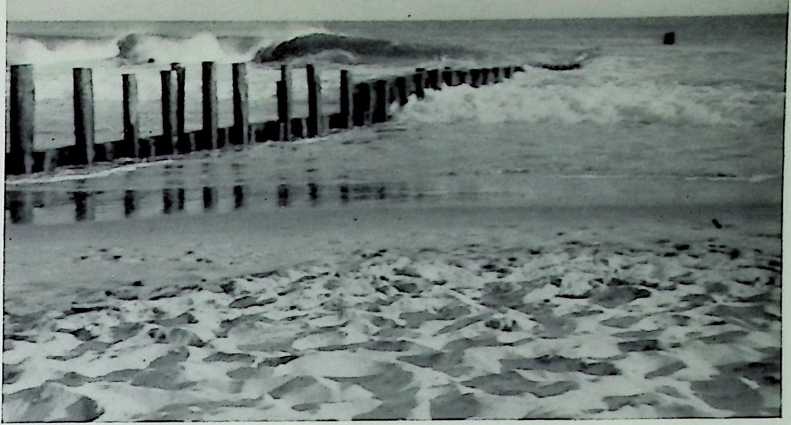
Figure 124. Atlantic Beach, Long Island.
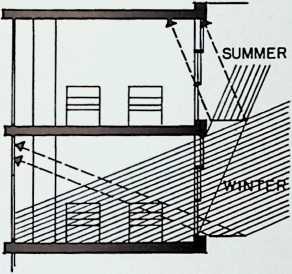
Figure 125 {left). Shelf used outside over window to protect classroom from summer sun. (.After Isadore Rosenfeld.)
room. The shelf should be of such projection as to permit sunlight to penetrate the room in the months of the year when it is wanted and to cut it off when it is not wanted. Venetian blinds would in a measure take care of this problem, but they are not favored because they collect dust.
“It is a mistake to try to solve the problems of all exposures with one device. Better results are obtainable if each exposure is analyzed separately, and treated accordingly . …
“One of the difficulties with the integral projecting sunshelf at the head of the window is that it involves the problem of drainage and leakage into the building at the juncture between shelf and wall or spandrel. In a current hospital design . . . the sunshades are independent shelves bracketed out some distance away from the building. In this manner not only are leaks through the wall obviated, but a freer movement of air along the face of the building is achieved.”
Nearly all surfaces in the long-wave (infrared) spectrum absorb almost all the radiation which strikes them. Geiger quotes the following reflection figures from Falckenberg:
Table 15.
light colored sand 11%
light gray limestone 8-9%
coarse gravel 8-9%
clods of earth with sod 2%
snow 0.5%
Hence, with the exception of a living vegetation cover, fresh fallen snow is the blackest body we know, as far as the infrared spectrum is concerned.
Infrared rays have considerable heating power and, unlike ultraviolet rays, are hardly disturbed by smoke. However, they are greatly affected by water vapor. Everything possible should be done to avoid the infrared rays in those areas where they may be objectionable, as these rays are considered to be the main cause of sunstroke and sun-exhaustion. Perhaps buildings should account for infrared rays in a manner similar to the way in which Sir Aldo Castellani advised Europeans to dress in the tropics (as related by C. E. P. Brooks in Climate in Everyday Life): “. … broad-brimmed pith helmets or topees covered with white or khaki cloth and lined internally with red, yellow or black. . . The effectiveness of the helmet is increased if a sheet of aluminum foil is moulded over the top, covered with a white cloth merely for appearance.”
A soil surface with a high index of reflection heats up by day much less than one with a high power of absorption. A complete discussion of this will be found in the chapter devoted to temperatures.
Control of the sun by insulating is a subject which really belongs within the realms of the heating engineer. The reader is therefore referred to the manual of the American Society of Heating and Ventilating Engineers for summaries of existing knowledge in this field. Comments on insulating walls with respect to winds will be found in Chapter 5.
Control of the sun by shape of materials requires that we look once again to nature for instruction and inspiration. It has a great many ways of protecting itself against excessive radiation. Here is what Geiger says: “The possibilities of avoiding excessive irradiation rest with the structure and position of the leaves. An example of this has been given by the case of the compass and gnomen plants. The profile position of their leaves in a sunny location (called the vertical position) results in the least possible surface area being offered to mid-day radiation. A rippled leaf surface hinders the whole leaf from receiving the maximum radiation no matter what the sun’s position. The albedo varies with changing leaf color. In the case of the cactus, the often too violent impact of radiation is partially broken by tufts of thorns which he parallel over the leaf surface, or felt-like cushions of a similar nature. …Of more interest perhaps to meteorologists is the variable fighting of leaves. By this we mean the ability of leaves to initiate variations in the radiation balance by means of movements of their leaf organs. There are leaves of certain living plants, which, after 15 minutes of irradiation by an electric heater, will assume their daytime sleeping position, in which by the action of their peculiar leaf joints, they are able to crease their surfaces and so lessen their effective heat-absorbing area. In their nighttime sleeping position too, the leaves stand almost vertically, perhaps in order to reduce nocturnal radiation losses.”
The architect may in consequence logically provide those sur
faces which receive a maximum of radiation with corrugated surfaces, such as of asbestos-cement, if he desires to cut down on the effects of this radiation. Corrugated asbestos-cement boards are found under different trade names, as: Transite, Asbestone, Careystone, Galbestos, etc. A detail of corrugated Transite is reproduced in Figure 126 through the courtesy of the Johns-Manville Company. Figure 127 shows this material used as the exterior wall finish of a dormitory at Black Mountain College, North Carolina; and Figure 128 indicates it as a roofing for a large Canadian packing house.
During many of the winter months in areas like Quebec the sun does not shine very much. Typically, one of McGill University’s janitors, an amateur weather “expert,” greets the students each morning during this period with the comment: “Dull day today.” And he is right. In the city there is little to relieve the drabness of the winter. There is no color anywhere, not even on the trees, most of which have shed their leaves.
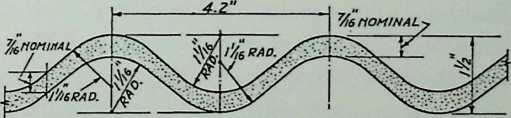 What can be done? Let us follow the example of the Egyptians, the Greeks and many other ancient civilizations which painted their buildings in bright colors. It will work; the “Shell-gas-station yellow,” beneath a cover of new fallen snow, has already proved to be one of the few effective touches of color in a big city’s winter. It is not to be interpreted that the colors should be overpowering, however. Intensive colors on the entire building are all right on the farm, where there is so much countryside for “background,” but they are unsuitable for the city. Instead, pastel shades, with bright hues serving only as accents, could be employed. This is the only relief for the dreariness of a city ■winter in Canada and in northern United States towns. We cannot do much about the drab sky or dirty snow, but we can replace the gray of stone buildings with a little sparkle in the form of color.
Figure 126 {right top). Corrugated Transite detail. Figure 127 (right bottom). Corrugated Transite exterior wall finish, dormitory at Black Mountain College, North Carolina. Figure 128 (below). Corrugated Transite roof, Canada.
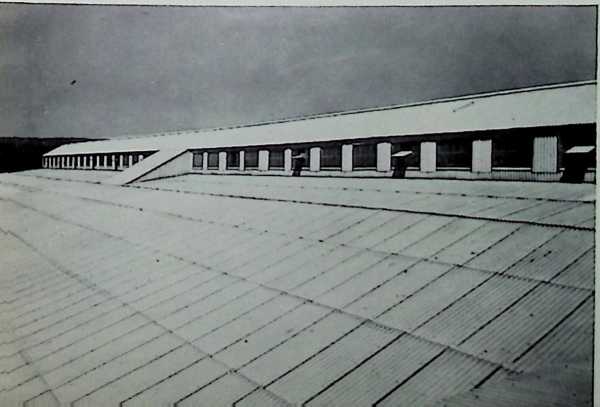
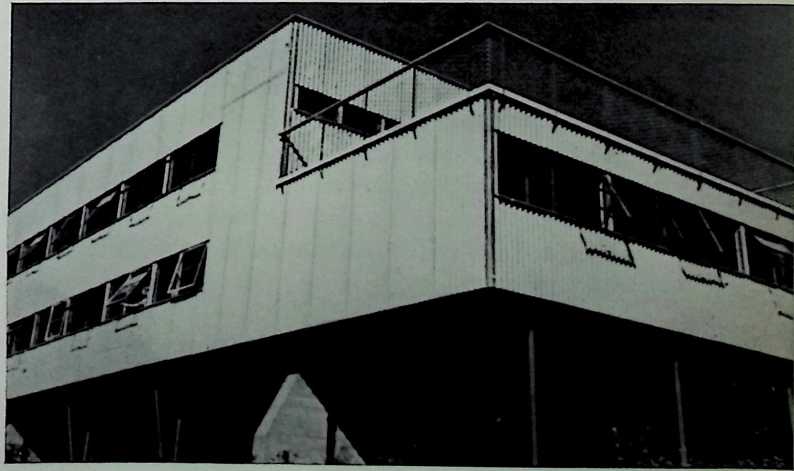
Even white buildings are better than gray ones. Here is what Lewis Mumford noted in Sticks and Stones, back in 1924: “Indeed, the whiteness of our colonial architecture is an essential characteristic; it dazzled Dickens on his first visit to America, and made him think that all the houses had been built only yesterday. The esthetic reason for delighting in these white colonial farmhouses is simple; white and white alone fully reflects the surrounding lights; white and white alone gives a pure blue or lavender shadow against the sunlight. At dawn, a white house is pale pink and turquoise; at high noon it is clear yellow and lavender-blue; in a ripe sunset it is orange and purple; in short, except on a gray day it is anything but white. . . Were anything needed to make visible the deterioration of American life which the nineteenth century brought with it, the habit of painting both wood and brick gray should perhaps be sufficient.”
The science of selecting colors has many aspects; much as been said on this subject by other authorities. Therefore, we shall not dwell longer on this subject, other than to say that climate should certainly influence the choice of colors in buildings.
¶ housing layouts
After the design of the building has been determined from the above, as well as by other airchitectural considerations, it is necessary for the architect to investigate the effect of the mass on adjoining structures and on the surrounding open spaces with regard to the sun.
Throughout the discussion it is perhaps wise to keep in mind Le Corbusier’s comments: “Les materiaux de 1’urbanisme sont le soleil, 1’espace, la verdure, 1’acier et le ciment, dans cet ordre et cette hierarchie.” Translated into English this becomes: “The materials of town planning are: the sun, the space, the vegetation, steel and concrete, in that precise order and subordination.” So strongly does Le Corbusier feel on this point that he continues: “Donner a chacunle benefice des joies essentiel- lessoleil, espace, verdure et personne n’a ose . . faire opposition a ce postulat.” This idea was approved by the C.I.A.M. (le Congres In- temationaux d’Architecture Moderne) in Athens, 1933.
It is convenient to consider the problem first in terms of winter conditions, recognizing that at other times of the year both the sweep of the sun and its angles of elevation are more generous. The British Building Research Board in its Postwar Building Studies No. 12 has an excellent analysis of this subject. We shall use their review as a basis for discussion.
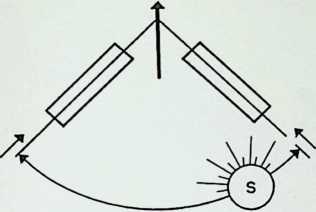 The first illustrations will be based on a simple rectangular plan. If the sun in winter performs a sweep of 90°,[7] then a plan of this type may be oriented with its axes lying north-east and south-west, or northwest and south-east, and the ground round about it will receive sunshine at some time of the day all year round. This will be clear from Figure 129. Any other orientation will result in a certain amount of shadowed area in winter. In Montreal, to receive sun around a simple rectangular building at some time of the day all year round (providing the sun is not obscured) the axes must be either N 55° 25 W to S 55° 25 E, or N 55° 25 E to S 55° 25 W. In New York, for similar results, the axes must be either N 58° 13 W to S 58° 13 E, or N 58° 13 E to S 58° 13 W. For axes concerning any other latitude, one should calculate the azimuth at sunrise or sunset (they would be the same) on December 22, from formulas previously given.
Figure 129
N
Concerning the best axes for Montreal and New York, just given, the first and third types would be the most satisfactory according to Walter Schwagenscheidt. He says: “. . . the north-north-west to south- south-east direction appears the more favourable in comparison with the usual north-south direction on building in lines, provided . . . that the living rooms are placed towards the west, the bedrooms towards the east.” Le Corbusier made good use of this principle in his design in 1940 for Les Maisons “Murondins” and for other buildings.
The more one proceeds toward the equator, the more east-west can a building be oriented in order to have a sweep of the sun completely around it during the day. However, in such locations one usually -wishes to avoid the sun. Thus, in Colombia, South America, which is almost on the equator, the long axes of most office and apartment buildings are oriented from north to south.
Orientation of this sort, with respect to radiation is evident in plants. Geiger comments on the experiments of H. Schanderl: . . the lettuce leaves in the lower half meter stand predominantly east and west, while the higher growing leaves are prevailingly north and south. The latter are protecting themselves mainly from the direct radiation of the sun; the former, more against the counter radiation of the west slope. This indicates . . . that the leaf position depends on the radiation climate of the particular location where the plant is growing. . . At the time of strongest radiation the plant presents the least possible surface to the sun.”
The shape and extent of the shadow is determined by the sweep of the sun and its maximum angle of elevation. If a building is of considerable height in comparison to its width, then the permanent winter- shadowed area will take the shape of a right-angle triangle, with the apex of the triangle being 90°. On the other hand, when the building is long and low, the light coming over the top of it at an angle of 15° will
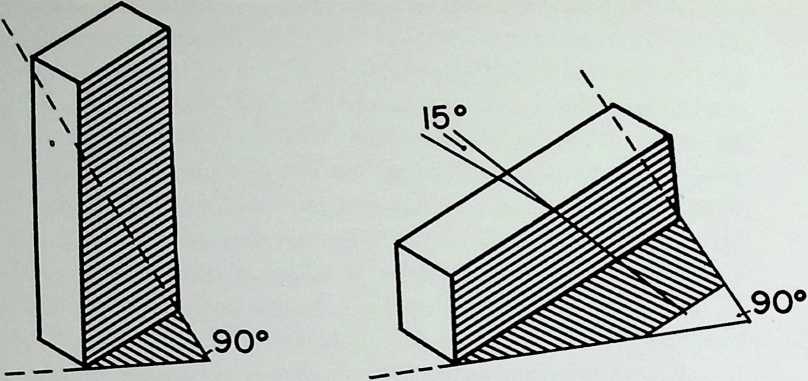
Figure 130
Figure 131
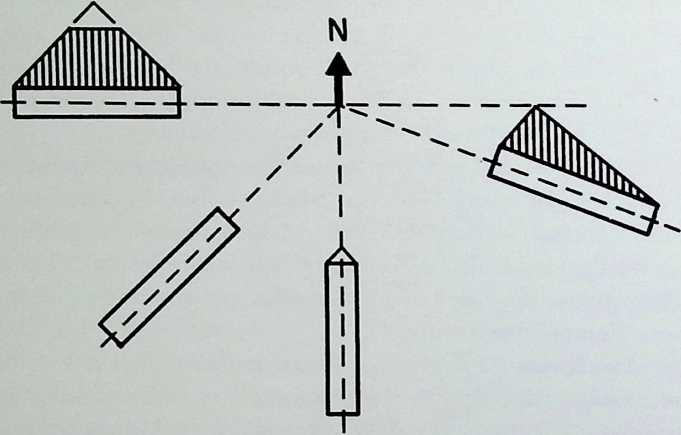
truncate the triangle. It will be evident that as the proportions of a building (as seen from the north) are altered from the horizontal to the vertical, the area which is shadowed in winter will become reduced. The extent of the reduction for a typical case can be judged from Figure 130.
The point may be illustrated another way, for where the aim is to keep the winter shadowing small, the major axis of general rectangular buildings should not lie much beyond a line running north-east and south-west, or north-west and south-east. Towards the east-west orientation, as seen in Figure 131, the proportions of the northerly facade become such that winter shadowing is developed to a maximum.
Some emphasis may be laid on the use of winter shadowing as a criterion for the insolation of the ground, not so much because winter conditions are the only ones that matter, but because it is more convenient to compare these “fixed” shadows than the transient ones which move across the ground. At the equinoxes, for instance, the sweep of
the sun being a full 180°, there will be no areas which do not receive sun around the simpler types of plan, and the basis of comparison becomes more complex.
Buildings of more complicated plan types may be examined for the most part as developments from the rectangle. Two or three rectangles may be put together in several variant forms, such as the L, the T, the U, and the cruciform. So far as the L, the T, and the U are concerned, they are best oriented south-east and north-west or south-west and north-east, when they will cause no winter shadowing. The cruciform arrangement is disadvantageous in this respect, as is the H-type plan. Any arrangement which involves a recess on a northerly face will result in shadowing, even up to the time of the equinoxes, and if the recess is deep enough, there will be an area which receives no sun at any time of the year, as indicated in one of the diagrams in Figure 132. Deep recesses on the northerly facades should be avoided if at all possible.
On the matter of the mutual shadowing of buildings it is deemed appropriate to include in its entirety the remarks and suggestions of the British Ministry of Works, as well as a photograph of some illustrations in their report.*
* Paragraph numbers and numbers of illustrations are here changed, to retain uniformity.
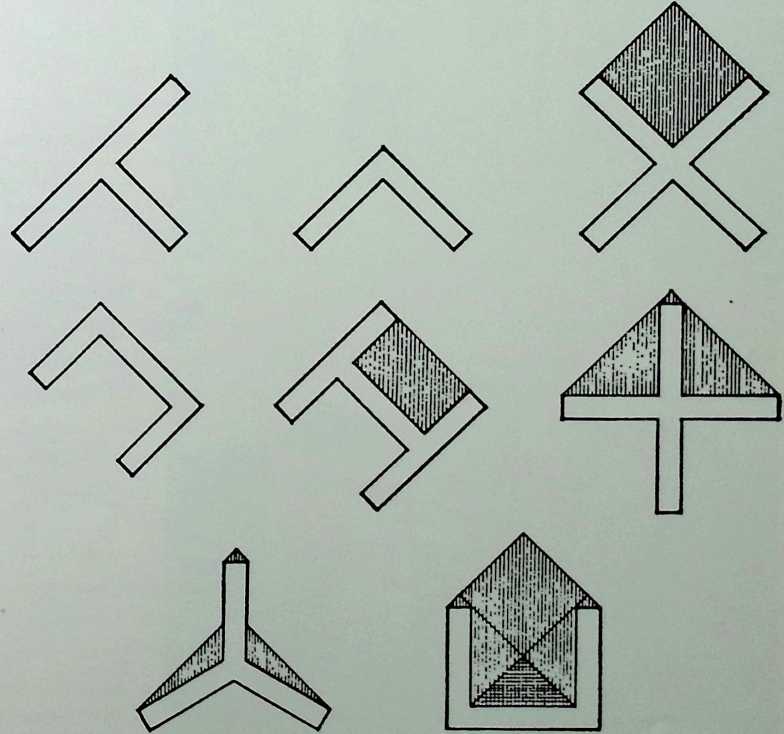
Figure 132
1
Figure 133. Winter sunlight on typical building shapes.
Figure 134. Winter sunlight on an alternative type of structure offering the same overall density. (Note the free insolation of the ground and buildings.)
Figure 135. Winter sunlight on an arrangement of buildings which was found appropriate for good daylighting. (Note how the broken shadow permits the insolation of lower storeys.)
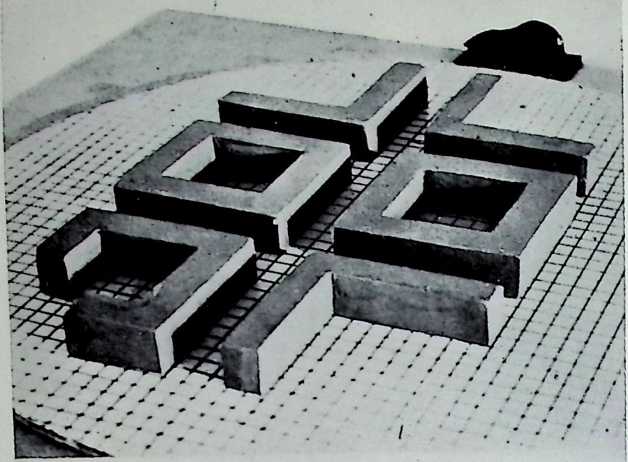
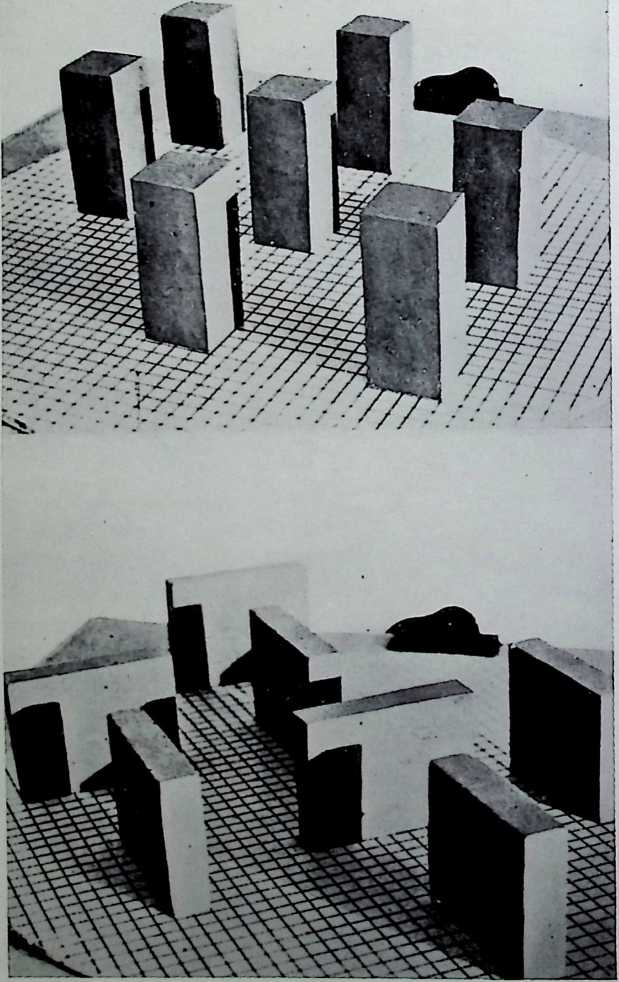
“1. It has been observed that the dominantly horizontal types of building cast more extensive winter shadows than do taller, more slender units, and it is to be expected, therefore, that where buildings of this type are grouped together, their shadows -will affect one another. The point may be illustrated by a photograph, Figure 133, of models on the Heliodon. The development is representative in general type and density of that which is found in our urban districts, except that the street proportions are rather more favourable than usual to sunlighting. It will be seen that the whole of the ground area between buildings is shadowed and also most of the lower storeys of the buildings, except at street junctions, where the sky-line is broken. Upper rooms are generally insolated. The photograph is taken for about hours before or after midday.
“2. If the hollow square units in this photograph are replaced by ones which are characteristically taller and more slender, the sunlighting is altogether altered. The ‘permanent’ winter shadows are small, and the transients narrow, so that shafts of sunshine break between the buildings and move across the ground. The storeys of neighbouring buildings then receive a sweep of sunlight, even if only for a limited period. This point is illustrated by a second photograph, Figure 134, in which the units have the same total bulk or floor space index as before and the same spacing centre to centre, yet it will be seen that much of the ground between them is sunlighted, and even the most obstructed buildings in the group are in sunshine at the lowest storeys.
“The photograph is obviously not a literal representation of a building type, but only an illustration of a point in principle.
“Figure 135 illustrates the same point for another arrangement of building, and though the ground is less well insolated the value of the broken shadow is readily apparent.
“It might also be recalled here that with buildings at right angles there are narrow limits to the suitable orientation and, if it is necessary to deviate from these, the sunlighting would need more careful consideration. It would probably be useful then to make the units lying at one angle lower than those at the other.
“3. In consideration of these factors we have come to the conclusion that as for daylighting, so also for sunlighting where high densities prevail, the development with the vertical characteristics and adequate spacing of units has advantages which the horizontal development does not possess, and we therefore recommend that they be taken into account as factors in site development and town planning.
“Another point maybe deduced from Figure 135. The total pattern of shadow tends to close up or clog when the shadows from individual units overlap. The clogging need not occur seriously, however, if the number of units is limited. It follows, then, that for a high overall density, local concentrations of accommodation would often give better results than distribution in many separate units.”
H. Myles Wright, in The Planners’ Notebook, gives adequate consideration to the problems of orienting for daylighting in these terms: “For adequate daylight in rooms, it is necessary to have a clear view of the sky from most normal positions within the room and not only from near the window. This view depends on the size and the position of the window and on external obstructions. A reasonable working rule is that there should be no continuous external obstruction which will increase the angle of light from sill level to more than 15-18 degrees. Light which passes sides of buildings or comes between them is valuable because it comes at a low angle and thus penetrates farther into a room, so that, where it is impossible to plan for an angle of obstruction of less than 18 degrees, a broken skyline caused by gaps in a line of buildings is better than an unbroken one. This arrangement can be systematized, particularly in the case of blocks of flats, and has been so used on the continent, both for lighting and securing longer views.
“The application of the requirement of a 15-18 degree angle of obstruction to ordinary two-storey housing shows that higher densities than those usually accepted can be satisfactory as regards daylighting. The obstruction presented by the roof has a marked effect on the spacing of blocks of houses. A 15-degree angle of obstruction subtended to table height at a depth of penetration of 15 feet, will require a distance of 73 ft. 6 in. between houses 16 ft. high to the eaves and with a 45-degree roof-pitch; with a 30-degree pitch the distance would be 52 ft. 6 in.; with a flat roof it would be 42 ft. 6 in… … Though these figures are satisfactory for fighting they may not permit provision of proper outdoor amenities for house occupants, and therefore show the unsoundness of basing any argument for low housing density on grounds of daylighting or any other single amenity.”
city planning
It has been stressed that the line of direction to follow in site planning is first to consider the sun, then to consider the emits of a building with respect to the sun, thirdly to consider the massing of the house with respect to the sun, other buildings, and open spaces, and finally to plan the streets around these structures. “The point is,” according to Whittick in The Small House To-Day and, To-Morrow, “that the best siting of houses is determined first, and it should not be beyond the ingenuity of the planner to arrange the roads accordingly.”
Writing in European Architecture in the Twentieth Century, Whittick remarks that Aluminum City, New Kensington, near Pittsburgh, Pennsylvania, designed for American war-workers by Walter Gropius and Marcel Breuer, is “sited irregularly according to the sun, and with complete disregard of any formal or geometric layout. They represent the culmination of twenty years’ progress in this matter.”
Figure 136 shows a view of Aluminum City Terrace and Figure 137 is a photograph of a model of the site plan. Gropius has told the writer that this project is an illustration of what has to be considered in
factors of climate and character of the land. He gives great importance to these factors, but notes that there are many and that they have to be studied carefully. He says that the southern exposure is always superior from the living point of view on account of the steep angle of the sun during the hot time of the year, but, if the buildings have to be put on rolling ground, the orientation of the buildings has to be adjusted, so the southern exposure cannot always be a one hundred per cent selection. Furthermore, he notes, the views from the house and the wind direction of the region in question have to be considered as well; and when all these factors are balanced out, an optimum is reached for that location. Gropius has also told the author: “I have always emphasized how wrong it is to call the contemporary approach in architecture ‘international.’ I call the international style all the imitation buildings with Greek columns which you find from Moscow, over London to Washington. These buildings are not indigenous, but built from borrowed elements. A contemporary approach from the local conditions is regional, not international. This is of importance. That the greater communication today from land to land and an internationalization of the technical means is progressing is only of secondary importance to the character of modern buildings.”
Concerning all cities, therefore, the placings of streets likewise should be governed by such natural positions as suggested by the arrangement of buildings.
Where there are long dominant arteries, the streets should be set out in some orientation between SE and SW. Harold MacLean Lewis reports on street planning in Planning the Modern City: “The amount of direct sunlight which will reach any building is obviously dependent upon the latitude of the locality, the direction and width of the street, and the height of the buildings. Rey (a French housing official writing in 1913) found that, to insure two hours of direct sunlight on the shortest day of the year, a street in Moscow running east and west and lined with buildings 21 meters high would have to be 105 meters or 344 feet wide, while in Washington a similar street with buildings of equal
Figure 136 {above). Aluminum City Terrace, New Kensington, Pennsylvania. Walter Gropius and Marcel Breuer, architects.
Figure 137 {below). Model of the site plan, Aluminum City Terrace.
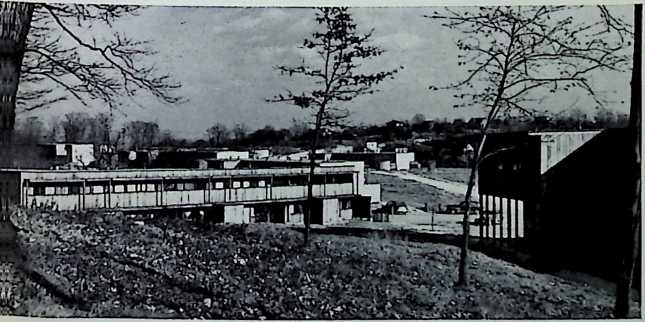
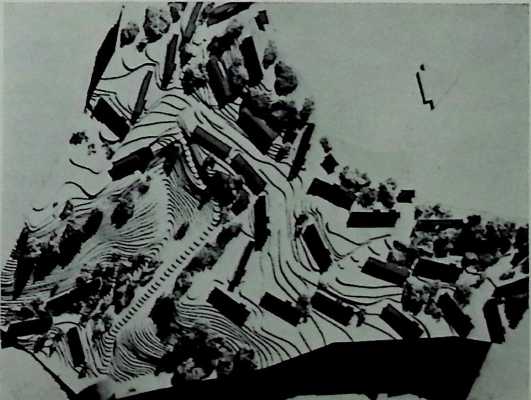
height would have three hours of direct sunlight if it were 42 meters or 138 feet wide. On a north and south street in Moscow, with buildings only- eight meters high, there would be one hour and five minutes of direct sunlight if the street were 12 meters or 39 feet wide, while in Washington there would be one hour and forty-five minutes of such direct light if the street were but eight meters or 26 feet wide. Similar computations were made for each of the cities for each of the three heights of buildings, and for streets running in four different directions.
“Some years later Rey’s studies appeared in a book prepared in collaboration with a Swiss astronomer and a Swiss architect. This contains a very complete set of diagrams for the latitude of Paris (48° 8). It was pointed out that the most sunlight is obtained on a southern exposure, but greatest heat from the sun is obtained on an approximately southwest exposure. This leads to the establishment of an axe heliother- mique, which becomes the basis for a city plan laid out on scientific sunlight principles. For the latitude of Paris this axis deviates 19° west of south. There is little variation in this deviation for any communities within the northern temperate regions. It is stated that the facades of buildings should front upon streets parallel with this axis. The available sunlight on buildings depends not only upon the width of the street, which should be a function of the latitude of the community and the height of buildings fronting on the streets, but also on the angle which the street forms with the meridian. All of these should be properly coordinated. Examples were given for a replanning of different sections of Paris to obtain the advantages of sunlight without changing the main street system.”
It is told that Confucius once said that one picture is worth a thousand words. Here is Le Corbusier’s one-picture analysis of the guide Figure 138 for city planning:
LE CORPS ST PfQT. ORCM.LEA
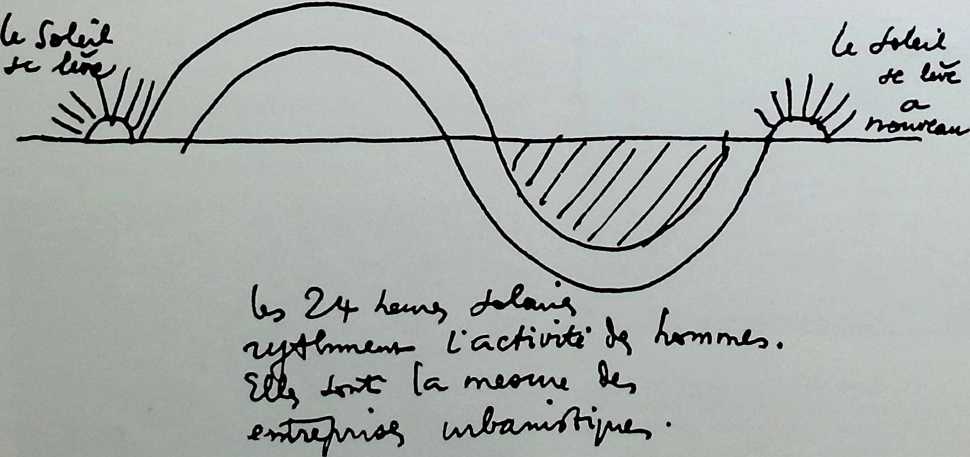
the rising sun
the sun rising again
the rising sun
the sun rising again
¶ TEMPERATURE
temper-a-ture (temper-a-tur), n. [L. temperatura due measure, proportion, temperament.] 1. Obs. a Constitution; temperament, b. Moderation; mildness. 2. Degree of hotness or coldness measured on a definite scale. 3. Med. The degree of heat, esp. of the human body; also, loosely, body heat above the normal, approximately 98.6°F.
¶ recording the temperature
“0 happy unown’d youths I your limbs can bear The scorching dog-star and the winter’s air, While the rich infant, nurs’d with care and pain Thirsts with each heat and coughs with every rain!”
Gay, Trivia, Bk. II.
The temperature of the air is determined by means of a thermometer. The type used in ordinary meteorological observations is the mercury- in-glass thermometer; the expansion of the mercury is proportionate to the increase in temperature and is measured by means of a scale engraved on the tube. Temperatures in the United States and Canada and most of the English-speaking world are usually given in Fahrenheit degrees, in which system the freezing point of water is at 32°F. and the boiling point of water is at 212°F. Most other countries employ the centigrade or Celsius thermometer; here the range between the freezing and boiling of water is divided into one hundred parts. Water freezes at 0°C. and boils at 100°C. An interval of 9°F. is equal to an interval of 5°C.[8] The absolute scale is also employed; here zero is at -273°C. However, as far as we are concerned, this is necessary only in certain branches of climatological work and shall not be discussed further here.
The thermometers used for experiments in this book were the 3" 1MM type, of range to °F. They were supplied through the courtesy of Professor W. Bruce of the Mechanical Engineering Department, McGill University. A photograph of one being calibrated against a standard thermometer is seen in Figure 139.
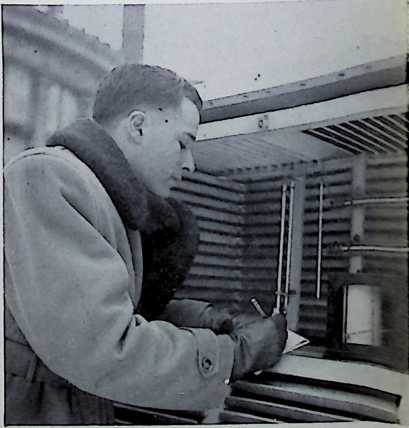 The maximum temperature of the air in a given period is recorded by means of a maximum thermometer. This is a mercury-in-glass thermometer in which the bore of the tube is reduced to a very small diameter about an inch above the bulb. The thermometer is hung nearly horizontally, -with the bulb end slightly lower than the other. When the temperature rises the mercury moves along the tube in the ordinary manner. But when the temperature again falls, although the mercury in the bulb contracts, the column of mercury in the tube does not pass back through the constricted part of the tube. Thus the maximum temperature attained remains recorded.
Figure 139. Thermometers in a Stevenson screen.
The minimum temperature of the air in a given period of time is recorded by means of a minimum thermometer. The liquid is spirit, just inside of which is immersed a small index. It is hung in the same way as the maximum thermometer. As the temperature falls, the index moves
towards the bulb with the spirit; when the temperature rises again from its lowest value the index keeps its position although the spirit expands and moves freely past.
Many complications are encountered when one attempts to make comparisons of different recorded air temperatures. The radiation from various heat sources, as the sun, the sky, the ground and other objects, greatly influences accurate recordings. The so-called “aspiration-thermometer” eliminates some of these difficulties; however, the results were found to be almost exactly the same if ordinary thermometers are sheltered in a Stevenson screen. The Stevenson screen is standard equipment at all meteorological stations in the United States, Canada, and most other countries. A photograph of it appears in Figure 139 at a level between 5 and feet. It is quite important to have this at a standard level to facilitate comparisons because of various temperature strata which shall be discussed in later paragraphs.
Continuous records of the temperature can be obtained by means of a thermograph. There are several kinds, but the most common is the bimetallic thermograph consisting of a bimetallic spiral which coils or uncoils as the temperature changes. One end of the coil is attached to a series of levers to which is connected a pen which records the temperature on a chart rolled on a cylindrical clock. Another type of thermograph is one where the bimetallic strip is replaced by a curved metallic tube filled with spirit (Bourdon tube). The curvature of the tube changes with changes of temperature; the change is recorded in a fashion similar to that in the bimetallic thermograph.
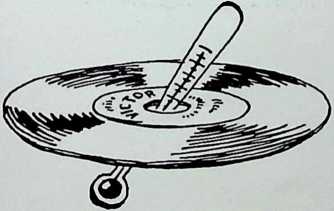 Architects can use these instruments to ascertain existing conditions at a given site. (These will not necessarily be the conditions after a structure is erected, due to microclimatic phenomena set up by the building itself.) The following precautions should be observed, however: Use a calibrated thermometer or thermograph. This can be arranged at the National Bureau of Standards, U. S. Department of Commerce, Washington, D. C., or the Standards Division, Department of Trade and Commerce, Ottawa, Ontario. When more than one instrument of the same type is used in order to obtain comparative data, it is extremely important that this point be observed.
The instruments should be placed at the same height above the ground in each case and should be well shielded from radiation by using a Stevenson screen, metal reflector (a tin can will do if the air can pass through) or other means. (See page 138 ff. for explanation.)
A number of readings should be made before even the most general deductions are attempted.
The long-term averages of various temperature data are here presented for the use of architects, heating engineers and other interested parties. Various comments are included in the discussion immediately preceding each set of statistics, and during the course of the chapter.
The 76-year mean temperature for McGill Observatory, Montreal, is -12.8OF. However, does this signify very much to the architect?
No. Let us study the temperatures, for example, at Princeton, British Columbia; Medicine Hat, Alberta; Ottawa, Ontario; and McGill Observatory.
The annual mean temperatures at all the above stations are approximately the same. However, the annual averages of extreme highest and lowest temperatures (i.e., averages of the highest temperature each year and averages of the lowest temperature each year for a number of years) are different, as seen in Table 16.
Table 16.
Station Annual Average of Extreme Highest Temperature Annual Average of Extreme Lowest Temperature
McGill Observatory 90°F. -187.
Ottawa, Ontario 93°F. ’F.
Medicine Hat, Alberta 99°F. ’F.
Princeton, British Columbia 97"F. -26’F.
Properly-designed houses in these various localities will not look the same, nor wiH the owner’s fuel bill. And yet the annual temperature averages are almost identical. Thus architects are cautioned not to rely too much on such figures but to analyze problems in the light of further temperature statistics.
The average annual temperature chart for the United States (period 1899) is shown in Figure 140. This map and succeeding maps in this section are reproduced through the courtesy of the Weather Bureau, United States Department of Commerce.
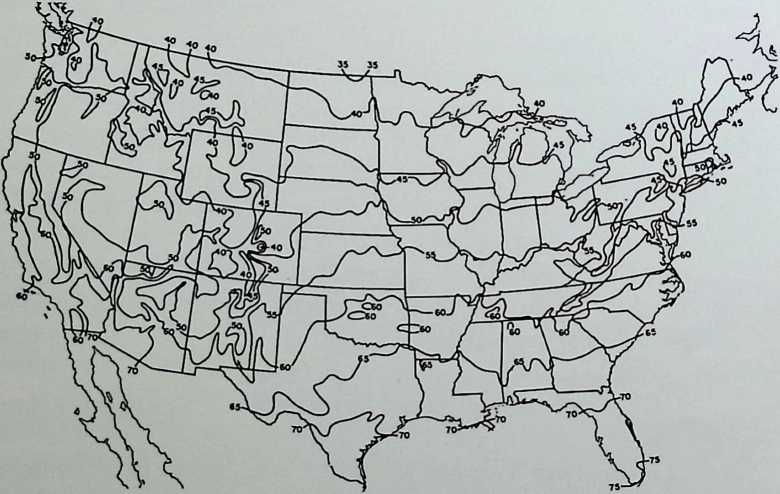
Figure 140. Average annual temperature.
These are averages of maximum temperatures recorded every day in a particular month for a number of years. For example, in March there are 31 maxima of temperature, one for each day. In 30 March’s there are 31 X 30 or 930 such maxima. The average value of all these
Table 17.


 JAN. FEB. MAR. APR. MAY JUNE JULY AUG. SEPT. OCT. NOV. DEC YEAR
21.7 22.9 33.2 49.3 64.2 73.6 78.1 75.4 66.6 54.1 39.5 26.1 51.3
Table 18.
JAN. FEB. MAR. APR. MAY JUNE JULY AUG. SEPT. OCT. NOV. DEC. YEAR
5.6 7.9 19.4 33.6 46.3 56.3 61.5 59.2 51.2 40.2 28.1 13.2 36.6
is the average daily maximum temperature for March for 30 years.
As an example, the figures for McGill Observatory for 76 years are shown in Table 17. They represent the maximum temperature that should be expected about the middle of each month at that station.
This, as well as extreme monthly temperatures and extreme temperatures on record, is the type of temperature information that architects and engineers are usually concerned with.
These are monthly averages of minimum temperatures recorded in the same manner indicated under “Monthly Averages of Daily Maximum Temperature.”
The figures in Table 18 are again for McGill Observatory, Montreal, taken over a period of 76 years, and they represent the minimum temperatures we should expect about the middle of each month, at that station.
If such figures are not already available in published form[9] for a district in which one contemplates building, one can easily abstract them from local weather bureau records.
The daily mean temperature is equal to the sum of 24 hourly temperatures divided by 24. The daily mean temperature is also close to the figure obtained by taking the sum of the daily maximum and minimum temperatures and dividing by two. The Meteorological Division of the Department of Transport, Canada, uses this method.
In a January there are 31 such daily mean temperatures. In 30 January’s there are 31 X 30, or 930 such daily mean temperatures. The average of these 930 daily mean temperatures represents the monthly average of daily mean temperature taken over a period of 30 years.
For McGill Observatory, Montreal, taken over 76 years the monthly averages of daily mean temperature are, for example:
Table 19.
JAN. FEB. MAR. APR. MAY JUNE JULY AUG. SEPT. OCT. NOV. DEC. YEAR
13.9 15.6 26.5 41.2 55.2 64.9 69.5 67.2 59.0 47.4 33.8 19.8 42.8
Here again, not too much stress should be laid by architects on such figures. But, as will be noted from the Montreal example, the extreme temperatures are prone to occur in the months of January and July, rather than in December and June, the months of the solstices. This is because there is a time lag regarding the response of the earth to the thermal influences of the sun.
For the United States, therefore, we may remark the average January temperature and average July temperature, for what value there may be in knowing them. (See Figures 141 and 142.)
Below are averages of the extreme highest monthly temperatures in a particular month over a period of years. For example, in January there is one extreme high temperature. In 30 January’s there are 30 extreme high temperatures. The mean of these 30 extreme high temperatures represents the average of the extreme highest monthly temperature for a period of 30 years.
 This has very little architectural significance. The highest April temperature is more likely to occur at the end than at the beginning of the month, for example, but in this type of analysis it appears to cover the entire 30 days. At McGill Observatory, Montreal, for example, the 69-year averages of extreme highest monthly temperatures are given in Table 20.
Table 20.
JAN. FEB. MAR. APR. MAY JUNE JULY AUG. SEPT. OCT. NOV. DEC. YEAR
42 41 49 70 81 86 89 87 82 71 58 45 90
 Below are averages of the lowest temperatures in a particular month over a period of years, recorded in the same fashion as averages of extreme highest monthly temperatures.
For McGill Observatory, Montreal, 69-year averages are:
Table 21.
JAN. FEB. MAR. APR. MAY JUNE JULY AUG. SEPT. OCT. NOV. DEC. YEAR
-16 -12 19 34 45 52 49 38 27 9 -10 -18
Figure 141. Average January tepmera- ture.
Figure 142. Average July temperature.
Figure 143. Average annual maximum temperature.
s
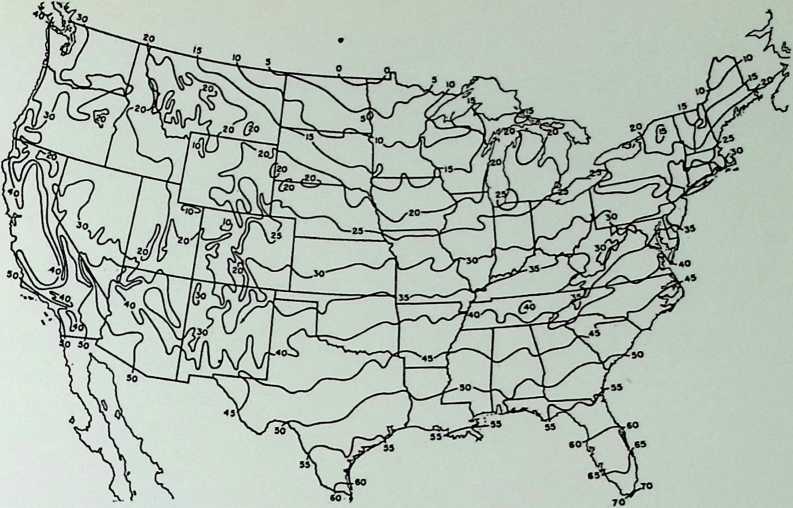
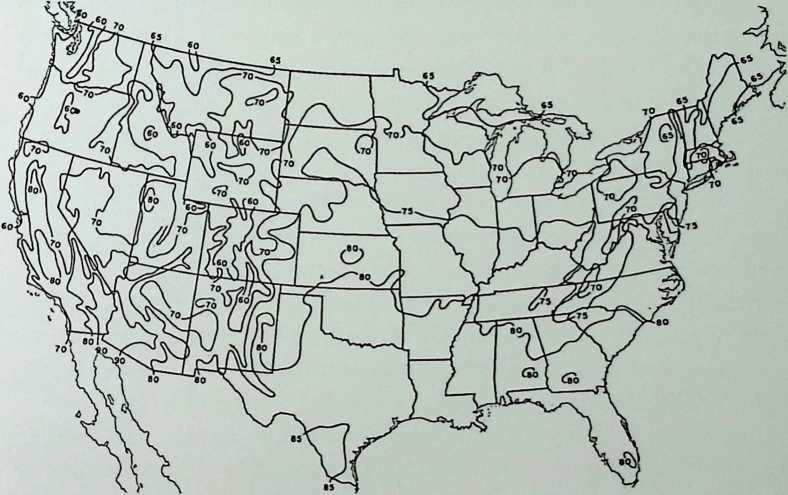
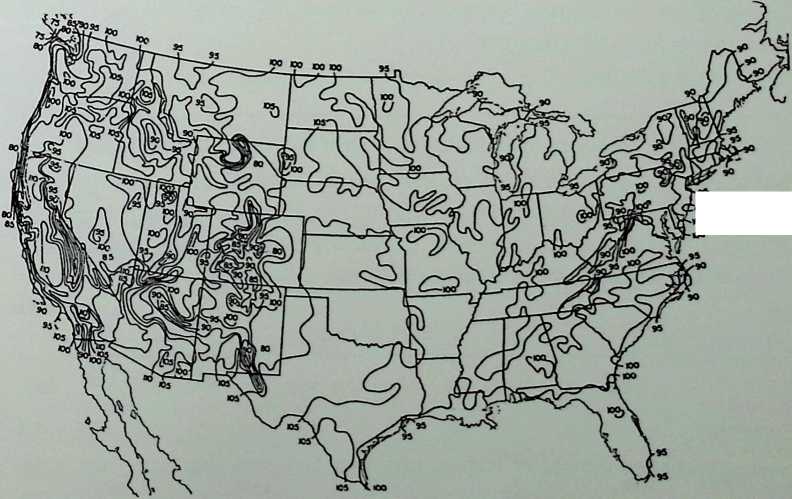
Figure 144. Average annual minimum temperature.
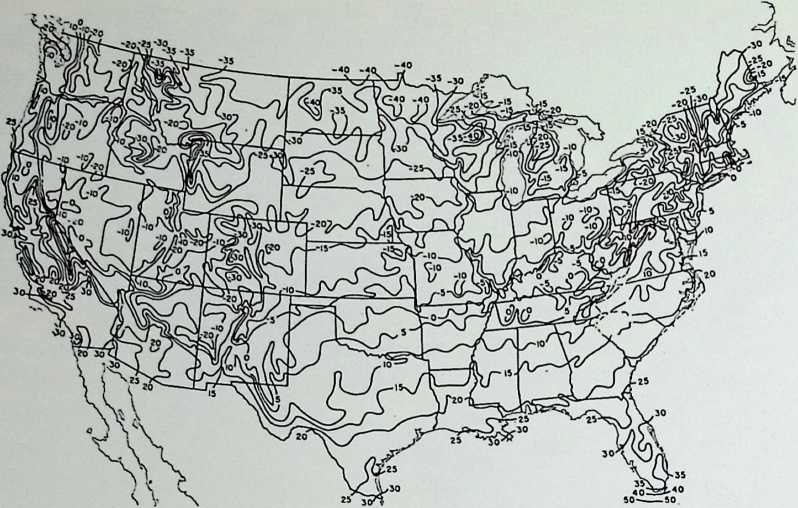
The maximum temperatures ever recorded in particular months are perhaps useful in determining maximum temperature stresses that a building or equipment might undergo in a particular month. It might be advisable in some cases to add a safety factor of, say, 5 degrees. Table 22 shows sample figures, as observed at McGill University, Montreal, over a period of 76 years.
 Monthly minimum temperatures on record are possibly useful in determining minimum temperatures that buildings or equipment might undergo in a particular month. A safety factor of, say, 5 degrees, may be subtracted, if desired, to account for the possible occurrence of any further unusual circumstance of this nature. Table 23 shows sample figures, as observed at McGill Observatory, Montreal, over a 76-year period.
The maximum temperature recorded -will logically be the maximum of the monthly maximum temperatures on record. It is possibly useful in determining the maximum temperature that a building or equipment is liable to undergo. It may be desirable to add a safety factor of, say, 5 degrees, as in the other cases, to provide for any future record-breaking temperature.
Table 22.*
| JAN. FEB. | MAR. | APR. | MAY | JUNE | JULY | AUG. | SEPT. | OCT. | NOV. | DEC | |
| temperature | 54.6 48.2 | 77.2 | 85.7 | 91.2 | 93.6 | 97.0 | 95.8 | 90.3 | 84.1 | 71.6 | 59.1 |
| year occurred | 1950 1880 | 1945 | 1941 | 1929 | 1925 | 1931 | 1917 | 1898 | 1949 | 1950 | 1901 |
| JAN. FEB. | MAR. | APR. | MAY | JUNE | JULY | AUG. | SEPT. | OCT. | NOV. | DEC. | |
| temperature | -27.1 -27.4 | -17.1 | 2.0 | 22.9 | 33.9 | 45.6 | 43.3 | 32.1 | 19.2 | -5.5 | -29.4 |
| year recorded | 1914 1943 | 1950 | 1923 | 1880 | 1945 | 1881 | 1903 1913 |
1914 | 1933 | 1881 | 1933 |
* Information through the courtesy of Richmond W. Longley.

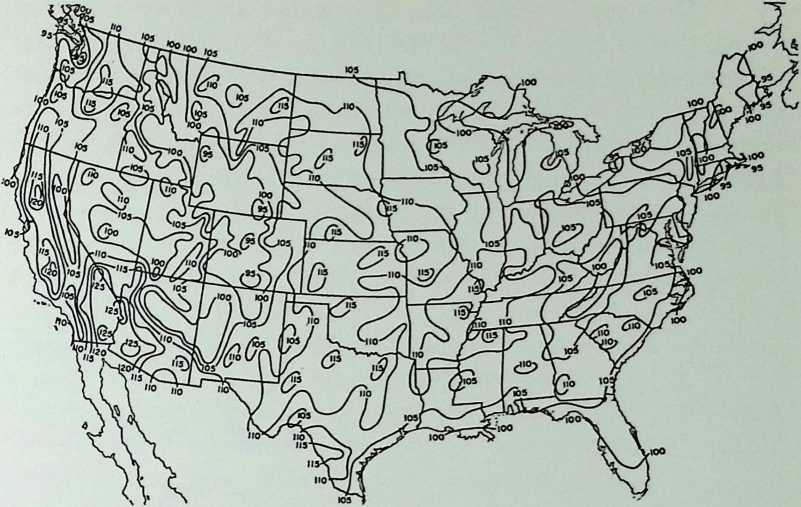
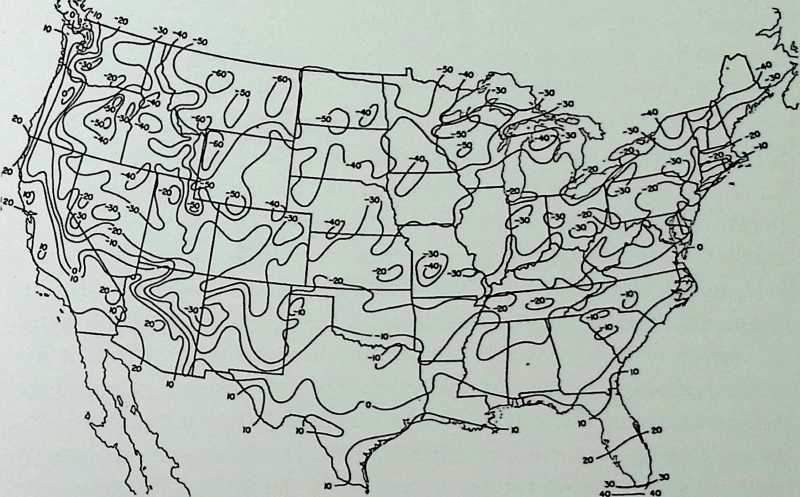 Maximum temperature isotherms for the United States are indicated in Figure 145.
Figure 145. Highest temperatures ever observed.
Figure 146. Lowest temperatures ever observed.
The minimum temperature recorded will logically be the minimum of the monthly minimum temperatures on record. It is possibly useful in determining the minimum temperature that a building or equipment is liable to undergo. It may be desirable to subtract a safety factor of, say, 5 degrees, as in the other cases, to provide for a future low temperature.
Minimum temperature isotherms for the United States are indicated in Figure 146.
The average diurnal cycle of temperatures are the averages of temperatures taken each hour, each month, for a period of years. For example, there are 31 noons in January. In 30 years there would be 30 X 31, or 930 noons. The average of these 930 temperatures would be the average noon temperature for January, over a period of 30 years.
 The sample averages here, however, were taken over a five-year period, that of 1946 to 1950 in Montreal. As McGill Observatory takes temperatures at two-hour intervals, there are only twelve readings per day, beginning at 1:00 a.m. and terminating at 11:00 p.m. In 31 days there would be 12 X 31, or 372 readings. In 5 years, 5 X 372, or 1860 figures, would be recorded. Such information is adequate for obtaining satisfactory averages for a particular month.
Compilation of the statistics for twelve months necessitated the abstraction of 20,902 temperature readings; 1440 sets of arithmetical computations were required before complete information could be presented for a twelve-month period.
All figures represent dry air shade temperatures. The average freeze-thaw cycle in winter and the night-day range in summer are particularly interesting points for architects to observe.
It may also be desirable to know, under certain circumstances, the average number of days when the temperature at a given location exceeded a certain arbitrary figure, say, 86°F., or failed to reach another arbitrary figure, say, 32°F. If this information is not readily available in published or manuscript form, one can obtain such data in a very short time by abstracting the information from local records.
Many heating engineers, as well as architects, would find it useful to know, on certain occasions, the average or probable maximum length of heat or cold waves. Therefore, in the course of gathering temperature data, such information might be gathered. The data may be tabulated statistically or more informally, as is this sample for Montreal, noted by McGill Observatory Director Hare: “In winter, not infrequently the temperature stays below 0°F. for a length of 48 hours. A stretch of 4 days at this temperature is exceptional; in fact, it has never happened in the last five years. The only instance of prevailing temperatures of this sort, as far as I can recall, was in the period between Boxing Day and December 31, 1933. In summer not infrequently will maximum temperatures exceed 90°F. for 3 days consecutively, though the peculiar conditions of Montreal’s site prevent temperatures rising above 95°F., except on the rarest of occasions. This great heat is accompanied by high humidities and minimum temperatures remain between 70° and 75°. Such conditions approach the equatorial.”
 Information concerning the average dates of last and first frost can be used for a variety of purposes, although one should not ignore figures of the latest and earliest froststhe extreme datesas recorded for the vicinity one is considering. Figure 148 shows the average dates of the last killing frost in spring, and Figure 149 indicates the average dates of the first killing frost in fall, in isoline form for the United States. Extremes, at least as indicated for the Montreal area and a few other districts, can be calculated roughly as being three weeks later than the dates given for the last frost and three weeks earlier than the dates given for the first frost. Of course microclimatic conditions will often influence the accumulation of frosts and their accompanying dates: country terrain
Figure 147. Diurnal cycle of temperature for July at McGill Observatory.
Figure 149 (below)
Figure 148 (above)
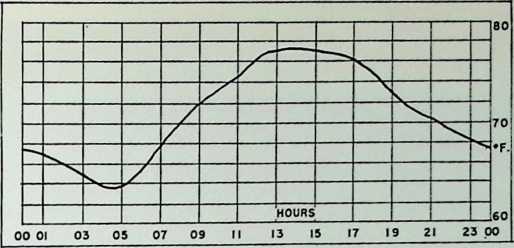
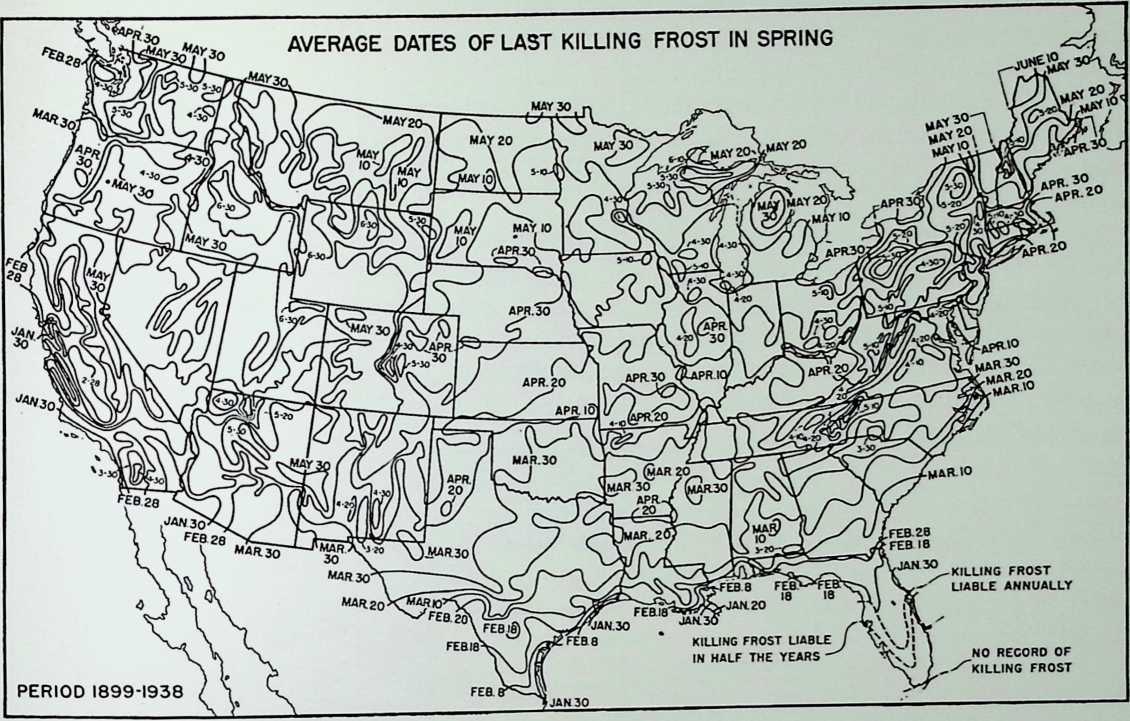
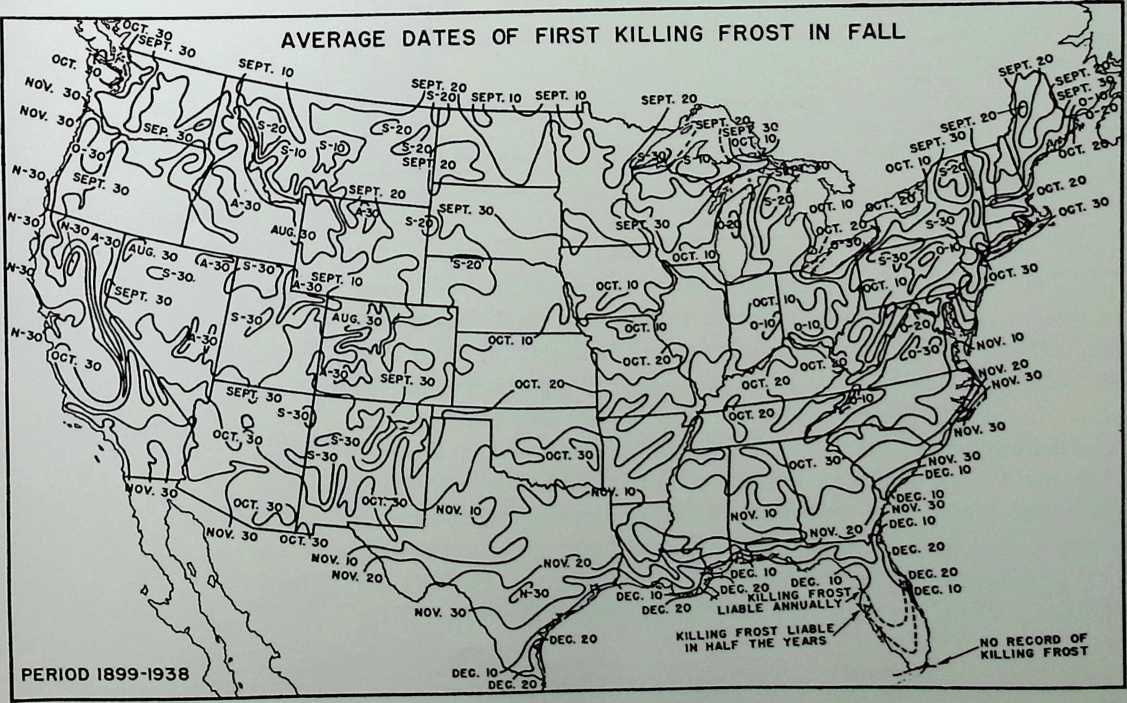
may induce frost formation in border periods, whereas city heat may prevent them. This will be discussed in detail in later paragraphs.
In the words of Geiger, in “a day with frost change . . . the temperature curve . . . passes the freezing point one or several times . . .; if the temperature passes from positive to negative this process is connected with an explosive effect; changing from negative to positive is the condition for freezing again. Number of frost changes is the number of passages through the freezing point.”
These figures will indicate to architects those periods when weathering due to freeze-thaw action is probably the most severe. Appropriate measures for relief of such deterioration must therefore be taken during these months. This ■will be discussed elsewhere.
Calculated by the author according to the above-outlined Geiger method, the McGill Observatory five and ten-year averages are here presented as examples. The two sets of averages indicate variances due to different time periods. The ten-year average in this case, however, is recommended as the more reliable. In either case, the maximum number of frost changes usually occurs in the month of March, insofar as the district of Montreal is concerned.
Table 24.
Average Number of Frost Changes Per Month (McGill Observatory)
**Five-Year Average 1946-1950** **Ten-Year Average 1941-1950 (recommended)**
January 11.0 8.5
February 8.4 10.6
March 21.4 22.8
April 15.6 16.0
May 1.2 1.0
June
July
August
September
October 2.4 3.9
November 18.0 16.7
December 13.2 10.8
The depth of frost penetration varies each season and in different situations. It is important for architects to know frost depths, as building foundations must go below the frost-line to obtain stability. Also, it is advisable that underground services, carried by pipes and ducts, be placed below the freezing level in the earth. In fact, this latter problem has commanded the attention of Mr. Frank V. Dowd, Assistant Director of Public Works, in charge of the Waterworks and Sewerage Division, City of Montreal. Since 1932 depth of frost penetration profiles for each winter season, made from observations taken during the course of work in his department, have been prepared under his direction. Four of these charts are shown in Figure 150. The “X” marks which lie outside of the
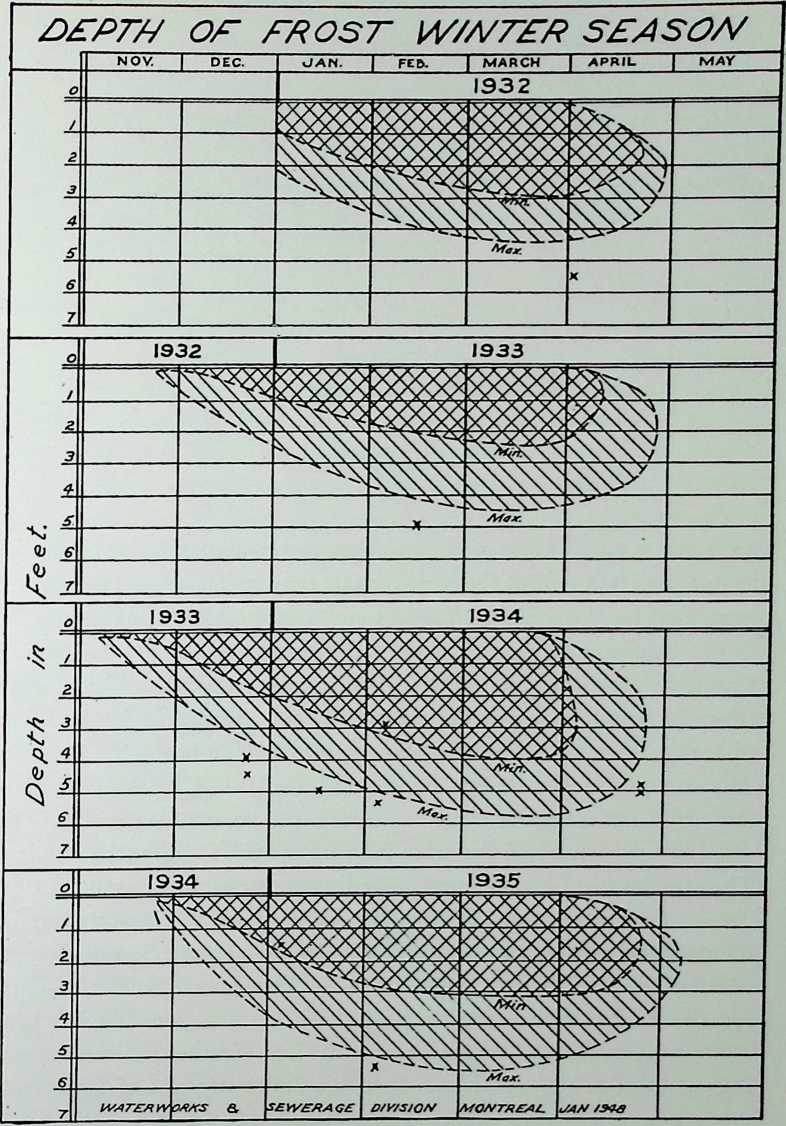
Figure 150. 0 = Surface of ground or pavement. Charts prepared by Waterworks and Sewerage Division, City of Montreal. Frank V. Dowd, Assistant Director of Public Works.
main curves were individual cases of deep frost that did not represent general conditions.
Dowd notes, incidentally, that this information was of considerable interest in the course of designing runways for Dorval Airport, Montreal, and it has been used for many other purposes as well.
Average frost penetration depth for the United States is shown on the weather bureau map reproduced as Figure 151.
Dowd has also prepared a very interesting cross-section of typical frost conditions below and adjoining city streets. Figure 152 indicates that the depth of frost tends to be much greater under the streets than under the neighboring sidewalks and gardens. This is because the high-
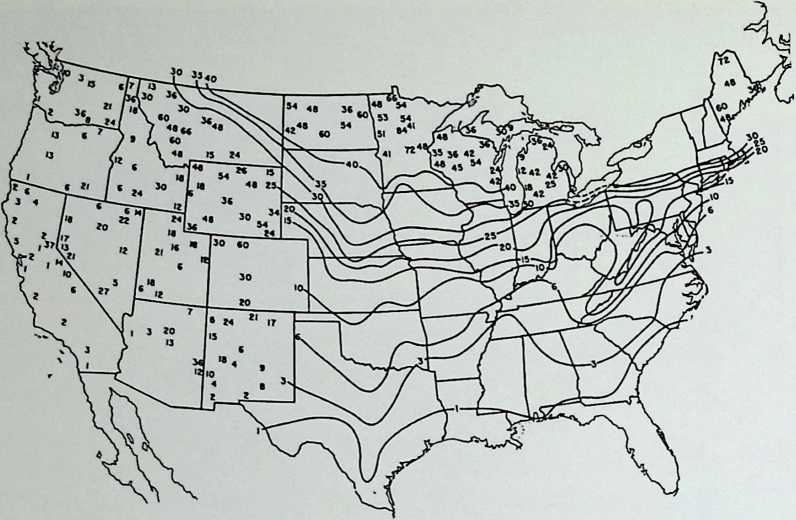
Figure 151. Average depth of frost penetration in inches.
ways are usually kept snow-free; thus the insulating value of snow is lost at such points. But the snow blanket near the houses and the warmth generated by the buildings prevent any deep frost occurring there.
A degree-day exists for every degree that the mean daily temperature is below a certain standard. This standard varies in different countries. In countries using Fahrenheit degrees, one degree-day is defined as a day on which the mean temperature is 1°F. below the standard. The standard in the United States and Canada is 65°F., and in England it is 60°F. In countries using centigrade degrees, one degree-day is defined as a day on which the mean temperature is 1°C. below the standard. The standard in Germany and other European countries is usually 19°C.
Degree-days are frequently used to determine heating requirements. Statistics for Canada are obtainable from the Air Services Branch, Meteorological Division, Department of Transport, Toronto. Statistics for the United States are published monthly and annually in “Local Climatological Data,” available for each U. S. Weather Bureau Meteorological Station and obtainable from the Superintendent of Documents, Government Printing Office, Washington 25, D. C. (Subscription: 50^ per year, including annual summary. Separate copies: for monthly edition, 10 $5 for annual edition.)
Figure 152. Cross section of typical frost conditions below and adjoining city streets. Prepared by Frank V. Dowd. Irregular curved line below grade represents extent of frost in given conditions.
Low and high temperatures are very often liable to occur when winds approach from a certain direction. This can appear as a result of macroclimatic phenomena or microclimatic phenomena.
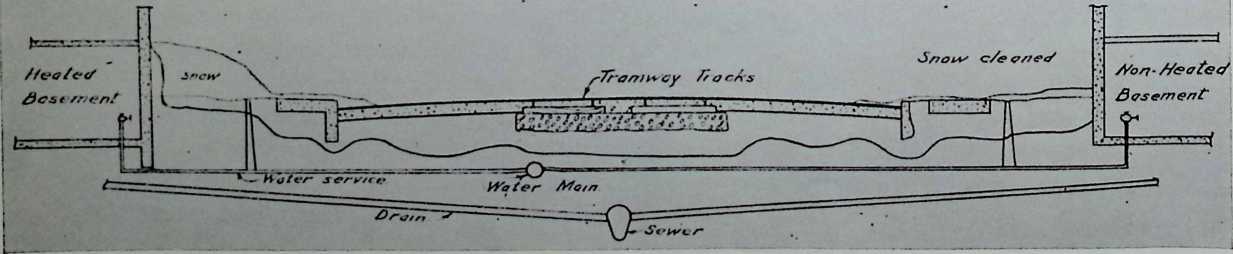
Table 25. December 24-27,1950
Date Time Temperature Wind Direction Wind Speed mph
Dec. 24 2100 hrs. 19.7 SW 15
2300 11.8 SSW 8
Dec. 25 0100 8.3 S 6
0300 5.8 SSE 6
0500 3.5 S 4
0700 -0.3 s 3
0900 -0.3 s 2
1100 1.5 s 5
1300 2.2 SW 8
1500 2.0 w 7
1700 0.7 SW 6
1900 -2.4 SW 7
2100 -4.2 SW 5
2300 -5.3 SW 6
Dec. 26 0100 -8.5 w 6
0300 -9.3 w 4
0500 -11.3 NW 4
0700 -12.2 NW 6
0900 -11.2 NW 7
1100 -11.0 NW 7
1300 -74 W 7
1500 -7.5 SW 4
1700 -9.2 wsw 12
1900 -10.2 w 11
2100 -10.9 WNW 8
2300 -11.1 SW 3
Dec. 27 0100 -11.4 w 4
0300 -11.8 WNW 3
0500 -12.5 WNW 1
0700 -12.0 WNW 12
0900 -97 SW 6
1100 -2.6 SW 6
Table 26. December 24,1933
Date Time Temperature Wind Direction Wind Speed mph
Dec. 24 0700 hrs. 13.0 N 12
1900 16.0 NE 14
Dec. 25 0700 3.1 W 12
1900 24 W 6
Dec. 26 0700 -7.0 NE 14
1300 -8.1 NE 24
1900 -3.4 NE 25
Dec 27 0700 ** NW 10
1900 10.4 NW 11
Dec 28 0700 3.3 SW 10
1900 -14.3 NW 10
Dec 29 0700 -29.3 NW 18
1900 -26.4 NW 25
Dec 30 0700 -19.8 NW 12
1900 -18.2 NW 16
Dec 31 0700 -8.0 N 7
1900 5.8 NW 12
Figures for the macroclimatic-induced temperatures and winds are difficult to present in the form of averages. Hare suggests that illustrations of occurrences on a selection of dates is the only satisfactory manner. For example, see Table 25 for some Montreal figures.
Let us examine now the figures in Table 26.
105
25
HOD
1300
DEGREE
1444
1200
IO9B
• 00
too
>00
122 MOST 58 AVER
641 MOST
518 AVER.
370 LEAST
0.1 <4.2
MONTHLY TOTALS OF AVERAGES ANO EXTREMES
TOTAL NUMBER OF DEGREES THE DAILY MEAN FALLS BELOW GS’F
Figure 153
**JAN** **MAR** **APR** **MAY** **JUNE**
RANGE AND DISTRIBUTION OF TEMPERATURES
PROPORTION OF TOTAL AREA IN EACH ZONE INDICATES
PERCENT OF TIME TEMPERATURES ARE IN THAT ZONE
31.1
3 9
59.2 181
COLD
A)VERY COLD
AVERAGE
AND COLD
DAYS
6.4
3.7
55.7
36.
32.8
47.3
23.5
9.9
64.5
58.9
8.5
31.1
39.9
<8.7
49.1
66.0
54.4
49.4
35.7
67.7
AIR
TEMPERATURE
1.4 • TOTAL PERCENT OF DRY AIR TEMPERATURES FOR GIVEN ZONE
■3- TOTAL PERCENT OF DEW POINT TEMPERATURES FOR GIVEN ZONE
5.0
9.7
5.1
12.3
DATE OF LAST KILLING FROST IN THE SPRING BETWEEN MARCH 20 - MAY 25
DATE OF FIRST KILLING FROST IN THE AUTUMN
BETWEEN SEPT 20 - NOV. 23
LONGEST GROWING SEASON- 232 OAYS
SHORTEST GROWING SEASON- 137 DAYS
 **1511 MOST**
 **1262 AVER**      **7\*\***
 **878 LEAST**
780
MOST
AVER
1080 MOST 886 AVER.
510 LEAST
401 MOST
252 AVER.
117 LEAST
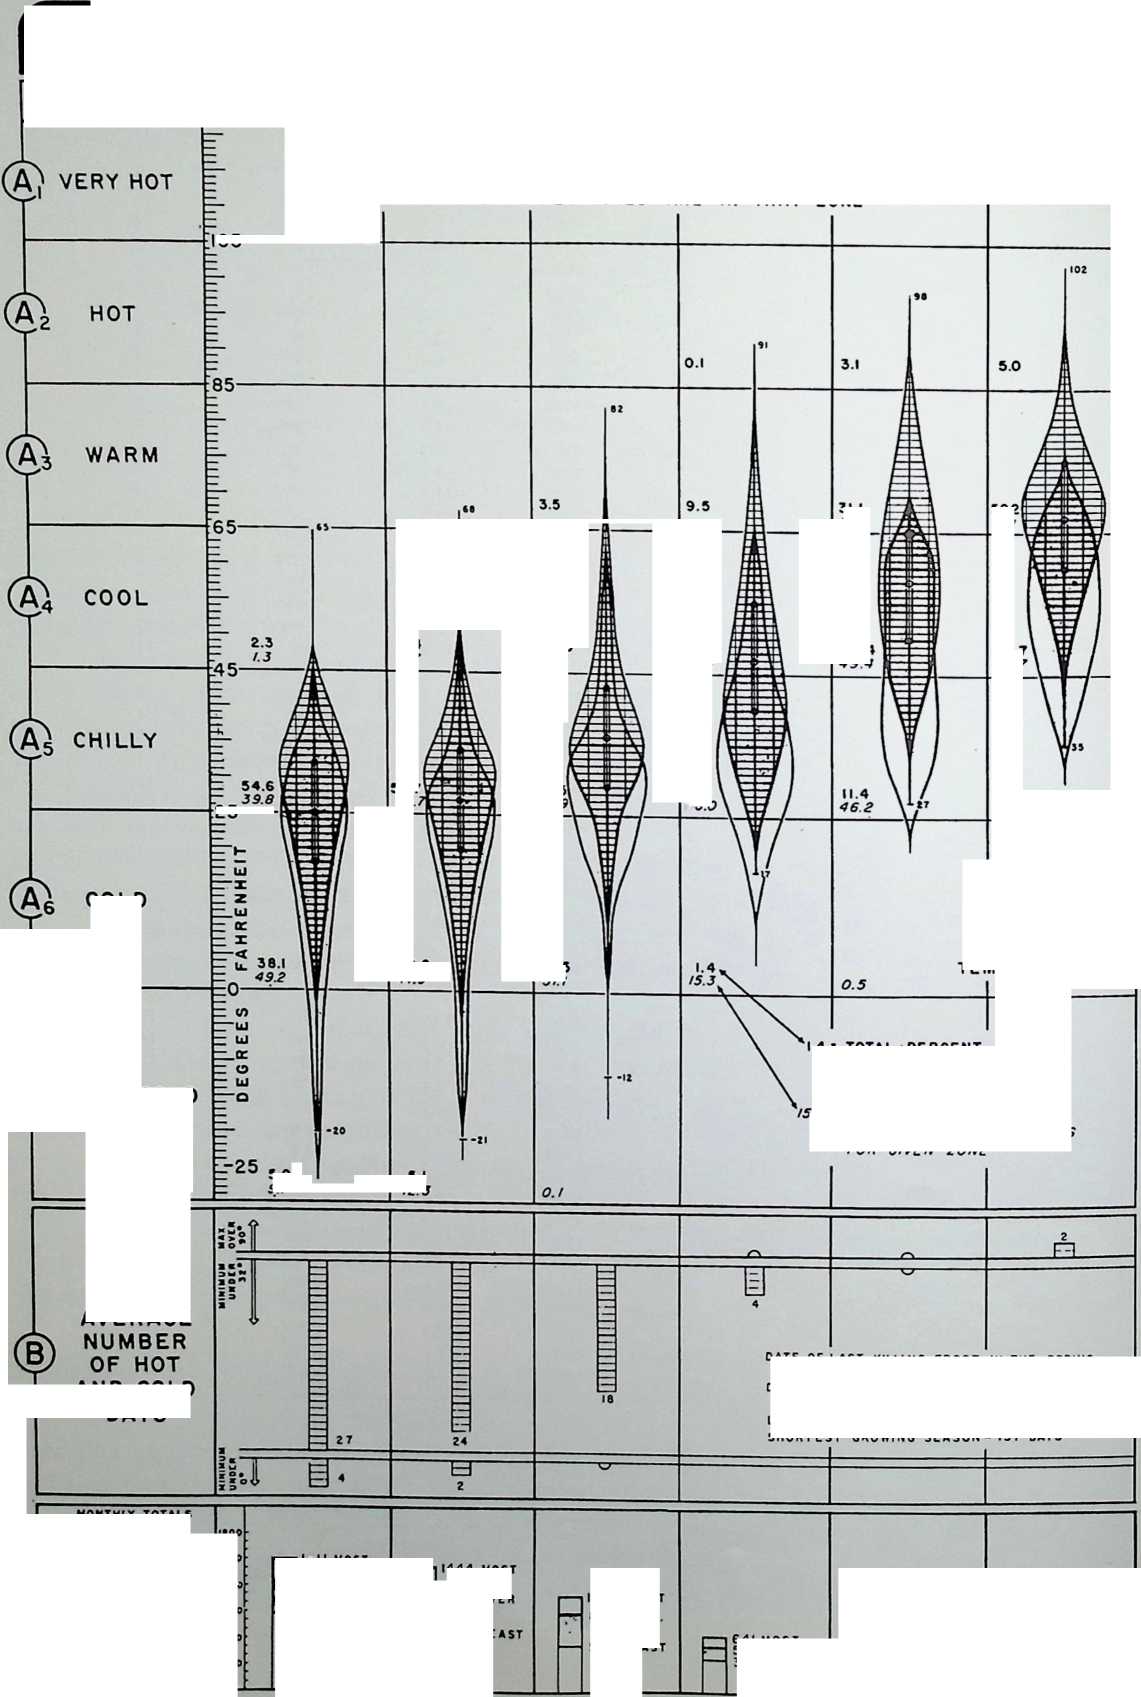


NOV
DEC
ON RECORD
- 25:
0.9
CHICAGO
AREA
CHICAGO. ILLINOIS
+:-----------------------+:----------------+
| | |
±-----------------------±----------------+
| | |
±-----------------------±----------------+
| | |
±-----------------------±----------------+
| [.1111111]{.underline} | DESIGN TEMP |
±-----------------------±----------------+
| Z 4.4 | 92* |
±-----------------------±----------------+
| □ t | 3 |
| | |
| Z 26.3 E | |
| | |
| Z 10.0 p | |
±-----------------------±----------------+
| J | 4 |
±-----------------------±----------------+
| | JI |
±-----------------------±----------------+
| - 26.3 d | |
| | |
| - 322 3 | |
±-----------------------±----------------+
| 3 q: | |
±-----------------------±----------------+
| | |
±-----------------------±----------------+
| = 32.4 B | |
| | |
| T 37.0 | |
±-----------------------±----------------+
| 9.7 I | DESIGN TEMP |
| | |
| 18 7 f | |
±-----------------------±----------------+
| | ZERO |
±-----------------------±----------------+
| | -23* |
±-----------------------±----------------+
| 0.9 | |
| | |
| 2.1 | |
±-----------------------±----------------+
26 MOST
6 AVER [O LEAST]{.underline}
25 MOST 12 AVER [O LEAST]{.underline}
11.3
29.2
193 MOST
107 AVER
443 MOST 384 AVER 142 LEAST
LONGEST CONSECUTIVE PERIOD ZERO OR LOWER - 86 HOURS - OCCURRED IN FEBRUARY GREATEST N5 OF CONSECUTIVE DAYS WITH ZERO OR LOWER - 10 DAYS - IN JANUARY GREATEST GREATEST GREATEST
N2 OF ZERO DAYS IN A SEASON - 23 DAYS (OCCURRED 1884-3,1935-6) N2 OF CONSECUTIVE DAYS WITH A MAXIMUM OF 90’ OR HIGHER - 8 DAYS NO OF DAYS WITH A MAXIMUM OF 90* OR HIGHER- 34 DAYS
9<4 MOST
755 AVER
4 52 LEAST
23.9
9 2
27.3*
48 7
 ■ BOO                 **7200**      **6968 MO**
                                     **6495 AV**
 **1300**              **4000**
 **1336 MOST**                       **5258 LE**
 **1157 AVER ^,0^°**   **4B00**
 **024 LEAST**         **3B00**
 **• 00**              **2400**
 **300**               **1200**
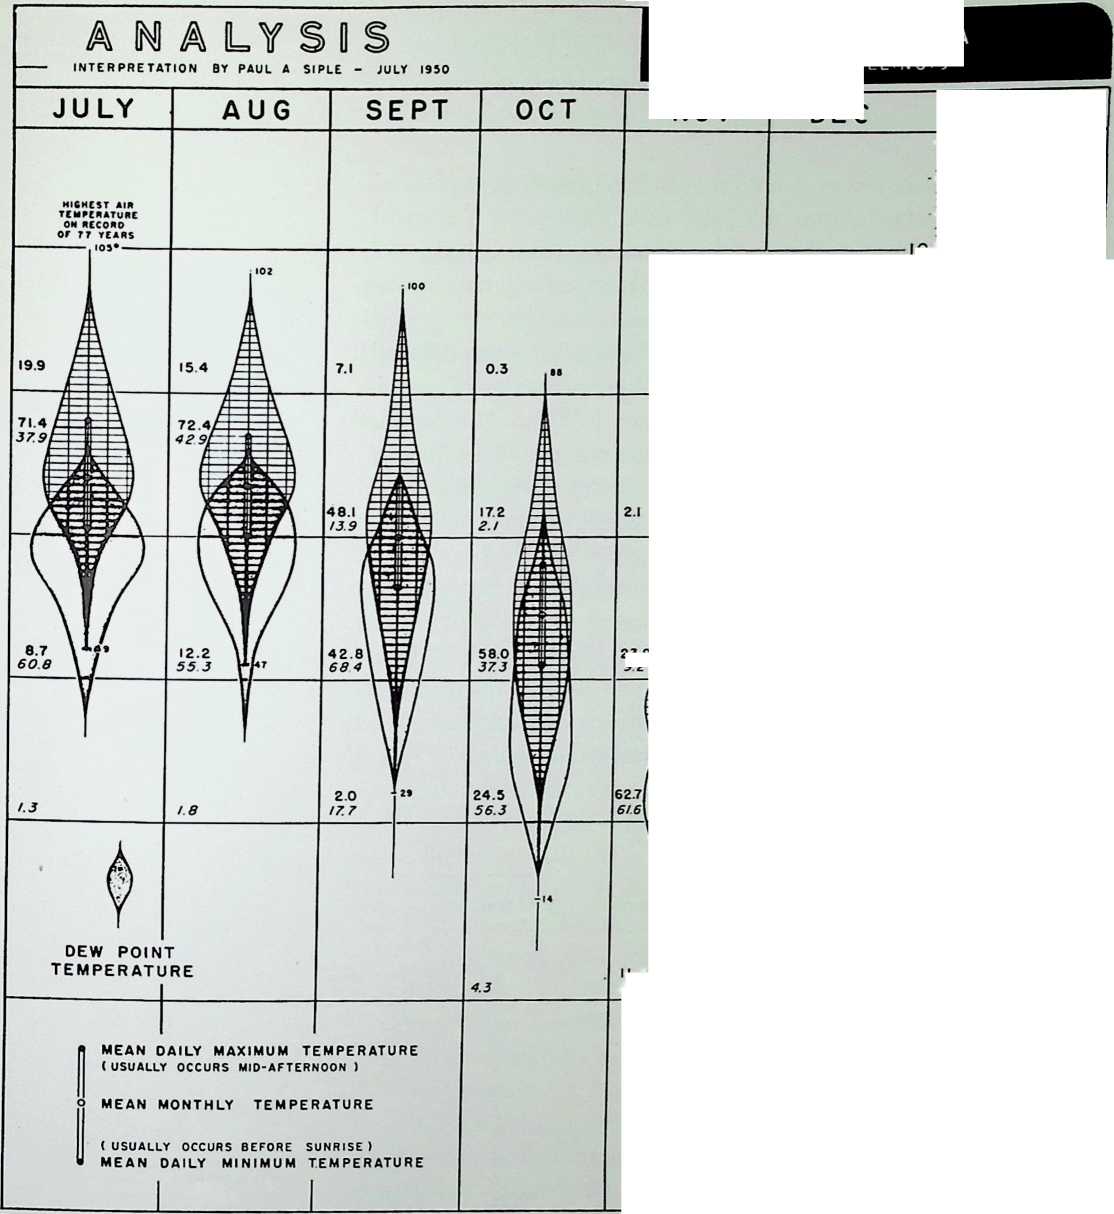

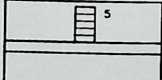
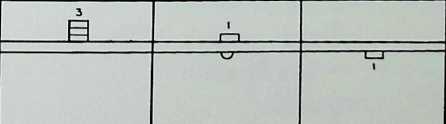
 [image]{.image .placeholder original-image-src="
content/images/image203
" original-image-title=“” width=“0.82639in” height=“\textheight”}
Notice that, in both the 1933 and 1950 examples, low temperatures were accompanied by winds from the northwest. This is typical of the general situation where low winter temperatures are concerned in Montreal; similar tabulations can be made for any district where weather records are kept.
As for the summer, we can do the same thing, and in the case of Montreal we may refer to June and July, 1931. This period is atypical in that it was the only time that Montreal temperatures climbed to 97 degrees, yet it illustrates the usual winds that accompany heat waves in the citythat is, winds of a southerly nature.
Paul Siple, in connection with House Beautifuls Climate Control Project, has developed quite a nice technique for representing in graphical form much information of this sort, as seen in Figure 153, for the Chicago area, reproduced from the Bulletin of the American Institute of Architects with the permission of the A.I.A. “Each leaf-shaped graph,” notes the accompanying text, “shows two patterns overlapping. The upper portion composed of vertical and horizontal lines represents the frequency distribution of dry-shade air temperatures. Each rectangle represents 1°F. vertically and 1% of total time occurred horizontally. This dry-shade air temperature portion of the graph always reaches higher temperatures than the portion representing dewpoint temperatures (shaded areas). Dewpoint temperatures coincide with dry-bulb temperatures only when the air is saturated (100% relative humidity).”
Table 27. June 28July 4, 1931
Date Time Temperature Wind Direction Wind Speed mph
June 28 0700 hrs. 69.5 N 10
1300 78.5 NE 8
1900 71.0 W 6
June 29 0700 66.0 NE 8
1300 83.2 SE 7
1900 74.0 W 6
June 30 0700 74.5 W 10
1300 85.5 W 12
1900 82.0 W 6
July 1 0700 85.0 SW 6
1300 94.2 SW 7
1900 81.5 W 66
July 2 0700 76.5 E 6
1300 94.5 S 8
1900 80.0 NW 10
July 3 0700 76.6 S 6
1300 76.0 SE 6
1900 76.0 SW 6
July 4 0700 76.5 N 10
1300 74.5 NE 12
¶ design and temperature
¶ macrodimatic air
The site under consideration may be one that will be used all year or only in the winter or only in the summer. The macrodimatic temperature differences of the seasons may be ascertained from meteorological records. These can be used for a variety of purposes, with the determination of heating requirements or cooling loads foremost in one’s mind.
The average diurnal march of temperature for a typical month has been indicated already. No matter on what slope the site is situated, the warmest part of the day is nearly always found sometime after the noon hour. The coolest part of the day occurs just before sunrise. The exact times of both vary with the season in question as well as from day to day.
If a building is, for example, to be used only in the afternoons, the average prevailing temperatures to be expected during these hours will be higher than if it is employed only at night. The exact information can be ascertained for each month from tables such as those given here. These temperatures, or the portion of the appropriate temperature curve at different times, will be the design temperatures when modified by the microclimatic situation.
Knowledge of the diurnal cycle of temperature can be put to very practical use, especially during the summer. It was noted that the coolest time of any twenty-four hour period, on the average, occurs sometime during the night. Therefore, to keep a house cool during the hot months, one should open the windows only in the hours of darkness, and should close them at sunrise. Not only is this a custom in some parts of the United States but Dr. Ramdas has written the author from India, “Instinctively, intelligent people here do understand the efficacy of keeping the doors and windows open during summer nights and closing them immediately after sunrise. This method of trapping the cold air of the cooler hours and preventing the entry of the heated air from outside during the daytime can actually keep the indoor temperature often more than 10 to 15°F. coolera kind of cheap air conditioning for the poor.”
Temperature is primarily a function of the incoming solar radiation. Incoming solar radiation is a function of latitude. Therefore, temperature is a function of latitude.
Table 28 gives an account of how this is true.*
This is a comparative index, expressed in terms of means, which of course do not always represent very much to architects. Nevertheless, it gives some indication of the conditions we may expect at stated lati-
* Bv permission from Climatology by Hauraiits and Austin.
Table 28. Mean Temperature, Degrees F. of the Latitude Circles
+:-------------+:----------+:------------+:----------+:----------------+
| Latitude | Year | January | July | Mean Annual |
| | | | | |
| | | | | Range |
±-------------±----------±------------±----------±----------------+
| 90° N | -8.9 | -42.0 | 30.0 | 72.0 |
±-------------±----------±------------±----------±----------------+
| 80 | -1.0 | -26.0 | 35.6 | 61.6 |
±-------------±----------±------------±----------±----------------+
| 70 | 12.7 | -15.3 | 45.1 | 60.4 |
±-------------±----------±------------±----------±----------------+
| 60 | 30.0 | 3.0 | 57.4 | 54.4 |
±-------------±----------±------------±----------±----------------+
| 50 | 42.5 | 19.2 | 64.6 | 45.4 |
±-------------±----------±------------±----------±----------------+
| 40 | 57.4 | 41.0 | 75.2 | 34.2 |
±-------------±----------±------------±----------±----------------+
| 30 | 68.7 | 58.1 | 81.1 | 23.0 |
±-------------±----------±------------±----------±----------------+
| 20 | 77.5 | 71.2 | 82.4 | 11.2 |
±-------------±----------±------------±----------±----------------+
| 10° N | 80.1 | 78.4 | 80.4 | 2.5 |
±-------------±----------±------------±----------±----------------+
| Equator | 79.2 | 79.5 | 78.1 | 1.8 |
±-------------±----------±------------±----------±----------------+
| 10° S | 77.5 | 79.3 | 75.0 | 4.3 |
±-------------±----------±------------±----------±----------------+
| 20 | 73.2 | 77.7 | 68.0 | 9.7 |
±-------------±----------±------------±----------±----------------+
| 30 | 61.9 | 71.4 | 58.5 | 12.9 |
±-------------±----------±------------±----------±----------------+
| 40 | 53.4 | 60.1 | 48.2 | 11.9 |
±-------------±----------±------------±----------±----------------+
| 50 | 42.4 | 46.6 | 38.1 | 8.5 |
±-------------±----------±------------±----------±----------------+
| 60 | 25.9 | 35.8 | 15.6 | 20.2 |
±-------------±----------±------------±----------±----------------+
| 70 | 7.5 | 25.7 | -9.4 | 35.1 |
±-------------±----------±------------±----------±----------------+
| 80 | -16.6 | 12.6 | | 51.7 |
±-------------±----------±------------±----------±----------------+
| 90° S | -27.6 | 7.7 | -54.0 | 62.0 |
±-------------±----------±------------±----------±----------------+
tudes; in fact some think there is enough data to permit one to “march” rationally up and down the latitudes according to the thermal zone one desires to inhabit.
Exact macroclimatic temperature data for any area can be obtained from the government meteorological office in the country in which the site is situated. In Canada the head office is: Meteorological Division, Department of Transport, Canada, 315 Bloor Street West, Toronto 5, Ontario. In the United States of America the head office is: United States Weather Bureau, United States Department of Commerce, Washington 25, D. C.
It is well known that higher altitudes are usually colder than lower ones. We may remark on the change of temperature of free air; other factors being equal, the dry adiabatic lapse rate of temperature[10] is approximately 5.4°F. per 1000 feet, or 6°C. per 1000 meters, in the lower troposphere. However, this is not the type of change with which the architect is confronted; he is concerned primarily with temperature drops according to the heights of mountain-sides. Here the decrease in temperature is in the order of 3°F. per 1000 feet (according to Hare and Brooks; however, Haurwitz and Austin state it is 3.3°F. per 1000 feet). What is the significance of this? Well, more fuel might possibly be required to heat a dwelling at higher altitudes than at lower ones. One may counter this by maintaining that the high levels receive greater solar radiation during the daylight hours and hence the cooling effects due to altitude are minimized in the day. But then the matter revolves about the time of the year and day that the structure will be used, for if the building is designed primarily for use in winter, when there is considerable outgoing night-time radiation, the long hours of darkness may reduce any heat gain in the day to a point where there is a net heat loss; if used for summer it may be exactly what is wanted.
In order to obtain a striking impression of the effects of altitude on temperatures we may cite the case of Quito, Ecuador. This city is situated exactly on the equator, which latitude is commonly associated with tropical regions. But Quito is different; it is at a height of 9,350 feet above sea level. Hence we find temperatures of 55°F. in January and October, and 54°F. in April and July.
This decrease of temperature with elevation is the rule. But there is a major exception: in some parts of the world the macroclimate gets warmer with height. According to Hare, this is especially true of certain parts of the Yukon and Siberia, where this phenomenon occurs up to 10,000 feet. Most architects, however, will have little occasion to make use of this piece of intelligence!
When a parcel of air is deflected upwards on the windward side of a large mountain, it is subjected to cooling. As will be mentioned in the chapter on precipitation, it may also be forced to release rain because at lower temperatures it cannot hold as much water vapor as when warm. Consequently, after it has passed over the range, it is quite dry. When descending, it warms once more and induces the phenomenon known by various terms, as, for example, “chinook” (especially on the eastern slopes of the Rockies), and “fohn” (especially in the Alps).
The effect of the “chinook” is amazing. Inhabitants of districts affected by it can experience temperature rises of 20-40°F. in a quarter of an hour. Brooks quotes figures taken at Medicine Hat, Alberta, where the temperature has risen from 70°-80°F. in a few hours. People who must choose building sites in a general area but who have freedom of choice within a few hundred miles, may be wise to select those on the lee side of such mountains. (See also comments on fog, chapters 5 and 6.)
Certain areas have a greater tendency to “attract” clouds than other ones. They are very often likely to be the summits of mountains and on the windward side. However, Hare recalls that on many knife- edged mountains the clouds often appear to the lee. This is attributed to local eddies set up by such topography. Fortunately, the majority of home-owners would not seek such locations anyway, so architects will ordinarily be relieved of considering such problems.
If the clouds are liable to be present at night, we may expect warmer temperatures than in other cloudless locations. The reason: cloud blankets tend to trap outgoing radiation and bounce it back towards the earth. There are all sorts of complicated formulas to determine the exact outgoing radiation with the presence of various cloud types; but the architect is not obliged to consider this so exactly.
Large bodies of wateras great lakes, seas, and oceansexert an influence on the macroclimate which should not be overlooked when selecting sites in their proximity. The sea heats up and cools down at a much slower pace than does the land; this is due to the lower conductivity of water and to the fact that it is in perpetual motion. This moderating influence on the temperatures throughout the day and year under certain circumstances may be very desirable. According to The Canada Year Book, St. John’s, Newfoundland, is fully two degrees latitude farther north than Montreal, but it enjoys -winter temperatures ten degrees warmer and summer temperatures ten degrees cooler than Montreal because of the maritime influence. However, regarding coastal stations on the Great Lakes, Hare notes that, contrary to general belief, dewpoint temperatures are lower than nearby points inland in early summer.
A good discussion of the moderating effect of a water-surface upon the temperature extremes of stations under its influence is contained in Richmond W. Longley’s “The Variability of the Mean Daily Temperature at Selected Canadian Stations.”
¶ microclimatic air
The small-scale deviations in the climate play a major role in the problems which architects have in selecting sites with regard to temperature. For example, proper siting as opposed to haphazard planning may mean a difference of temperature equivalent to what one could expect 300 or 400 miles north or south, according to whether the results would give a cooler or warmer environment.
The air layer near the ground, designated microclimatic air, behaves entirely differently from the air in the great region above it, known as macroclimatic air. In the latter, heat transfer is a result of vertical turbulence, which is impossible in microclimatic air because the ground barrier prevents such action; also, near the ground the air is in the form of a laminar structure. Therefore, heat transfer takes place as a result of molecular conductivity.
Let us first study the temperatures of the ground and then the air layer above it. This can be classified under two headingsthe incoming radiational type and the outgoing radiational typeaccording to whether, in general, the process occurs at day or at night.
As has been discussed in the section devoted to the effects of the sun (see Figure 16), only a portion of the solar radiation reaches the earth; however, that which does raises the temperature of the ground. The actual temperature depends on such circumstances as the season of the year, the slope, the hour of the day, and the nature of the terrain, which will be discussed in the section concerning the practical use of this knowledge. Yet in the case of this incoming radiational type of physical action which occurs during the day, the highest temperature is always found at the boundary between the ground and the air. Expressed in other terms, temperature rises considerably as we approach the ground from above.
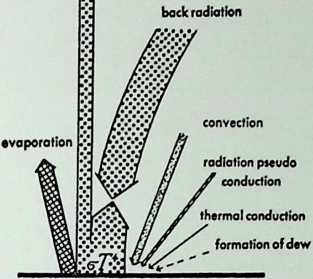 Iof the Ground
Figure 154. Heal exchange at night. Prepared- by Geiger. The scale here is slightly smaller than that of Figure 16.
effective outgoing rodlofion
Surface
supplied from the ground
The adiabatic lapse rate in the macroclimatic air is 5.4° per 1000. The rate near the earth, though, according to this knowledge, is actually much greater and may be reasonably labelled “super-adiabatic.” This has been illustrated by observations of N. K. Johnson in England in 1925. Geiger found that a temperature gradient from ten to thirty times as great as the adiabatic was formed near the ground. This indicates that the air near the ground is in a very unstable condition and there is apt to be produced a turnover of the stratification, one of the phenomena of which is the formation of dust whirls. The architectural import of this is that although these whirls often go up to heights of 75 or 150 feet they are still more frequently observed at lower levels; in. consequence, they might be disturbing in rooms on the first two or three stories of a building in the daytime. Fortunately, by proper selection of materials around a structure, we can often prevent the ground from heating up excessively so that dust whirls do not form.
The outgoing radiational type is the type that occurs at night and most extremely in winter under cloudless skies. At night there is no incoming solar radiation; then the earth is the warm body, although, of course, not nearly to the same degree as the sun. It thus radiates heat to an extent illustrated in the figure below, after Geiger. It is not shown at the same scale as Figure 16, which depicts the incoming radiation type.
As can be seen, the effective outgoing radiation (which is the radiation the earth emits into space and does not include the radiation it sends off and which is reflected to the ground again from clouds, water vapor and carbon dioxide) is relatively small. Nevertheless, it is a significant factor for architects to consider. For example, we learn from R. Geiger that: “Radiation is strongest toward the zenith, because the atmosphere is of least thickness in that direction. The more the radiation recorder is inclined to the horizon, the more effective is the counter-radiation. Directly toward the horizon the outgoing radiation is zero.” Furthermore, Geiger notes the results of a survey made by K. Brocks, who found that the nocturnal minimum temperature increased with the steepness of slope. Table 29 gives an example of his observations on narrow furrows of earth with various angles of side slope:
Table 29.
with an angle of slope of 15’ 30° 45° 60° 75° 90°
in the mean of 138 nights in 1937 6.23 6.27 6.34 6.44 6.59 6.67
in a particular case May 24, 1937 6.6 6.6 7.3 7.3 7.5 8.1
This data suggests, or would lead us to think, that where we want to minimize heat loss we should design buildings with a minimum horizontal surface area. The value of traditional forms becomes apparent. Rectangular buildings suffer lower heat loss through radiation than those of irregular shape and which sprawl in “ranch-type” fashion over a large piece of land.
It should be cautioned, however, that gable roofs would not be better than flat ones covering the same plan: the projected horizontal area would be the same in both cases. Also, it would not necessarily apply that buildings should take the shape of a tall narrow structure of small roof dimensions inasmuch as there are other complications to deliberate. A major influence is perhaps the wind, which shall be discussed in a later section.
To return to the ground layer processes at night, it is to be observed that because of the loss of heat by evaporation and the effective outgoing radiation, there is a nocturnal decrease of surface temperature. Says Geiger: “Just as the boundary surface between earth and air was the seat of highest temperature in the daytime, so does the lowest temperature prevail there at night. The temperature increases thence upward in the adjacent air layer and also downward in the adjacent earth. . . . The nocturnal increase of temperature above the ground is called ‘temperature reversal’ or ‘inversion.’ It is not limited to the air layer next to the ground, but may extend upward several hundred meters.”
The influence of this temperature inversion in the city climate will be considered in a forthcoming section. With regard to the design of dwellings, where we desire, for example, cool bedrooms during the summer in a locality noted for its lack of wind (in which a more desirable arrangement might be made at a higher level, to catch the breeze), such accommodations can be placed low down, near the ground and adjoining a low heat radiating surface, as grass.
L. A. Ramdas, M.B.E., M.A., Ph.D., F.N.A.Sc.,F.N.I.,F.A.Sc., of the Meteorological Office, Poona, India, has found that the coolest point at night is often not at the surface but at a height of 3 or more feet. This would be ideal, architecturally speaking, as this elevation approaches an appropriate ground floor window height.
The work of Dr. Ramdas is indeed most interesting. He has written to the author that he has been engaged in physical investigations of the micro-climate for over two decades. Although Ramdas has not directed his attention to the influence of climate on architecture, his many papers, some of which are noted in the bibliography, should be read by anyone desirous of enquiring into the subject further; also, a few of his additional remarks may be seen in other paragraphs of this volume.
We can observe, incidentally, that it is not unusual to experience a reduction in the wind velocity at night. Because of the cold and heavy layer of air that is produced under a warm lighter one, there is established a certain stratification; accordingly, in the words of G. Hellmann, as quoted by Geiger, “The air clings to the ground as though anchored there, and resists all efforts to move it.” This change of temperature with elevation also serves to indicate how important it is, when taking comparative observations of existing conditions, to keep thermometers at the same height. Where there is a wind of any strength, turbulence will be set up. Stratification of air layers in the manner just outlined will thus not have a chance to occur. Thus at night there is a heating effect produced by even the smallest breeze.
Another peculiarity of the microclimate, as might have become evident during the preceding remarks, is that the closer we approach the ground the more extreme it becomes. Geiger illustrates this remark with a photograph of a railing for some sandstone steps. It is not the purpose of this volume to dwell on the effects of the weather on building materials, but we may point out in this case that because there is a tendency for relatively frequent frost and thaw at low levels, the railing disintegrated. There are also the damaging consequences of alternations between dryness and the moisture of snow and spattering rain, which will be mentioned later on. This would indicate that the use of hard, dense, wear-resisting materials, such as granite, at the base of a building need not be limited to designs where monumental or archaic effects are desired.
The freeze-thaw cycle can be a very important consideration when the building is designed. Each horizontal surface becomes a miniature ground, as far as the microclimate is concerned. Roofs, especially, will come into this category, and we must give particular attention to them.
It has already been remarked in this section that a roof area of minimum dimensions should be provided in order to minimize the heat loss. Because of the severity of the winter in northern zones, this is an essential design factor. Yet we must also look into the problem of orienting the roofs to minimize the damage due to them. The United States National Bureau of Standards has issued a number of reports -written by Hubert R. Snoke and Leo J. Waldron entitled Building Materials and Structures. The most striking item contained therein -Ruth regard to roofing is that no matter what roofing material was employed weathering was greatest on the side or sides exposed to the sun sometime during the day, i.e., in the southern quadrant. On those days when the temperature hovered around the freezing point, the side with a southern aspect was warmed up sufficiently to melt any existing ice or snow. This would probably be only a temporary effect, however; the water would freeze once more towards evening, in accordance with the usual path of the diurnal cycle of temperature, and wreak havoc again with the materials. What can we do to avoid this? The simplest solution seems to be to construct roofs without any side facing south and at an angle sufficient to prevent the sun from reaching it at any other point for any length of time on a winter day. The roof should also be steep enough to permit excess water to run off but shallow enough to retain an insulating blanket of snow. A slope between 20 and 25 degrees, with the lowest point on the north side, would be all that is needed to provide for these several purposes.
We have reviewed in the solar radiation section the influences of different surfaces on reflectivity. We shall now investigate more fully the thermal characteristics of surfaces and the resulting modifications of the climate, in relation to the requirements of architects.
Both the conductivity and the heat capacity of air are much less than those of the solid particles which constitute the soil; the more air the soil contains, the lower will be the values of both conductivity and heat capacity. When the air is partially replaced by water, both these factors will be increased, and we should expect to find the greatest diurnal changes of temperature over soils containing the highest proportions of air. Professor D. Brunt in his paper entitled, “Some Factors in Microclimatology,” has made a fine study of these phenomena complete with mathematical formulas based on the temperature of the air at the ground, the vapor pressure of the air, and the heat capacity and conductivity of the soil. Brunt has discovered that the temperature fall in a given time is inversely proportional to the square root of the product of the coefficient of conductivity of the soil (k) and the heat capacity of the soil (s). Brunt gives 1/ks figures for loams of various water contents, and snow, as follows:
Table 30.
Sandy loam (dry) 57 (this would be similar to sum-
Sandy loam (10% water) 40 mer conditions)
Sandy loam (20% water) 12 (this would be similar to win-
Snow 250 ter conditions)
Thus temperatures may fall (or rise) more quickly over dry sandy loam than over sandy loam with water; and temperatures over snow will fluctuate more quickly than either of the above.
Brunt also remarks: “Although the time from sunset to sunrise is much longer in winter than in summer, the effect of the addition of water on the soil constants is so great that the fall of temperature from sunset to sunrise is about three times as great in summer as in winter.”
Brunt draws up a list of types of soil, arranged in order of decreasing diurnal variation of surface temperature, as follows:
Table 31.
snow (night) i.e. very large fall of surface temperature at night sand
light loam
heavy loam
clay
snow (day) I.e. small changes of surface temperature by day, due to reflection
deep water
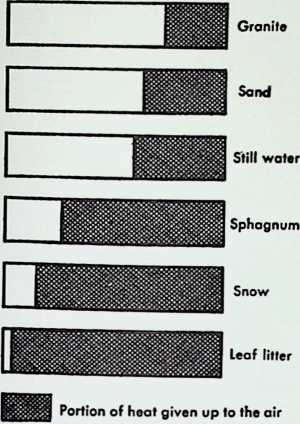 Geiger prepared a similar table (Table 32), from results obtained by N. K. Johnson and E. L. Davies on Salisbury Plain, England, 1925. It is a comparative illustration of the range of temperature in January and June over different surfaces:
Sea
Figure 155. Utilization of incident heat radiation by different kinds of ground surfaces. Prepared by Geiger.
Geiger has also presented us with a graphic illustration of how the different kinds of ground utilize incident heat radiation. The surfaces at the top of the chart have a very little daily range of temperature; those at the bottom have a wide range of temperature. Caution should be adhered to when giving consideration to this information for architectural use. We have seen that temperatures are liable to be lower on a sandy soil than on clay at night, because the heat is conducted more slowly from the subsoil. However, according to G. Manley in his paper, “Microclimatology,” published in the Journal of the Royal Institute of British Architects: “It does not follow that an undrained soil is best to live on; such a soil is liable to keep the temperature lower during the day owing to evaporation of surface water. Well drained clay might be better but has the disadvantage that it tends to crack and disturb foundations during drought; hence …the best choice for a site would be a medium loam.”
tar-macadam 32.6°C. 6.8”C.
sand 25.9 54
earth 25.0 54
gravel 21.1 5.Z
grassy ground 16.0 3.3
day soil 11.5 5.0
for comparison: air temperature at 1.2 14.2 6.6
Table 32.
June 1925 January 1925
m. (Stevenson shelter)
When a soil is plowed or disturbed in any way more air spaces are introduced. Thus because, as we have seen, the heat capacity of air is quite low, there is a poorer heat economy in soils which have been plowed than in those untilled. Certainly, therefore, where the temperature tends to hover around the freezing point, there is more chance of frost occurring over the plowed than the unplowed soil, provided the soils are similar.
When a soil is subjected to watering there is a marked cooling of the surface. Geiger includes in his book some measurements by L. A. Ramdas and R. K. Dravid in India. They found that when a soil was artificially watered, the surface temperature dropped within fifteen minutes from 75°F. to 55°F., and that the cooling effect of the water was still evident on the sixth day after it had been applied.
We may include the remarks of Brunt on this subject: “Over a heavy soil, such as clay, water tends to lie in pools, only slowly percolating in the ground, and maintaining a high water content in the surface soil for some time after the cessation of rain. These conditions will favor a low diurnal variation of temperature. But the constant evapora
tion of water from the surface of the ground will produce a superimposed lowering of air temperature by day and by night, and will suffice to yield lower night temperatures than over light dry soil in similar atmospheric conditions. If even a light dusty soil is well watered the day and night temperatures above it will be lower than over adjacent dry soil, until such time as the surface of the watered soil has dried. It will then be found that the temperature of the air above the watered soil will be lower by day and higher by night than those observed above unwatered soil, as might be anticipated from the higher conductivity and heat capacity of the wetter soil. This offers a method of checking the incidence of night frosts though it is too laborious for large scale application.”
The color of soils, like the color of anything else, influences the ground temperature when exposed to the sun. We may cite some experiments made by L. A. Ramdas and his associates in Poona, India. In May the following surface temperatures were reached, according to C. E. P. Brooks:
Table 33.
black soil
64.4°C. (148°F.)
58.0°C. (136°F.)
48.0°C. (118°F.)
brown soil
soil covered with white powder
The daily fluctuation of temperatures at and above a sod surface in summer are something like this: during the early morningin fact, until just after sunrisea sod cover is normally cooler, by a few degrees, than the air above it. At sunrise, however, it begins to get much warmer than the air, the actual temperature varying according to the weather conditions, until just before or at the time of sunset, when both the sod surface and the air immediately above it are at approximately the same temperature. However, when the sun has gone to rest (to borrow a phrase from the song Sir Harry Lauder made famous), the sod surface is again usually cooler than the air.
This intelligence will serve to substantiate a previous remark that the ground itself has extremes of temperature and therefore the weathering effect on materials at such levels is greater there than up above.
It may be surprising to some to learn that “. . . bare soil is cooler by day and warmer by night than the same soil when grass-covered, and that the effect of a grass covering increases as the length of the grass increases.” But according to Brunt: “Cornford (1938) gives, as a typical occurrence, the following minimum air temperatures at three feet above the ground, over various types of soil covering, over flat land, at East Pekham, Kent, on the morning of May 30, 1937 [presumably before sunrise]:
bare soil 49.5°F.; in wood 49.0°F.; among raspberry canes 48.2°F.;
meadow 45.7°F.; meadow, longer grass 43.0°F.; grass and clover 43.5°F.
These figures make it clear that air above grass is colder than air above bare soil or in a wood, and that the air temperature over long grass is usually lower than over short grass. This is in accord -with normal experience, radiation fogs being frequently observed to form earlier over long grass than over short grass. We may learn a practical lesson from these figures; in an orchard, where low night temperatures are liable to produce damage to crops, the soil should preferably be tilled and kept clear of grass. When this is not practicable the grass should be kept as short as possible during the late spring, when heavy night frosts are dangerous.” Geiger confirms Brunt’s remarks. “It is a matter of common experience that the air over meadows or weedy crops is colder at night than that over bare soil. Differences of as much as 9°C. have been measured. This can be directly observed at times by reason of the formation of hoar frost.”
This knowledge can also be applied to the design of the surroundings of buildings where the same results are desired.
Let us now compare the effects of adjoining areas of paved and grass-covered surfaces.
It is obvious to most of us as a result of personal experience that on a summer day it is usually much warmer when one walks along a paved street than through the city park. The magnitude of this difference, however, is usually not realized. Considering the pavement, say asphalt, by itself, it has been found that temperatures of 120°F. are not uncommon at its surface in summer. Geiger quotes an author who maintains that “on southern exposures in our climate temperatures up to 80°C. can be expected under favorable conditions.” Below is a graph of experiments by G. S. Eaton, presented in The Climate Near the Ground.
Notice that the asphalt stores up tremendous heat. Its path of temperature follows very closely that of the sun until the evening, when it is still giving off a lot of radiation. How unbearable such a surface can be next to a house on a hot summer evening! Too many architects make the mistake of paving the surroundings of a building without any regard for the consequential airchitectural effects.
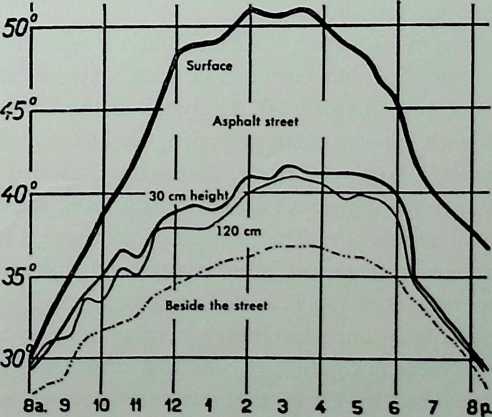
Figure 156. Temperatures above an asphalt street. After G. S. Eaton.
This is well illustrated by W. Knochenhauer who performed some experiments one evening at the airfield in Hanover, Germany. The influence of runways, grass cover, and a building on the temperature is explained in the diagram below:
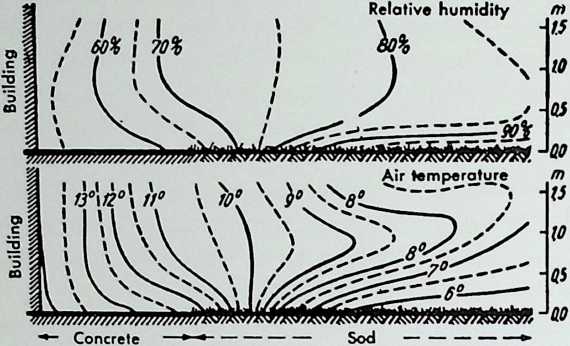
b * ‘ 1 100
Distance from building
[i]{.underline} 2W
Meter
Figure 157. Influence of runways and grass cover on the air near the ground on an airfield in Hanover, Germany.
We have included in this comparison the relative humidity chart above the same surface. Here is what Geiger comments on the observations: “Looking at the sketch as a whole, the first thing to attract attention is that the lines of equal temperature and equal humidity run vertically rather than horizontally. The fact seems to be that it is warm and dry in the neighborhood of the building, but cool and moist out over the sod. In the air closest to the ground, the iso-lines bend over to a horizontal position so that near the ground the contrast with conditions at a greater height is increased. Over the sod there is a cool, moist air layer; over the concrete, a warm, dry one. The influence of the latter is greater; for we have to go some 130 m from the building before the two conditions balance, with resultant vertical lines of equal temperature and moisture. About 1 m above the sod there is a region of maximum temperature; it is also noticeable on the humidity chart as a dry zone, though rather a weak one. It looks as though the warm dry air which has formed over the concrete, moves slowly out at this height above the sod, overrunning the cold ground air.”
Landsberg in his paper, “Microclimatic Research in Relation to Building Construction,” has provided us with a typical set of measurements of temperatures (Table 34). He notes furthermore: “This shows that on days with intense solar radiation, unshaded surfaces will add heat to the surface layer of the air. In contrast, shaded surfaces have temperatures only slightly above air temperature and will not add materially to the air temperature. The example given above is quite conservative. There are cases on record when pavement temperatures of 130°F. and roof temperatures of 170°F. have been measured. The roof temperatures are particularly undesirable for keeping houses comfortable in summer. Shade trees mitigate this condition considerably.”
It is reported by Linke that measurements of temperatures of
Table 35.
asphalt 51 °C.
concrete 43 °C.
grass 39°C.
Table 36.
grass in sun asphalt in sun concrete in sun
89°F. 106°F. 111 °F.
Figure 159
+:--------------------------------------------------------------------------------------------------+:------------+
| air temperature taken under standard meteorological conditions: | 77°F. |
±--------------------------------------------------------------------------------------------------±------------+
| concrete walk in the sun dark slate roof in the sun short grass in the sun leaves of oak tree | 95°F. |
| | |
| soil in the shade of big oak tree | 110°F. |
| | |
| | 8 8 °F. |
| | |
| | 81 °F. |
| | |
| | 79°F. |
±--------------------------------------------------------------------------------------------------±------------+
Table 34.
grass, concrete and asphalt-covered surfaces in Riverside, Illinois, produced the results shown in Table 35.
The author has corroborated some of these observations by performing simple experiments in front of the Eaton Electronics Research Laboratory, McGill University. At a point in front of this building, surfaces of asphalt, grass, and concrete meet. With the aid of two mercury thermometers attached to a stick and kept out of the direct rays of the sun, a fairly good comparison between the temperatures of the two surfaces was possible.
The results are given in Table 36.
In this case the concrete was warmer than the asphalt, which leaves in doubt the validity of Linke’s remarks. However, variations in the mix might have influenced the surface temperatures somewhat. In any case, both the concrete and asphalt are considerably warmer than the grass.
James M. Fitch, architectural editor of House Beautiful magazine has provided us with sample radiant temperature differences between a lawn and a blacktop terrace. He says in “Buildings Designed for Climate Control,” as published in Weather and the Building Industry. “Here is a diagram based on actual measured conditions. It shows a difference in radiant temperatures between a lawnwhich registered an average of 80 degrees right at the surface of the lawnand a blacktop or asphalt terrace, where the temperature registered 120 degrees. There you have a 40 degree differential inside of fifteen or twenty feet. What is worse, you have a heating system radiating heat directly into the house. Everybody knows this but I think if we took a Gallup poll of the terraces in this country, we would find very little attention paid to such considerations. Sod is an actual cooling element. Here is a demonstration, again based on observations. You have an air temperature of 85 degrees at the street and, 75 feet back, moving across a lawn and under shade, the temperature is
Figure 160

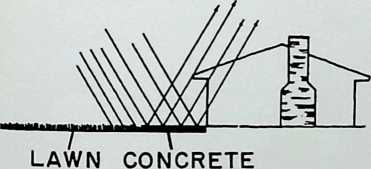
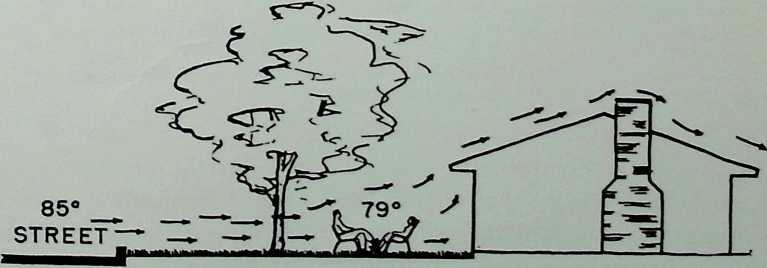
down to 79. This is a condition which operates all the time, everywhere, and it is pretty consistently ignored. In other words, we use lawns more for what the neighbors will think than for what comfort they might yield us.”
Appropriate grass, therefore, is one that does not thin out with the hot weather of summer and consequently will not lose its cooling power. Although not the most attractive, white clover is the best seed to sow when temperatures are a problem. Besides being cheap, it grows very quickly, and will not wither in heat. However, sometimes it does die in winter. Regarding finer grass surfaces, J. H. Boyce and Dominion of Canada Agrostologist T. M. Stevenson recommend in “The Construction of New Lawns” that: “The lawn which will receive only normal lawn maintenance should be seeded to a mixture. Kentucky bluegrass should form the basis of most seed mixtures sown in east Canada and in other parts of the Dominion where there is sufficient moisture available. A mixture which is highly satisfactory under these circumstances consists of four parts by weight of Kentucky bluegrass and one part of colonial bent. …It must be pointed out that Kentucky bluegrass is the most desirable of the ordinary lawn grasses.”
Just as the presence of the ocean has a moderating influence on the macroclimate, so does the existence of a smaller amount of water, such as a lake or a pond, have an effect on the microclimate. We have already seen in the solar analysis that the water surface has a low albedo or reflectivity, and buildings can be placed with reference to the probable reflection, depending on whether it is desired or not. However, we must also recognize some of the other properties of water.
Although there is a marked diurnal cycle of temperature over small bodies of water, unlike the case of the ocean, there is a value in having water in the proximity of buildings on certain occasions. Its distinctive character is that it provides a surface of evaporation when one needs it the most. For example, J. Bartels has calculated some evaporation figures from a Wild cupan open water surface placed in a meteorological shelter during the months of May to August in three consecutive years. His findings, according to Geiger, are given in Table 37.
Table 37.
Evaporation in mm. From sand surface From sod surface From water surface
on days after rain 2.38 2.80* 2.24
on dear days 0.47 2.15 3.61
on drought days 0.26 1.14 3.80
* See note on Thornthwaite, two paragraphs ahead.
Evaporation will in turn produce cooling of the air; and we see from the above table that on clear and drought summer days, when cooling is particularly required, the most effective way is to get it from a surface of water. As a result, we can place our houses near small lakes or
ponds in order to make use of this cooling power; or we can provide for artificial pools of water in the environs of the building.
C. Warren Thornthwaite in New Jersey has done exhaustive studies on evaporation from various bodies. He found that vegetation is the most effective way of disposing of soil moisture. The evaporating moisture, in the process of transpiration of the leaves, cools the air. It is said that some large trees are capable of disposing by this method between 150 and 200 gallons of water per day.
This evaporation principle of cooling may be directly incorporated into architectural design. An example is the Green’s Ready Built Homes project in Rockford, Illinois (see also, pages 74 ff.), on the roofs of which George Fred Keck and William Keck provided for a thin sheet of water (Figure 161). The roof construction is of prefabricated panels running the •width of the house, covered with a built-up roofing of tar and felt covered with slag. A metal flange, similar to a large gravel stop, runs around the perimeter of the roof to hold the water on the deck. It must be noted that it is important to keep this water in motion, for stagnation would be conducive to the breeding of mosquitoes and other insects.
A somewhat similar detail was planned by Antonin Raymond for the Dormitory in Pondichery, India (see Figure 162; and other photos, Figures 94 and 95). Here, 4-foot by 6-foot thin, curved, precast concrete slabs are placed above the main roof. These protect the insulation below from the direct sun and consequent overheating. Although there is no planned method to keep this lower surface moist, it is often becomes so during heavy rains, as in the monsoon period, by water entering at the ends. Ventilation that occurs through the channels created by the shape of this double roof also assists in evaporating the mjsture and keeping the roof cool.
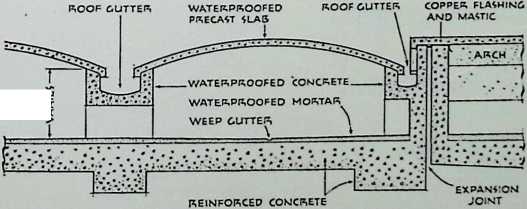
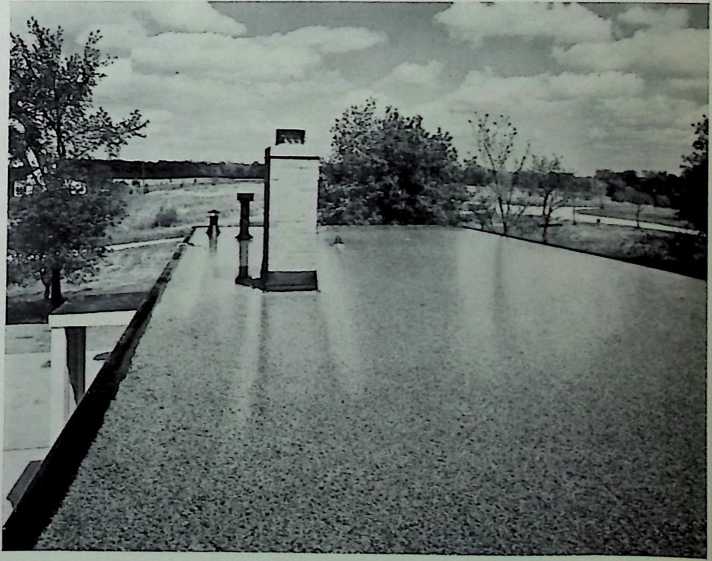
VARIES
Figure 162 (below). Roof detail, dormitory in Pondichery, India, planned by Antonin Raymond.
Figure 161 (right). Waler-covered roof, Green’s Ready Built Homes, Rockford, Illinois.
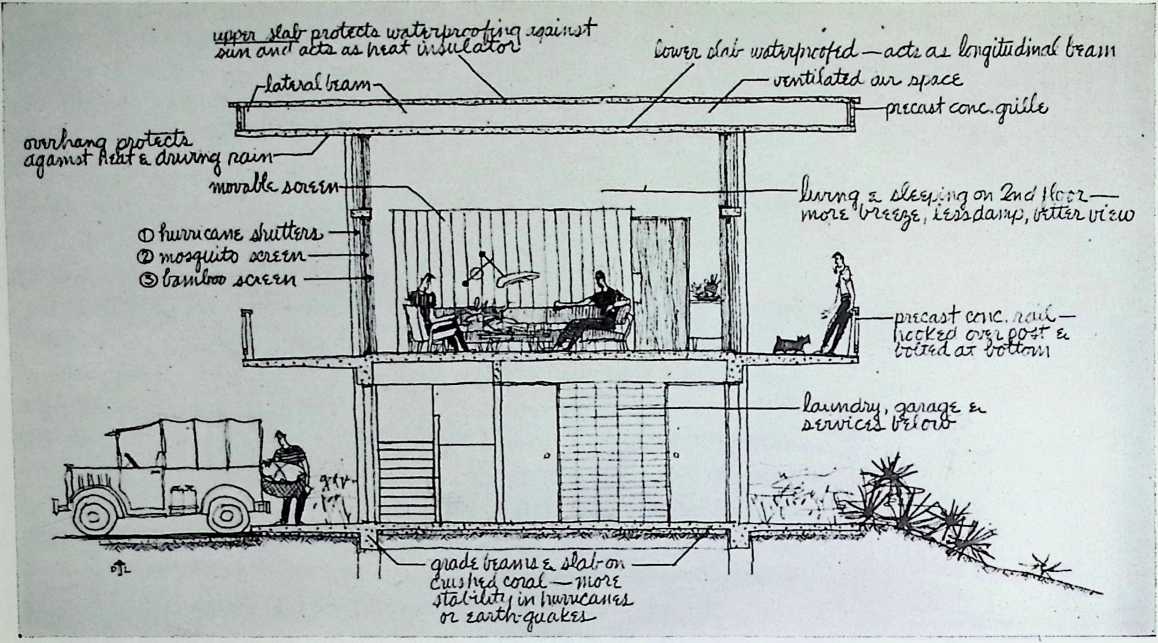 A variant of this roof design was planned by Antonin Raymond and L. L. Rado for the proposed cable station for the Commerical Pacific Cable Company at New Agat, Guam (see Figure 163). Here, cooling by the evaporation idea can also be achieved by a manner similar to that in India; and on days when there is no rain, as in Pondichery, the double roof helps to insulate the building from excessive temperatures. Thus, Raymond and Rado, as well as the Kecks and others (see Wiener and Serfs solution page 93) have solved a problem, which Ramdas has described in a letter to the author as “being more important than is ordinarily realised.” For “the radiation from the roof and walls exposed to the strong tropical sun is the cause of more discomfort than just the hot air that may enter a building.”
Figure 163. Proposed cable station for the Commercial Pacific Cable Company in New Agat, Guam. Antonin Raymond and L. L . Rado, architects.
According to John Everetts, Jr. in his paper entitled, “Analysis and Influence of Climatology upon Air Conditioning Design,” this cooling method has been followed as far back as 2500 B.C., when the Pharaohs of Egypt employed slaves to fan the air over large porous earthen jars filled with water. The water, seeping through the walls of the jars, exposed a large wetted surface which provided evaporative cooling; and this medium of cooling is still used effectively today in the southwestern part of the United States and in other arid climates.
With regard to the air layer over snow and its airchitectural significance, there is not very much on which we can comment. This air layer behaves very much in the same way as does air over the ground. Here are the main characteristics, however, as given by Geiger:
In contrast to temperatures within the Stevenson screen, the temperature picture of the air near the snow is one of extremes, particularly so at the snow surface.
The temperature scattering is greater by day than by night, and as we leave the surface of the snow, it decreases upward slowly but downward very rapidly.
In the air close to the snow, incoming radiation predominates by day and outgoing by night, just as over the earth.
The snow’s importance to architecture lies not in the above qualities so much as in various other factors, as insulation and reflection. (See discussions of these in the chapters on sun and precipitation.)
The influence of the earth’s surface on the microclimate can also be modified by the vegetation which grows on it. The protection afforded by plant cover of any sort is such that it separates the absorption of the sun’s radiation over a certain vertical space, rather than confining it to a single surface, as the bare ground; also it provides space for the entrapment of air. As Geiger says, “This distribution of the day’s warmth protects from sudden heat, while the similar spread of nocturnal cold protects from damagingly low temperatures. Plants modify the temperature fluctuation o] the climate near the groundThis, therefore, is the major architectural significance of vegetation around buildings.
We have already discussed grass and paved surfaces and the reflectivity of different materials under different headings. However, for further information one is urged to refer especially to the several papers of L. A. Ramdas and others, which are listed in the bibliography.
Forests and other large stands of trees produce their microclimatic peculiarities too. For example, in an area of 7,000 acres in Copper Basin, Tennessee, C. P. Hursh and C. A. Connaughton, writing for the Journal of Forestry, said, “in both winter and summer, average daily temperatures dropped 3 or 4 degrees F. lower in the forest than in the denuded zone, and did not generally rise as high.” They also note that, “Reduction of losses from frost were particularly noticeable in the forest, where critically low temperatures were not reached.”
The process involved is one of heat exchange at the level of the crowns of the trees. In the daytime, when the top of the forest is undergoing attack by the sun’s rays, what cool air there is, sinks down to the ground, being heavier than the warmer air. In the evening the leaves of the crowns radiate heat in a manner similar to that of bare ground at night. This produces cooling again, and the cool air sinks down to the earth unless the trees are so dense that it does not have a chance to do so. There is, as a result, an amazing uniformity of temperatures at the ground surface of a forest throughout the day. This analysis is necessarily a brief summary of the situation. For further comments the reader is referred to Chapters 29-35 of the Climate Near the Ground or to Brunt’s treatise on microclimatology.
Not only mass, but the materials of the forest have an effect on the climate. There are so many variations that it is hard to generalize. However, we may point out some experiments by A. Muttrich over a fifteen-year period at five stations in a fir forest, four in a pine forest and six in a beech forest. Figure 164 shows a chart of his results, as presented by Geiger. The accompanying test is as follows: “All three curves show
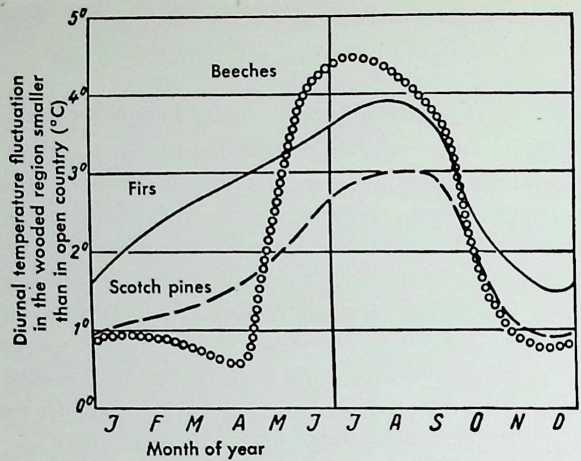
Figure 164. Influence on the kind of forest on the diminution of diurnal temperature fluctuation in the trunk space in comparison with open country.
the anticipated annual march with a maximum in summer when radiation is strongest and a minimum in early winter. Most striking is the curve of the deciduous forest. When, in spring, the increasing insolation falls on the bare beech forest, the difference between field and forest is slight. What the trunk space loses to the open in radiant heat on account of the shade by trunks and branches, it regains because its quiet air retains the heat. …As soon as the leaves come out there is a sudden change. The dense leafy crown intercepts all radiation. The daily fluctuation in the beech forest is reduced almost 5° on the average and reaches a value which is attained by no other kind of wood at any time. The evergreen forest is much more uniform in its range. The trunk space is at no time shielded so little as is the deciduous forest before the leaves come out, nor so much as the beech forest in full leaf. The curves for the two kinds of evergreens run practically parallel. That of the spruce forest, with its dense, dark crown, is at all times somewhat higher than that of the lighter pine forest.”
Architects can thus take advantage of the forest if they site buildings there. In summer, to attain coolness, a deciduous forest would be most appropriate. In winter, for warmth, a coniferous forest would be best. And for all-year-round use, siting in a coniferous forest might provide the most suitable results. A word of caution, though: the above conditions occur only in the forest. Variations similar to those which might occur over open ground are produced in clearings of any magnitude and at the borders of the stand.
Small clearings have their peculiarities. Geiger writes: “ H. E. Hamberg in his classic investigation into the influence of forests on the climate of Sweden, showed that clearings possess a climate of greater extremes than that of the open. J. Schubert, in connection with observations in Neumark from 1900 to 1903, found 9.4° as the daily temperature range in the trunk space during August and September, 9.9° in nearby open country and 10.8° in a shelter within the clearing.” These are presumed to be degrees centigrade, on which scale the unit is nine-fifths that of the Fahrenheit thermometer. So translated into Fahrenheit degrees, this difference is much greater than that which first appears. Such intelligence is particularly useful when the architect wishes to keep temperature extremes to a minimum.
Air of lower temperature is heavier than air of higher temperature; it therefore falls. On flat surfaces the cold air will grip the ground; but on sloping surfaces there is a tendency for the heavier cold air to slide. Accordingly, this fact can greatly influence site selection as far as the architect is concerned.
“Where will the cold air come from in the first place?” one might ask. The reader will recall, however, that we have already reviewed the phenomena which occur at the surface of the ground at night: there is an outgoing radiation and the earth cools. The cool air will seek the lowest place it can find, forming what are often termed as “frost holes,” “cold islands,” or “cold puddles.” Architects can learn two things from this: concave forms in the terrain at night are usually cold with relation to the surroundings, and obstructions to the flow of cold air may have an effect on the distribution of temperatures. As far as the latter is concerned, we quote numerous examples. Foremost perhaps is that of Geiger; “Where a railroad embankment crosses a gently inclined plain at right angles to the slope the adjacent air above it, where the air is dammed up, is usually colder and more liable to frost than that on the down-slope side where the air cooled by radiation is free to flow on down and make room for warmer air from above. Gardeners on opposite sides of the embankment must raise different kinds of flowers, for what luxuriates in the favored location freezes in a nearby area.” See Figure 165 for an illustration of this phenomenon.
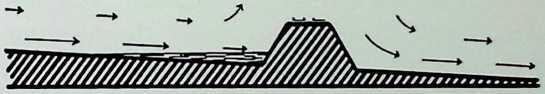
Figure 165. Air drainage at night on both sides of a railway embankment crossing a sloping surface.
Brooks illustrates the effect of topography, by a similar allusion: “A striking example of the effect of a narrow valley in creating a frosthollow, aided to some extent by a railway embankment, is described by E. L. Hawke (1944) from nearby Rickmansworth in Hertfordshire. He sums up by quoting figures to show that the night climate of this low- level Hertfordshire valley is almost identical -with that of Braemar, at a height of 1,100 feet in Aberdeenshire, and Moor House, 1,840 feet up in the northern Pennines. A still more remarkable and instructive example from Austria is quoted by Hawke (1946) in a chatty article on frosthollows in general. Even on slopes situations differ as regards liability to frost. The cold air flowing downwards from the hills follows the line of least resistance and is readily diverted by obstacles. These may be so placed as to concentrate the air flow in well-defined channels, -where on clear nights ground and buildings are exposed to a strong, cold breeze.
Such situations can usually be recognized from a study of the ground, and it may be possible to divert the air by planting trees or building walls obliquely across the path of the air.”
The reason for placing these obstacles at an oblique angle is probably explained by Brunt in the following quotation from “Some Factors in Micro-Climatology”: “Perhaps more could be done to deflect katabatic* winds than has yet been attempted. A thick hedge running diagonally across a slope would deflect the katabatic wind, and to some extent canalize it, so affording protection to the area below the hedge. A wall or hedge running horizontally across the slope would not afford any adequate protection since the cold air would accumulate behind the barrier and finally overflow it in a cascade. It is particularly important to avoid damming cold air within an orchard by a hedge or wall at its lower boundary.”
Brooks, however, did continue in a succeeding chapter of his book with the following remarks: “Any obstacle placed across the flow of cold air on a sloping hill-side results in a local accumulation on the up-slope side, and makes a small ‘frost-hollow.’ A high hedge, wall or row of trees on the slope below a garden or building therefore increases the risk of frost, unless a gap is cut in the barrier to allow the cold air to drain away; a similar obstacle on the slope above holds back the cold air and decreases the risk of frost. This effect is most noticeable where the hill slope is interrupted by a terrace or slight hollow. A hedge planted obliquely down the hill can deflect the flow of cold air to one side. The obstacle must extend down very nearly to ground level, for the air is coldest near the ground and can easily penetrate a belt of trees with trunks bare to a height of 10 feet or so. Where for any reasons walls or hedges are impracticable, or while hedges are growing, temporary screens may be hung on posts in strategic positions when there is a risk of frost. This method of protection does not decrease the loss of heat; it merely re-distributes the cold air to places where it can do less damage.
“The effect of gaps in an obstacle is quite remarkable. It has been noticed, for example, that where a railway embankment follows the contours of a slope, but is pierced by an opening for a road, on the up-slope side the height to which the trees are frosted is lower on either side of the opening than farther away, while on the down-slope side there is an area of frost opposite the opening, but none on either side. In planning an orchard, garden, group of storehouses, etc., in which it is necessary to minimise the risk of frost, much can be done by careful siting and arrangement after study of the local air drainage. On the other hand, as Bush points out, it should be possible to make use of cold air flows to keep goods cool in summer by building storehouses across the night flow of cold air, preferably below ground, opening them by night and closing them by day.”
* Katabatic winds are winds caused by the flow of cold air down-slope. These will be discussed further in the chapter on winds.
Said L. A. Ramdas on this subject, in his paper, “Micro-Climatological Investigations in India: “The effect of locality, slope, elevation, etc., assume a special importance in determining the areas in an uneven country which would be safer for crops and horticultural gardens during the winter season when cold waves and frosts are likely to set in. A survey of the damage due to the frosts of mid-January 1935 in the Nasik district of the Bombay Presidency showed that (apart from the beneficial effects of avenues acting as wind breaks to check the cold winds), the maximum damage occurred at the bottom of valleys, the damage decreasing as one went up the slope. This effect is due to the tendency of cold air to collect like water at the bottom of a valley.”
Observations of cold-air flow were made by the author at Douglas Hall, McGill University. This is a university residence situated on the south slope of Mount Royal, Montreal. It was found from recordings made on March 13, 14 and 15, 1951, between the hours of 11:00 p.m. and midnight, that the north sidethat which was nestled against the slope was several degrees colder than the others, due to the down-slope of cool air. The averages of the figures are shown in Table 38. The measurements made on the north side, 15 feet from the building, produced higher temperatures than those farther away probably because of the heat loss from the building itself. The differences, though small, are significant nevertheless. Larger extremes probably would have been recorded just before sunrise, when the cool air produced by nocturnal radiation would be the greatest, and the value of the knowledge would thus be more apparent, but the author was very reluctant to rise at that hour of the day I
Such phenomena can be expected to occur any night during the year, and not just in winter. Also, these effects are noticeable not only on small areas such as these, but on land of large dimensions. To obtain a multitude of figures at a given time, or -within an hour or two of one another, it has not been feasible in most cases to set up recording instruments at each station; this would require too much equipment, an excessive number of assistants and a cost that would tend to become prohibitive. So man has resorted to placing his contrivances on motor-cars and has encompassed wide areas in a short time. It seems that, according to Geiger, the earliest examples of this technique being employed were in the cases of Wilh. Schmidt in Vienna and A. Peppier in Karlsruhe in 1929. Then H. G. Koch used a car in a forest near Leipzig, Germany, in July, 1933.
Of special interest to those in North America, however, is that temperature measurements of this fashion were conducted by W. E. K.
Table 38.
assuming that the south side was 0.0"F.
the west side was “F.
the east side was *F.
the north side was 15 ft. from the building “F.
30 ft. from the building *F.
50 ft. from the building *F.
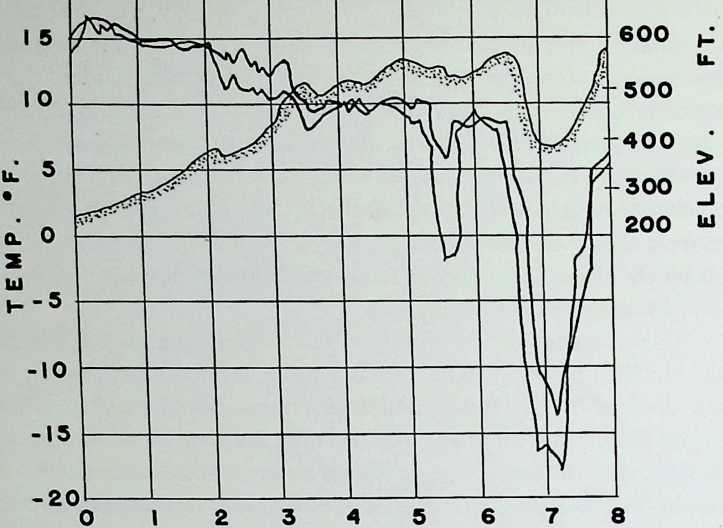 Middleton and F. Graham Millar in Toronto, Canada, during the year 1935. These gentlemen • investigated the temperature distribution over that Ontario city by means of a car on which was attached a resistance thermometer. It was well shielded from radiation and was carried about 27 inches from the ground, two feet in front of the automobile. Runs were made under different climatic conditions along one of the main thoroughfares, Yonge Street, which is described in the Journal of the Royal Astronomical Society of Canada as proceeding “in a general NNW direction from the lake front to the northern limit of the city, and continues as a paved highway for some miles beyond without appreciable change of direction.” The results of one of their runs on a cold winter night are expressed in Figure 166.
20
MILES
At the left side of the diagram is represented the position of Lake Ontario; to the right is indicated the profile of Yonge Street at given mileage intervals from the waterfront. Superimposed on this profile chart is a graph of the temperatures recorded on the outgoing and incoming runs. (Two runs were made to compensate for any change in the macrocli- matic temperature situation.) The most prominent feature of this figure is the “almost unbelievable difference in temperature, over 27° F., between the bottom of the valley and its crest” at mile 7. Experiments under like conditions produced similar results. The authors of the paper attribute this phenomenon to air drainage.
Another set of observations were conducted by these investigators on a summer day and night. They found that there was a fall of temperature between the day and night readings which led them to remark in the R. A. S. C. Journal just described, “We can scarcely avoid the conclusion that there is a real basis for individual preferences in the matter of place of residence during the summer.” Their figures are seen in Table 39.
Figure 166. Results of temperature measurements made in Toronto by W. E. K. Middleton and F. Graham Millar on a winter night in 1935.
Similar experiments by authorities in other cities were subsequently performed. Helmut Landsberg conducted one in a thermistor- equipped car over the city of Washington, D. C., in August, 1949. Washington is a very hot city in the summer, but he found temperature variations of 8° F. within a range of several miles. Architects who are aware of such phenomena can ably assist their clients in site selection.
Residents of many cities are often surprised to hear a radio commentator announce 75° temperatures prevailing for the metropolitan area while they specifically note on their own recording instruments that it is not one degree under 85. Now, although both temperatures are probably not read under the same conditions (i.e. in a Stevenson screen) both sources may be correct. As an example, we may cite Montreal. The radio station gets its information from the Dominion Public Weather Office at Dorval Airport, which is located 7 mi. WSW of the center of Montreal in quite flat open country. The inhabitant on the eastern fringe of the city may thus be as much as 15, 20 or 25 miles away from Dorval Airport and he can experience entirely different temperatures.
Longley says in “The Climate of Montreal,” as yet unpublished, “The difference between McGill and Dorval temperatures at such times (on still winter nights) may be as great as 10 to 15 degrees.” Accordingly, the author initiated a series of experiments to determine the exact nature of the differences over Montreal. There were several obstacles in the way, though, which prevented a complete survey: it was not decided to conduct the experiments until very late in the course of preparing this book, and observations of this sort, to provide architects with reliable information must be made over a period of at least one year, so as to give the information for the various seasons; it was very difficult to obtain the necessary equipment, so make-shift apparatus, described below, had to be used; the project was too ambitious for one man, namely the author, to handle. Such a program requires a number of people who will take observations at the same hours each day (or night). Consequently, observations were limited to parts of Montreal which were considered “representative.”
The first trial rim was performed on the evening of Tuesday February 13, 1951, on Bleury Street-Park Avenue from Craig Street West to Jean Talon Street.
Table 39.
Mile Location Ti (1300h) T. (2330h) Tj T.
0.0 Lake front 75.6’F. 72.5‘F. 3.1 “F.
0.6 High buildings 78.2 74.4 3.8
2.0 Uptown business section 81.1 72.9 8.2
2.5 Small valley 82.5 69.3 13.2
5.0 Top of general slope 85.0 70.8 14.2
5.8 Small valley 83.5 63.0 20.5
67 South edge of large valley 83.0 67.5 15.5
7.1 Bottom of large valley 81.6 61.4 20.2
The equipment was set up as follows: a mercury-in-glass thermometer, of the type previously described in this chapter, was suspended three feet six inches in front of the leading bumper of a 1950 Mercury car. The thermometer was protected from heat due to radiation from street lights and other sources by a tin can, so only the air temperature was measured. It was supported on a scaffold which was stayed by several guy wires to other parts of the automobile.
Runs were made along Bleury Street-Park Avenue in both directions, stops occurring at appropriate intervals en route and temperature readings being recorded only after a five-minute stop at each station in order to permit the thermometer to adjust itself to the surrounding conditions. By this means and with the aid of a flashlight, the temperature of the station could be read to the nearest one-fifth of a degree.
However, it was felt that the car’s exhaust was carried near the thermometer by the wind and caused errors in this run. Therefore, in the following experiments the thermometer was not suspended in front of the automobile. The thermometer (again protected from radiation by a tin can) was attached to a long thin piece of wood which was adjusted in such a manner that it projected about two feet six inches from the side of the car, about five feet from the ground. Recordings were taken on Victoria Avenue, from the Canadian Pacific Railways Westmount Station (at Ste. Catherine Street) to Queen Mary Road. The tabular results of several runs are provided in Table 40.
The average temperatures in these experiments range from 16.6° F. to 18.4° F. along a stretch of only one-half a mile between stations 7 and 10. Although one has no justification, by scientific principles, to speculate on temperatures that would have occurred at other times, it may be mentioned that the differences were probably much greater just before sunrise. Nevertheless, it is clear that houses at Sunnyside Avenue required more fuel consumption in winter than those at Queen Mary Road. This may influence a client to select a warmer site.
The remarkable thing about these experiments is that it is not cooler at lower elevations, as it was in observations by authorities elsewhere. The temperature is actually greater there. In the author’s opinion this phenomenon is explained this way: the cold air probably still flowed down-slopein fact, the winds verified this (see chapter 5)but because of the higher density of buildings at the bottom of the hill, which emitted a considerable amount of heat, the cool air was rapidly warmed. The results are conclusive only as far as this one street is concerned. One cannot use this as a postulate for temperature conditions on other streets. Although cold air will normally collect in lower places, as has been illustrated, other factors, as buildings, may have a considerable influence.
Thirty-year observations are not needed for this type of work. Several readings at the most will give one an indication of the nighttime microclimatic situation that will probably occur all the time. Geiger says, . . the nocturnal cold air movement occurs with great regularity even when it escapes observation and in spite of the fact that the general weather may be under domination of such other factors as wind or rain.” It is hoped that a temperature survey of at least the major cities of North America will be made as it is of greatest importance to architects for matters of site selection and building design and to mechanical engineers, health officials, and town planners. A good team should have little difficulty in preparing this survey.
In the majority of recorded instances cold air usually collects in low places. However, it should not be presumed that higher areas are necessarily warm. The accompanying diagram will assist in explaining why this is so (Figure 167). It shows diagrammatically the cross-section of a valley. Geiger commented: “On the plateau, sections of which are shown to the right and left, along the valley walls and on its floor, the lower air cools off at night at the same time as the ground surface. If the air behaved like water, there would have to be a circulation like that at the upper left. . . and the temperature distribution would be arranged in horizontal layers according to the density as shown in the upper right. Such a simple circulation does not develop, however. On the contrary, a series of smaller circulations form on the slopes. In these, the cold air on the slopes is mixed with the neighboring warm air, of which there is a great reservoir between the valley walls, as shown at the lower left. On the floor of the valley cold air accumulates. The cold lake which is formed there is deepened by the adjacent circulation on the slope. The intermediate condition depicted on the slopes reaches even to the edges of the
Table 40.
**start** **end** **start** **end** **start** **end**
1. SE corner Ste. Catherine 130.9 0.0 mi. 7.9 7.0 12.1 12.1 36.4 32.0 17.9 0.0
2. SE corner Sherbrooke St. 135.6 0.2 8.2 67 12.5 12.2 35.5 32.4 17.9 0.2
3. 200 N. of Sherbrooke 138.3 0.3 97 8.2 12.8 12.6 34.5 30.8 18.1 0.5
4. SW corner Windsor Avenue 194.4 0.4 87 7.6 12.6 12.1 34.0 30.4 17.6 0.8
5. SE corner Cote Ste. Antoine 244.2 0.5 6.8 6.8 12.2 11.1 33.5 30.4 16.8 0.2
6. NE corner Westmount Avenue 276.0 0.6 7.4 7.3 12.0 11.1 34.0 30.4 17.0 0.4
7. SE corner The Boulevard 390.3 0.9 7.9 7.0 11.5 10.0 32.8 30.4 16.6 0.2
8. NE comer Sunnyside Avenue 390.6 1.0 8.7 8.0 11.8 10.1 32.4 30.0 16.8 07
9. SW corner Mira Road 289.9 1.3 8.6 8.3 12.0 10.8 33.0 32.4 17.5 0.9
10. SW corner Queen Mary Road 263.0 1.4 9.5 9.5 14.6 12.2 32.4 32.4 18.4
Run A was recorded on the night of February 14-15,1951, starting from Victoria Avenue and Ste. Catherine Street at 10.01 PM, and returning there at 12.55 AM. There was a clear sky, hardly any wind, and old snow on the ground. This was made on foot.
Run B was recorded on the night of February 28-March 1, 1951, starting from Victoria Avenue and Queen Mary Road at 11.25 PM, and returning there at 1.07 AM. There was a clear sky and some wind, up to 7 mph, and some snow on the ground. A car was used for transportation between stations.
Run C was recorded on the night of March 13, 1951, starting from Victoria Avenue and Ste. Catherine Street at 9.05 PM, and returning there at 10.51 PM. This was a calm, clear night. Most of the wind was probably katabatic in origin. A car was again used.
For the accompanying wind recordings of one of these experiments, see Chapter 5.
Occurrence of nocturnal cooling
in a valley
Corresponding distribution of
nocturnal minima
1. Under the hypothesis that cold air behaves in the same manner as cold water
Dees not express
the
actual conditions
2. Corresponding to the best observations
Heat
reservoir
Cold
[-f]{.underline} Plateau Warm slope region
Cold lake
Radiating surface
Cold
Nocturnal minima
Fignre 167. Schematic representation of the origin of the warm slope zone.
plateau. The resultant temperature distribution is shown at the lower right. . . The plateau is cold and the valley floor, very cold, but the higher part of the side slopes are warm. We speak therefore of a warm slope (thermal belt). It is the safest place in areas and at times where there is a danger of frost. It is often indicated by the vegetation.” Geiger cites many examples to confirm his statements, but they shall not be quoted here. The reader who is interested in studying the problem is referred to the original: Chapter 19 of The Climate Near the Ground.
As far as the design of individual buildings is concerned, Brooks recommends that where they are sited against a hill and are likely to be influenced by a nocturnal down-slope of cold air, one can conserve heat by providing -windows small oneshigh up in the walls. “As most daylight enters through the upper parts of windows,” he says, “heat can be conserved with minimum loss of daylight.” Mr. Roy Lemoyne, in an excellent plan for a sanitarium in the Laurentian Mountains, Quebec, has illustrated the use of this principle in a wise manner.
We may turn to the side-effects of some of this cold air collecting in low areas and their relation to planning problems. From The Climate Near the Ground we find these remarks: “Many of us will remember when this microclimatic phenomenon cost the lives of not a few people. The general weather conditions during the early days of December, 1930, favored stagnant air and fog formation in the narrow valley of the Maas near Li6ge to such a degree that the fluorine-bearing waste gases from the zinc and superphosphate factories located there were unusually enriched. Hundreds of people became ill of respiratory complaints, and over 60 died. That this was only an unusual intensification of a normal microcli
matic condition may be seen from the fact that in 1911 there was also much harm done in the same area.” Or, there is this case; cited by Fitch in American Building: “In November, 1939, the city of St. Louis was blanketed by the worst smoke pall in its history. For nine days on end, the sun did not shineindeed there was scarcely any daylight at all. Visibilities at noon were reduced to a matter of a few feet. Lights burned everywherein schools, shops, homes, factoriesas though it were night. If anything it was worse than night, for no artificial light could penetrate an atmosphere so polluted that it cut out the sun itself. Factories slowed down, schools were dismissed, transportation crawled to a standstill: the city was all but paralyzed in an atmosphere of its own making. What had happened? Merely that the wind and the weather had conspired to hold down over the city the immense amounts of soft-coal smoke which it produced on a normally busy day.” We cannot overlook the difficulties that presented themselves in the town of Donora, Pennsylvania, in October, 1948. In this mill town, 25 miles from Pittsburgh (in the words of the Architectural Forum edition, The Magazine of Building, November 1948 issue): “Smoga blanket of smoke, fog, and presumably, toxic gasessettled oppressively over the city. Hundreds of asthmatics and heart sufferers had to be evacuated to other areas; 19 others died of suffocation in a local hospital.”
One should not be surprised if such a calamity befell a city like Montreal. As a matter of fact, it happens very frequently although to a degree less severe than the aforementioned examples. From the author’s former residence at Douglas Hall, located high up on the side of Mount Royal, almost any morning one could see a pall of smoke hovering over the city. This came from numerous chimneys of private residences and manufacturing establishments not only in Montreal but from the surrounding towns and country too. The smoke collects at a low level because of the temperature inversion that is apt to occur with nocturnal radiation.
The development of nocturnal inversions of temperature is shown very well by an illustration presented by L. A. Ramdas in “Micro-Climatological Investigations in India,” and which is reproduced as Figure 168. It is an idealized diagram in which the curves 1 to 10 could correspond roughly to the following hours for a clear winter day in Poona: Curve No. 1 1700 hours
-
1800
-
1900
-
1930
-
2000
-
2030
-
2100
-
2300
-
0300
Figure 168. Development of nocturnal inversions of temperature.
- 0700 Note that the height scale indicated in Figure 168 is logarithmic.
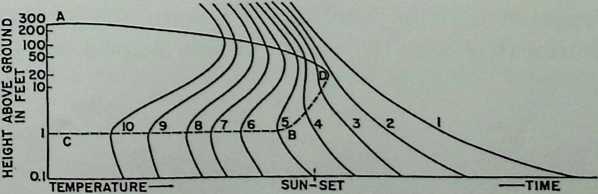
How the architect and planner can prevent smoke from collecting in places where it is particularly undesirable will be discussed in the chapter on winds. Why the smog is rarely very dense at the ground will be apparent from the discussion on temperatures in towns, in the following paragraphs. Additional causes of smog and the manner by which it can be minimized are discussed in the chapter on precipitation.
A thorough investigation has been made in the earlier parts of this chapter on the different manners by which temperatures can be changed or influenced. A lot of small particulars were covered. Now we shall look into the over-all result of temperatures in town and country, as they might be of special interest to planners in all phases of the architectural profession.
There has been assembled once again a line-up of impressive statements by some of the leading commentators in this field.
Professor Dr. F. Linke notes in “Das Klima der Groszstadt, (as translated by Mr. Gabriel Grasberg): “Wilhelm Schmidt computed that in Berlin in a year there were produced 170,000 kg. cal./sq.m, by burning in house-holds and especially in industry. One may account for the sun’s radiation as 500,000 kg. cal. By comparison of stations in and out of the city one can state that air in a big city is 1-11 % warmer than the surrounding areas, especially in winter. Although this is generally considered to be correct, as it has been verified on many occasions, some observers criticize the figures because they were taken in thermometer huts [i.e., Stevenson screens]; these shelters exclude the direct sun, rain, etc., and also give the temperatures at a height of 2 meters . . . Temperature extremes are registered near the ground . . . Thus some critics prefer to modify the above over-all temperature difference between city and country by one-half, making it in the order of %. . …
“In winter, when there is nice weather the city is always one or two degrees [centigrade] warmer than the country; but in the summer there is a large difference occasioned by the times of the day. The night in the city is remarkably warmer. In the morning it is quite the opposite. The countryside is heated quicker because in the city the buildings tend to stabilize the temperatures to a certain extent throughout the day. But at noon the city is again warmer than the environment because of the retarding effect of the wind.
“At night, the opposite process occurs. There is stronger radiation from the earth in the country than from the city because in the latter case more heat is absorbed by the sooty atmosphere.”
George H. T. Kimble, former professor of geography at McGill University, and now Director of the American Geographical Society, says in “The Changing Climate”: “It is . . . worth pointing out. . . that the artificial heat of modern cities has a far from negligible effect on the local climate. Heat engineers have concluded that in a North American city the size of Montreal (1,125,000) the amount of heat escaping into the
lower atmosphere from the factories, offices and homes on some days could raise the air temperature by three to four degrees.”
Richmond W. Longley, in a manuscript yet unpublished, and entitled “The Climate of Montreal” says, “The average difference for all nights between McGill temperatures and the temperatures at Dorval during the spring and fall is approximately 3°. On quiet nights the difference can be much greater.” For purposes of this discussion we may assume Dorval to be “the country” and McGill “the town.”
M. Parry comments: in “The Climates of Towns”: “Temperature conditions in the town differ, often considerably, from those in adjacent rural districts. The urban smoke pall, by presenting an obstacle to incoming radiation, reduces the amount of energy available for raising temperatures at the surface. But, at night, the same factor is equally effective in preventing large falls of temperature, because some of the outgoing radiation is trapped and sent back to the surface. Other things being equal, a town station tends to be warmer than a country station . . . temperature differences as high as 15 or 20° F. have been noted between town centre and rural fringe. In general, the difference is greatest at night, when all the heat-conserving factors are operating together. Conditions are most favourable on quiet summer nights, after a long cloudless day, when the heating of walls, roofs and roads has been at a maximum. During the day incoming radiation is more effective in the country than in the town, and this may offset the other factors sufficiently to give only a small excess temperature or even a lower temperature for the town station.”
Geiger advises us: “This haze hood absorbs a notable amount of sun and sky radiation; when incoming radiation prevails, as is the case at noontime and in the summer, it intercepts part of the heat. Consequently the haze hood attains a temperature higher than that of the surrounding air at the same level. The result is that the ground air of the city, which stands to lose this part of the insolation, is cooler than the surrounding ground air. The midday temperature maximum in the city, as shown by measurements, is as much as 0.5° C. lower than outside the city.
“In our climate [Germany], however, where outgoing radiation prevails the greater part of the time, the protection against net loss of radiation afforded by the haze dome is much more effective. At night and especially in winter, therefore, a large city is warmer than the country. The effect is intensified by the … . artificial heating by numerous fires which are more numerous than ever at times of prevailing outward radiation. The lowest temperature of the day in the city is consequently 1 to 2° higher than outside the city. As the city grows, the daily temperature minimum, considered absolutely, grows also. Recently H. Arakawa . . . determined for Osaka a rise of 2.6° in a century; for Tokio, 1.5°.
“From these premises it follows that the diurnal range of the city temperature is restricted in comparison with the temperature of the surrounding country, the higher minimum having more to do -with this than does the lower maximum. The great amount of masonry in a large city acts in the same direction, warming up slowly and also cooling off slowly. As a result the city lags behind in the general morning warm-up. On the other hand the streets hold the heat in the evening, especially in midsummer.”
We must not overlook, in this discussion, the findings of Landsberg in and around the District of Columbia. In an address before Convention Symposium I, “Urban and Regional Planning,” of the American Institute of Architects, on May 10, 1950, he said: “There are sites on the Virginia side of the Potomac River where on summer evenings and nights the temperatures will be from 5 to 10 degrees F. below the values simultaneously recorded in downtown Washington. With appropriate shade trees we can expect daytime maximum temperatures from 2 to 4 degrees F. below the city values.” At first glance this statement seems to conflict with the remarks of others. Here the country is cooler than the city in summer, which is contrary to what we have recently reviewed. The following summary may be presented, however: Note the phrase, “with appropriate shade trees” in Landsberg’s statement. This would seem to indicate that where there were no shade trees, the country would be hotter, as we have seen elsewhere. Note that neither Landsberg nor the other eminent authorities should be discounted. Note that Hare’s contention that microclimatology is a very inexact science (which renders it difficult to make comparisons) seems to bear some weight.
A comparison of city and country temperatures can be offered with illustrations of the 1947 temperature figures of McGill Observatory and Montreal Airport at Dorval, P. Q., in Table 41.
Table 41.
Month Monthly av. temp. Differences Mean Daily Range
McGill Dorval McGill warmer Dorval warmer McGill Dorval
Jan. 17.9° F. 16.6“ F. 1.3“ F. 17.7“ F. 18.9“ F.
Feb. 15.6 14.1 1.5 11.9 13.8
Mar. 29.9 29.0 0.9 11.8* 11.3*
Apr. 38.6 38.2 0.4 15.3 15.9
May 51.7 51.4 0.3 15.2 16.0
Jun. 63.6 63.2 0.4 15.3 17.5
Jul. 70.7 71.4 0.7’ F. 14.6 15.9
Aug. 72.0 72.6 0.6 15.6 19.3
Sep. 59.6 60.6 1.0 15.4 19.0
Oct. 56.2 55.0 1.2 15.4 19.8
Nov. 35.1 34.2 0.9 10.6 14.0
Dec. 18.5 16.6 1.9 10.7 11.9
* This is unusual for March. Dorval ordinarily has a greater mean daily range in this month. For example, in March, 1946, the mean daily range was: McGill, 17.1; Dorval, 18.9.
The mean daily range of temperature at the two stations is of particular note in this discussion. It is equal to the mean daily maximum temperature minus the mean daily minimum temperature for the month; and we can see that throughout the year the range is less in the city than in the country, as has been explained in the previous discussion.
Since these are averages we may lose sight of the significance of the differences. Ordinarily it would be advisable to compare the two stations as far as their maximum and minimum temperatures in a 24-hour period were concerned. This was impossible, however, in this case, because the two offices do not record the figures for the same 24-hour period. Consequently, one had to refer again to the comments of McGill Observatory Director Hare for a word-picture of the situation. In summer, he said, providing the sun is shining, Dorval usually registers temperatures which are 2 to 3 degrees Fahrenheit greater than those at McGill; at night or when the sun is obscured by clouds, McGill is 2 to 3 degrees warmer than Dorval. In winter, Hare notes that there is little difference in temperature by day, but McGill is 3 to 5 degrees warmer at night (and may be 10 to 15 degrees warmer, according to Longley).
Architects, familiar with the processes of such temperature changes in cities and towns can sagaciously design and site their buildings.
In city planning, we can use the following methods to relieve the inhabitants from excessively hot temperatures:
supply an abundance of green areas, pools, lakes, etc. position buildings so that they shade one another.
provide for narrow streets which restrict the sun from entering therein. (There should be some ventilation though; and if there are winds it would not be really necessary to adhere to this rule, except in extremely hot desert areas.)
provide for the elimination of hot exhaust gases and smoke from factories and houses.
To retain warmth, the following measures may be taken:
use massive, heat-retaining materials wherever possible, utilize heat from artificial sources for productive purposes, snuggle the buildings against one another.
prevent heat from escaping into space.
The relative effects of colored surfaces on temperatures are given in Table 42.
G. W. Brabham in 1921 made a great many experiments in this field. The general result, notes Brooks, was that black and dark objects took up higher temperatures than white or light-colored objects. He says that in hot, dry climates a non-conducting black surface, such as a cloth, may be 30 to 40° F. hotter than a similar white surface. The percentage difference is noted in Table 42.
Table 42.*
black (assumed as) 100%
dark blue, brown, green 85-90% grey, cement wash, ash, plain metal 75% khaki, red, light brown, pale blue, aluminum paint 70-75% pale colors (straw, cream) 50% white 40%
* after C. E. P. Brooks
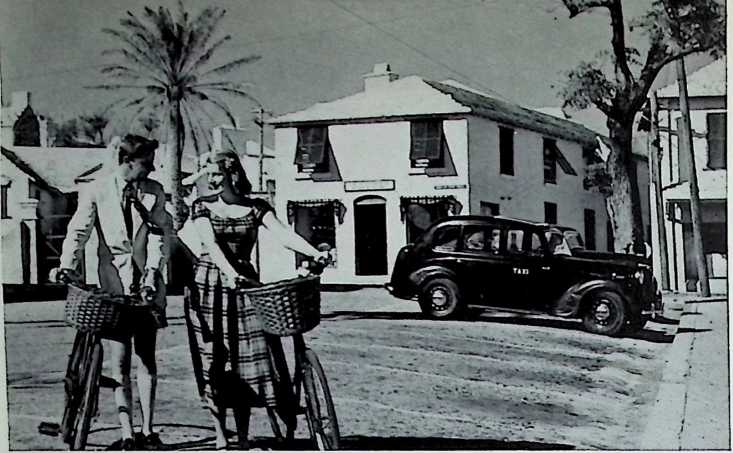
Figure 169 (left). White houses with white roofs in St. George, Bermuda.
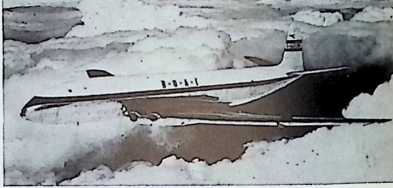 The desired temperature results may be encouraged by applying these colors to houses, although consideration must be given to the materials used in the mixture, as they will have their own heat conductivity characteristics. Also of special significance is the necessity of employing roofs of a fight color in order to minimize the effect of the hot summer sun.
Figure 170. White-halted cabins on planes reduce the heating effects of the sun.
The roofs in Bermuda and the walls of houses, too, are white in nearly every case. Although this island rarely experiences temperatures in excess of 87° F., most of the buildings are suited to the requirements of a hot climate. However, not only are the buildings clothed in white, but so too are the inhabitants, who like those in many sunny regions of the world, sport white attire. (See Figure 169, a scene in St. George, Bermuda.) Most of the airplanes, Bermuda’s main link with the outside world, can be seen in Hamilton (and at other airfields throughout the globe) with cabins hatted by a white paint; this reduces the heating effect of the sun when the craft is at low altitudes or standing on the runway. (See Figure 170, the British Overseas Airways “Comet” jet airliner.)
The human body is an excellent machine for the production of heat, and as such it should not be ignored in the designs of buildings. For this reason Professor W. Bruce has recommended that planners should strive to prevent the loss of heat from the body instead of trying to add heat from the exterior. We can do this by applying adequate reflective material inside a room; thus the heat generated by the body would be reflected back at it and would create a sensation of warmth. In effect, the body would create its own climate.
This method of heating is little known but extremely reliable when conditions are satisfactory. For example, on a night when the temperature was down near zero, and with the windows of his bedroom wide open, a professor of architecture at McGill University slept comfortably with only a sheet of tinfoil as his blanket. Or we may cite the home of architect Kenneth C. Welch, who employed a ceiling of aluminum foil (Figure 171). This reflected both the body heat of the occupants and the solar heat that came in, during the winter, through the wide windows, which were designed in accordance with the principles previously outlined. (For other photographs of this home, see Figures 71, 72, 116, 117, and 118.)
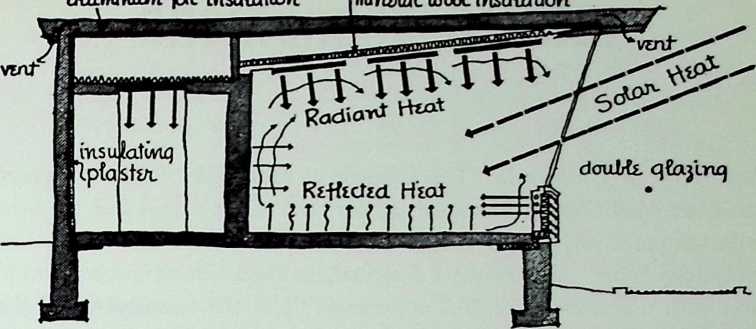
Figure 171. Aluminum foil on ceiling of Kenneth C. Welch home reflects body heat and solar heat, which enters through the windows in the winter.
What is the extent of heat production of the human body? The American Society of Heating and Ventilating Engineers gives the following answer in the 1948 edition of Heating Ventilating Air Conditioning Guide:
Table 43. METABOLIC RATES
OF MEN AT DIFFERENT
ACTIVITIES
in B.T.U. per hour
sleeping 255
awake, quiet 300
seated, at rest 380
standing, at ease 430
walking, 2 mph 760
walking, 4 mph 1 400
[maximum exertion 3000-4800]
The incorporation of this information in the design of heating systems is the job of engineers; however, it is hoped that some of the other possibilities, as suggested in the foregoing remarks, will be realized by architects in their original conception of a building.
¶ related phenomena
According to Longley in “The Climate of Montreal,” “Under average moisture conditions in Montreal, 50 per cent of the people feel the heat with temperatures 80 or above, and 100 per cent with 86 or above. Let us call a day when the maximum temperature is 80.0 or more very warm, and with a maximum of 86.0 oppressive.” Yet the temperature of the air is not the only factor which affects the sense of energy and well-being in humans. The architect should remember that there are other related occurrences: humidity, wind, and radiation.
Only a brief discussion will be offered on the subject of temperature and humidity, for fear of trespassing too much on a matter that can be handled more appropriately by a heating engineer. Furthermore, it is hard to present climatic figures in support of arguments in this category, as will be evident in the course of the next few sentences. However, there is an opportunity here to remind architects of several points.
First, the concept of “effective temperature” must be introduced. This is defined by Brooks as “the temperature of motionless, saturated air which would induce the same feeling of heat or cold in a sedentary worker wearing ordinary indoor clothing as that given by the actual conditions of temperature, humidity and air movement.”
The more formal definition, as proposed by the American Society of Heating and Ventilating Engineers is as follows: “An arbitrary index which combines into a single value the effect of temperature, humidity, and air movement on the sensation of warmth or cold felt by the human body. The numerical value is that of the temperature of still, saturated air which would induce an identical sensation.” In Canada and the United States of America the optimum effective temperature is regarded as about 67° F., but may possibly range from 65° F. in winter to 73° F. in summer. In England the optimum effective temperature is about 60° F.
John Everetts, Jr., a prominent American heating engineer, tells us in Weather and the Building Industry that the optimum conditions for human comfort, according to physiological research, center around an effective temperature of 67° F. This corresponds to a temperature of 76° F. with a relative humidity of 50%. Higher temperatures with correspondingly lower relative humidities, and vice-versa, may be used for the same effective temperature. However, the 76°-50% humidity condition is noted by Brooks as that which will provide the minimum of discomfort.
These effective temperatures of 60° F. and 67° F. may be derived from the sample conditions indicated in Table 44 when the air is moving at the rate of 20 feet per minute.
Effective Temperature °F 60° 67°
Air Temperature, °F. 60 61 62 63 64 67 68 70 72 74
Wet Bulb, °F. 60 57 54 51 48 67 65 61 57 54
Relative Humidity, % 100 76 55 37 19 100 86 59 35 17
* after Brooks
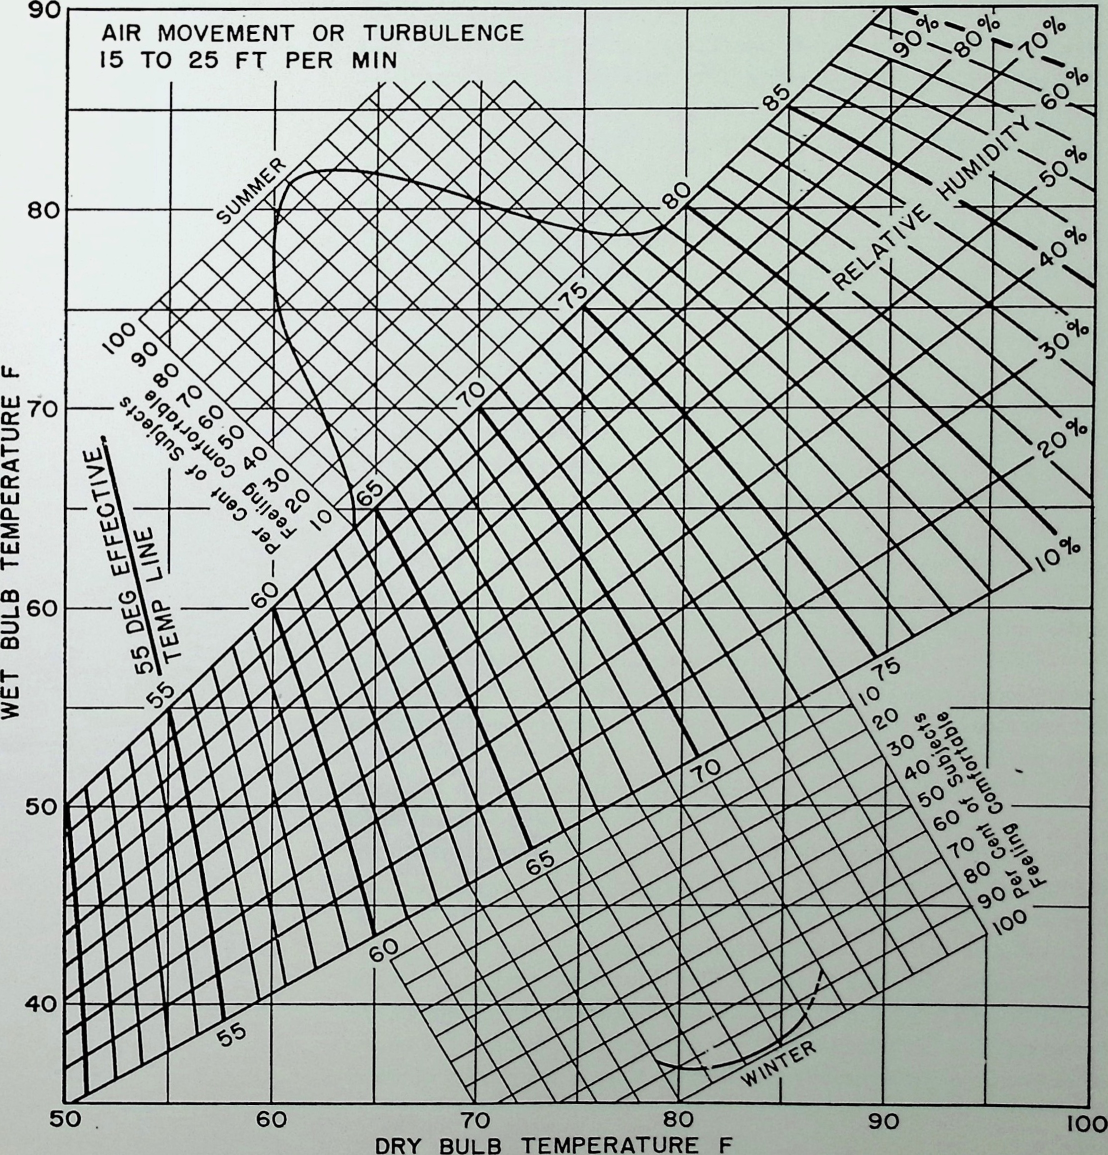 Following this idea, the A.S.H.V.E. devised a chart showing comfort zones for the combination of different dry bulb and wet bulb temperatures with relative humidities. The diagram is reproduced here as Figure 172.
Figure 172. A. S. H. V. E. comfort chart for still air.
These figures and the chart are extremely useful to one who is designing for appropriate heating systems, but in their present form they are not adequate when one wishes to consider existing conditions, as on a site. The same principle applies, however, although caution must be exercised in the way the data is interpreted. For example, we cannot take averages of statistics of relative humidity data and at the same time retain physical meaning for them. Hare notes this illustration (Table 45).
The manner in which this information would have to be applied to existing conditions is as follows: First, record the appropriate data at the site in question each day; from this information each day plot the position on the comfort zone chart; at the end of each season, determine in which part of the comfort zone chart there were the most number of “blobs”this will determine in what category the site falls; design accordingly, or do not build there at all. It would be invaluable if the above method would be used in computing a chart of the comfort zone of various districts in major cities. The above is the only method the author knows by which the results can be obtained. It is laborious but would be an excellent subject for future research in this field.
Incidentally, there are definite differences in humidity alone within very short distances. One example will suffice. O. Stoker, in a spruce forest on the Riesengebirge at Jannowitz, at 10:00 AM, July 16, 1921, found the values of relative humidity shown in Table 46.
The lady with a fan in her hand who attends a garden party on a hot summer day and the Indian who nestled his wigwam in the shelter of a hill both realized the effect that wind can have on the “sensible temperature.” The former found that by waving the plumes in front of her face a slight movement of air was established and she felt relieved momentarily; the latter discovered that by keeping out of the wind the site felt warmer.
Few people will disagree with the above remarks; most realize that the wind does have some sort of effect on their conception of the temperature. Thus we will not labor the reader with a detailed analysis of the physiology of the human body under different thermal stresses. (For further information, however, see sources fisted in bibliography.)
We can physically detect differences by instrumental measurements. Cooling power may be observed by the dry and wet katathermometer invented by Sir Leonard Hill. This is one of a very few instruments that can serve this purpose.
“Many cooling-power formulas have been derived from the katathermometer, an alcohol thermometer with over-sized cylindrical bulb whose rate of cooling from 38° to 35° C. is assumed proportional to the cooling power,” notes Arnold Court in the Bulletin of the American Meteorological Society.
But in order to obtain a practical measure of “sensible temperature,” Paul A. Siple and Charles F. Passell, who were with the United States Antarctic Service in 1942, developed formulas to determine the “wind chill” of the atmosphere. They developed a formula in the course of observing quite accurately the freezing time of a cylinder of water
Table 45.
Temperature Relative Humidity
60’
[30°]
45° average
50%
[50%]
50% average
Absolute Humidity
- gm./kgm.
- [gm./kgm.]
- gm./kgm. average would not be the case for 45*-50% humidity conditions. It would actually be 3.2 gm./kgm.
in a widespread stand of oxalis between myosotis
in the open forest
84%
67%
59%
Table 46. (after Geiger)
exposed to different combinations of air temperature and wind velocity in the atmosphere. The formula adopted was:
Ko = [(v X 100)5 + 10.45 - v] (33 - To) where
Ko = total cooling in kilogram calories per square meter per hour v = wind velocity in meters per second Ta temperature of air in degrees Centigrade.
This idea of wind chill had originally been proposed by Siple as early as 1939, in a thesis for Clark University, and has since been adopted by many sources in and outside the United States in order to depict the “feeling” of the atmosphere under various conditions of wind and temperature. In addition to other organizations, the Canadian Army has used it notably on Exercise Muskox in the Northwest Territories, 1946, part of which the author had the opportunity to observe. Colonel P. D. Baird, whose name we have previously mentioned in Chapter 2, was the commander of this expedition and is quite familiar with this wind-chill concept by first hand experience in the Arctic!
Knowledge of wind chill is of particular value to military men because it expresses the rate at which the body of a naked person would lose heat if exposed to the given conditions. It would tell them how fast their soldiers (even though they are clothed) will freeze. In fact, they would freeze, actually, when cooling exceeds between 1200 and 1600 calories per square meter per hour; that is, when the wind chill is between 1200 and 1600.
The formula just indicated shows that at a given temperature the wind-chill factor increases most rapidly at the lower wind speeds. Perhaps this indicates that the formula is unreliable at low velocities. Yet, it is significant to note, as an instance, that when the thermometer is at zero degrees a 50 mph wind has a wind-chill effect that is three times as great as that at zero mph; and a temperature of °F. at zero mph has about the same wind chill as a temperature of +50°F. at 50 mph.
These particular figures, of course, apply only to heat losses of humans; but both architects and engineers should realize the principle involved because an effect along similar lines might take place on buildings. This is indeed borne out by the Minneapolis-Honeywell Regulator Company, among others, who have noted in one of their brochures that when the outside temperature of the air is +30°F. and the wind is at 30 mph, the heat loss on the windy side of a building is the same as it would be if the temperature were °F. with no wind!
It may be deduced from this that it is extremely important to keep the wind off a building under certain circumstances; that is, when we want to reduce the cooling power. We may stop this by sheltering the building in accordance with the methods outlined in the chapter on wind. Also, the heat engineers tell us that there are several layers of air near the surface of the building which act as insulating barriers to a certain extent because they are almost motionless and heat is transferred by conduction, not by convection. It is imperative that this be preserved too; as shall later be mentioned in greater detail, baffles could be placed on the surface of the building at stated intervals in order to prevent the wind from destroying these films of air.
Above the 91.4°F. point the “wind-chill” chart would become a “wind-warmth” chart because additional wind at these temperatures would have the effect of adding excess warmth to the body. This will not apply to buildings unless the surface of the building is at 91.4°F. itself; but the principle applies in certain cases, and there is a distinct architectural value in having this knowledge at hand.
One fact must be emphasized here: increased wind velocity rereduces the air temperature very little. It is the power of the wind to cool surfaces that plays such an important role.
A note of caution comes from Court in his paper previously mentioned: “Such a formula applies only to simultaneous conditions of wind and temperature. Because wind chill is not a simple sum or product, use of average conditions in its computation may lead to very erroneous results. A -wind-chill value obtained from average temperature and average speed (for a month, for example) will not be necessarily the same as one obtained by averaging the wind-chill values computed for one or more pairs of readings on each day. For example, the lowest temperatures in any locality always occur with calms or very light winds. The following figures indicate the possible error involved in using computations:
averages for
Temperature, °F. 0
-20
20
-60
0
842
value com-
Wind, mph 40
Wind Chill (Siple) 1769 2116
The average of these three wind-chill values is 1576, but puted from average temperature and wind is 2116, or 34 per cent more than the true value.”
One exception to the cooling effect of wind has been reviewed under the discussion of the effects of outgoing radiation. When the slightest breeze is set up at night, the thermal stratification that is common in the hours of darkness is upset; thus a cool layer of air near the ground will be mixed up with the warmer air above. Therefore, under certain circumstances the architect might want to catch the wind.
More of this will appear later. However, it is suitable to mention at this point that Ram das has done considerable work on the correlation between gradients of temperature and wind velocity. He has investigated this matter for different time intervals during the day, different height intervals and different seasons, and has recorded his results in “Micro-Climatological Investigations in India” and in other papers.
How have people adopted the wind-chill idea, unconsciously or otherwise, in their building practices? According to sociologist Delphine Dickson of McGill University, in parts of Comer Brook, Newfoundland, “Climate sometimes outweighs social considerations, especially in poorer neighborhoods. When a houseowner cannot afford to finish or paint all sides of his dwelling, he will complete the weather side (i.e., the windward aspect) rather than the other quarters.” The wind-chill effect is also recognized by Arctic builder George Jacobsen, who provides most of the insulation on his designs on the windward side.
“On a cold day, with no wind blowing, while standing in the sunshine, one may feel perfectly comfortable but, when a cloud passes over the sun, one may instantly feel much cooler. The cloud acts as a shield to interrupt the radiant heat from the sun. The change in feeling of comfort is due to the instant change in rate of heat loss from the body caused by the shielding effect of the cloud. A shielded thermometer under the same condition would register no change in temperature.”
This expresses the manner in which radiation influences one’s sense of comfort. To a certain extent we have already covered this subject of radiation. Yet we must include here a few more words on the manner in which it affects temperature and how we can measure it.
This concept has been termed “sol-air temperature” by Professors C. O. Mackey and L. T. Wright, Jr., of Cornell University. Writing in Heating, Piping and Air Conditioning they said, “Briefly, the sol-air temperature combines the effects of air temperature in the shade, solar radiation incident upon a building surface or net radiation emitted by that surface to a cold sky, absorptivity of the surface, and wind movement.”
These gentlemen devised a “sol-air thermometer” to gauge this temperature. They described this instrument as being “in the form of a cube; resting upon the base at the center of the cube is an 8 in. cube of cork. The horizontal and four vertical faces of this cube are faced with aluminum foil; four curtains of aluminum foil are then hung from frames … . to create four air spaces of width on each face. In this way, considerable thermal resistance is placed in the path of heat flow between exterior faces of the instrument. This puts each exterior face of the meter in heat exchange relationship with its exterior surroundings only. With this arrangement, the exterior faces of the meter will assume and maintain their respective sol-air temperatures. It should be emphasized that the surfaces of a building do not assume the sol-air temperature, commonly, because of conduction of heat away from these surfaces toward the interior or from the interior toward the surfaces. The temperature indicated by the meter is not the temperature that would be assumed by a building surface, but is very close to the sol-air temperature.”
This true sol-air temperature is obtained by formulas, which, to avoid confusion, we shall not present here.
Table 47.
Observed Sol-Air Temperatures for Solar
+:------------------+:--------------+:------------------------------------+
| Eastern | Air Temp. | Absorptivity of 1.0° F. |
±------------------±--------------±------------------------------------+
| Standard Time | Shade | Horiz. Vertical Surfaces Facing |
| | | |
| | °F | |
±------------------±--------------±------------------------------------+
Surface North East South West
11:30 am 50 95 61 66 108 59
11:45 am 49 89 58 65 109 55
12:00 noon 50 92 61 63 112 57
12:15 pm 52 97 64 63 121 66
12:30 pm 50 88 61 59 115 66
12:45 pm 52 92 62 59 112 73
1:00 pm 51 87 61 61 110 78
1:15 pm 52 90 61 56 109 82
1:30 pm 51 88 60 57 105 84
1:45 pm 53 94 66 65 111 94
2:00 pm 54 88 66 61 102 92
2:15 pm 53 86 63 61 106 96
2:30 pm 53 82 62 61 102 97
2:45 pm 54 79 63 61 98 97
3:00 pm 53 76 62 59 94 101
3:15 pm 55 76 62 61 93 107
3:30 pm 57 74 62 61 91 101
3:45 pm 56 56 56 56 57 62
Anyway, with the last sentence of the above quotation in mind, we may examine some of their sample figures showing the top and side temperatures of a sol-air thermometer on October 11,1945, in Ithaca, N. Y.
As far as this volume is concerned, the above table conveys two points: It confirms our observations, as discussed in the chapter on the sun, that at certain times of the year, i.e., in the winter half, the south wall of a building receives much more radiation than the other surfaces in the midday hours; and it shows the constantly changing temperatures that would occur at the five exposures of a house (i.e., four walls and the roof). In the words of Mackey and Wright: “At noon on the day of the test, the external surface of a building with solar absorptivity of nearly one would be gaining heat as if exposed to an air temperature of 92 F if horizontal and 112 F if facing south, while it might be losing heat as if exposed to an air temperature of 63 F if facing east, of 61 F if facing north and of 57 F if facing west; all this occurs with an actual temperature of the air in the shade of 50 F. There is a sol-air temperature for the human body, of course; on the day of the test, students without topcoats were comfortable with an air temperature of only 50 F.”
Consequently, we can employ such a sol-air thermometer to determine what will be the relative temperatures at different sides of a proposed house and at different times of the day, providing enough readings are taken to provide reliable averages. From the data received the architect might be able to provide for the whims of a client or the actual function for orienting rooms according to the sol-air temperature. As the author has not been fortunate enough to use one first-hand, comments cannot be offered on this device.
The combination of temperature, wind, and radiation produces the effect which is known in England as “Equivalent Temperature,” but this term is rarely used on this side of the Atlantic. When humidity is added to the above threesome, the French call the combination “Resultant Temperature.”
We shall not study the way in which such groups of climatic elements can influence the building all at onceonly the way we can provide for such circumstances; in our climate it will usually require a certain amount of heating in the building. There has been developed in the United States, and has been used successfully on a number of buildings, a device known as a “Weatherstat” manufactured by the Minneapolis-Honeywell Regulator Company, and which corresponds automatically to the presence of air temperature, radiation, and wind velocity and direction. The “Weatherstat” is in reality very simple; it is a small cylinder, about four inches high and three inches in diameter, in which there is a heat filament. When the elements of the weather cause this filament to change temperature, the heating system elsewhere in the building must respond accordingly in order to keep the filament from getting any warmer or colder. This is in turn tied up with the heat outlets in rooms on the exposure concerned; thus the device can control heat losses on any exposure of a building that carries it.
Figure 173 shows a “Weatherstat” mounted on the face of building. Figure 174 is a cutaway of the same instrument; “H” indicates the heating filament, and “B” the thermostat. As temperature changes occur, the Weatherstat signals the control panel, illustrated in Figure 175, and a steam valve is opened or closed. In the panel are seen, from left to right, top row first, a switch for marking the desired heat each day, a pick-up switch for heating the building quickly in the morning, a switch to permit manual operation if desired, a power switch, and a time clock.
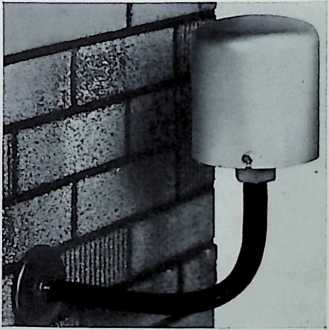
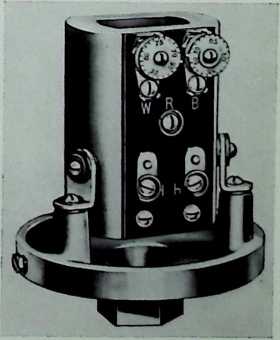
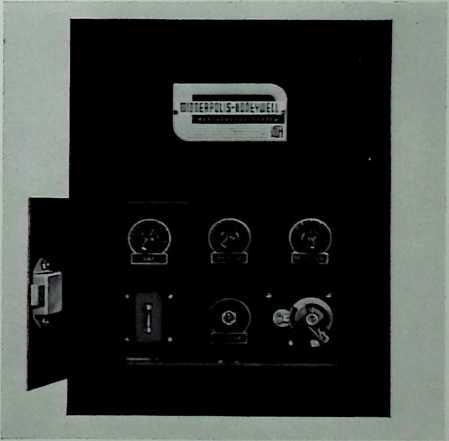
Figure 173 {above). Weathersial, Minneapolis-Honeywell Regulator Company, controls heat loss on any exposure carrying it.
Figure 174 {right). Cutaway of Weatherslat.
Figure 175 {above). Control panel of Weatherstat.
Of course, to the human being the combined effect of temperature, wind radiation and humidity presents a feeling of comfort or discomfort. Accordingly, the average person might term the weather either severe or mild. Whether a device like the “Weatherstat” is used in buildings or not, it is generally advisable in climates that experience severe weather of one sort or another to design buildings with a mininum of exterior surface area; in particular, they should have the smallest possible amount of high heat-transmitting materials, as, for example, single-paned glass.
Kansas City architects Kivett and Myers have done just that in a synagogue they built in Omaha, Nebraskaa town which experiences extremely severe winters. By using long, thin windows (Figure 176), they obtained just as much light as if they had used larger glass areas (Figure 177), and by doing so they saved on heat loss. The glass areas are also protected from the wind, to a certain extent, and thus the wind chill is also reduced. This arrangement, in addition, helped to build an atmosphere of religious significance, unlike the traditional large windows of stained or decorated glass which tend to divert the attention of the congregation during prayer from the proceedings adjacent to the altar. Here, all daylight is concentrated directly upon the pulpit; in the opinion qf the architects this, together with the interesting ceiling which slopes up towards the ark, has proved to be a potent effect on the establishment of a proper ecclesiastical atmosphere.

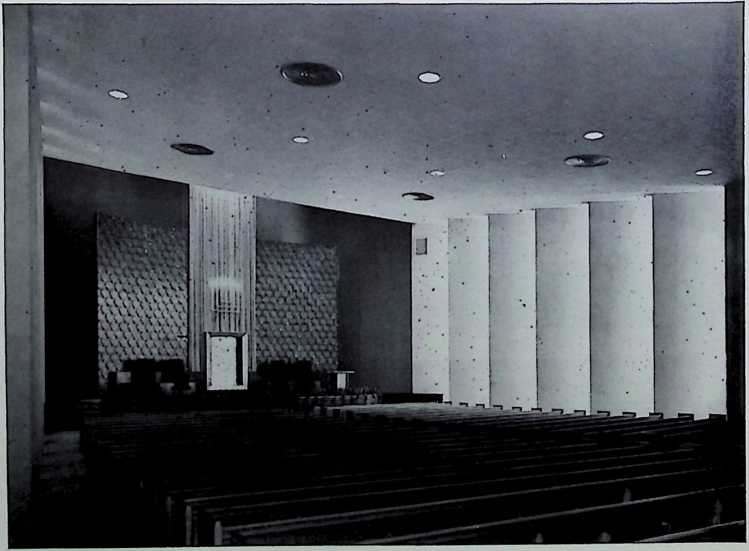
Figure 176 (left). Exterior view of windows on wall of synagogue in Omaha, Nebraska. Figure 177 {below). Interior view. Kivett and Myers, architects.
¶ WIND
wind (wind; orig., andnow poet., archaic, or dial., wind), n. [AS.] 1. Any movement of air, usually restricted to natural, horizontal movements; air in motion with any degree of velocity. Cf. [Beaufort’s scale,]{.smallcaps} Illusl. 2. Hence, a strong or destructive movement of air; a wind storm. 3. A direction from which the wind may blow; a point of the compass; esp., one of the cardinal points, which are often called the four winds. 4. Air artificially put in motion by any force or action; as, the wind of a cannon ball; he pumped some wind into the tire. 5. Air impregnated with a scent, as of game; hence, scent or, figuratively, intimation of something; used in phrases; as, he caught wind of their plans. 6. Power of respiration; breath; as, he had the wind knocked out of him. 7. Mere breath or talk; idle words; as, his arguments are but wind; also, conceit; vain self-satisfaction. 8. A current of air conceived as imparting motion to something, or influencing or carrying along something; as, it’s an ill wind that blows nobody good. 9. Often pl. Wind instruments, collectively; also, the players of these instruments. See WIND INSTRUMENT; cf. STRING, „., 4 b: PERCUSSION INSTRUMENT. 10. Air or gas generated in the stomach or bowels; flatulence. 11. Boxing Cant. The pit of the stomach, where a blow may paralyze the diaphragm and cause temporary loss of breath or other injury.
in the wind, a Stirring; moving; afoot, b Slang. Intoxicated; esp. in the nautical phrase, three sheets in the wind.to have in the wind, to have the wind of. To be on the scent of.to sail close to the wind, a To sail with the head directed as nearly as possible to the point from which the wind blows, b To manage economically, c To approach vulgarity, indecency, indiscretion, or the like, in speech or conduct.up the wind. In a direction counter to the wind.
(wind), <?. I. 1. To expose to the wind; to dry by exposing to the wind or air; to ventilate; Dial. Eng., to winnow. 2. To perceive or follow by the scent; to scent; as, the hounds winded the game. 3. To render scant of wind by violent exertion; to put out of breath. 4. To rest, as a horse, in order to allow the breath to be recovered.
¶ measuring the wind
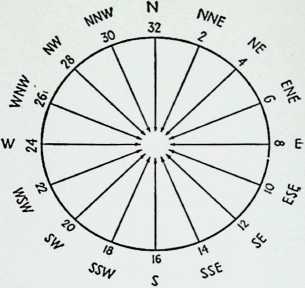 Architects are mostly interested in two aspects of the wind: the direction from which it comes and its speed, both of which combine as the velocity.
Figure 178
According to Hare, and this has been verified by the author, one of the best ways of determining the direction of the wind is without using any instruments whatsoever (except possibly a compass, if one’s orientation is not known). The observer merely has to stand facing the flow of air; when the sensation of temperature of his ears is the same on both sides he is facing directly into the wind. Thus, if the observer is facing true north, a north ■wind is present. The direction is always taken as that quarter from which the wind blows. It is expressed by letters or numerals in the manner indicated in the sketch in Figure 178.
Other primitive methodsand these are the typesthat architects will use most frequently, as most will not purchase elaborate equipment are:
The use of the wind vane, with which device everyone is familiar. Except, note that the vane points into the wind.
The observation of smoke streams. Where elaborate wind flow analysis is desired, smudge pots or smoke candles can be set up on the site.
The observation of the vapor of one’s breath in winter.
The observation of the direction of flags, fluttering tree leaves, etc.
More detailed measurements may be effected by accurate equipment, but they involve only the method of recording. A wind vane attached to a recording apparatus indoors is employed at all weather observatories.
The speed of the wind over land is normally given in feet per minute, meters per second, or miles per hour. Weather records mostly are given in the latter units.
The architect again needs no equipment to obtain a fair idea of the wind at a given time, on a particular site. In the words of Petterssen  “It is possible to estimate the speed of the wind without the use of any instrument. The skilled observer will be able to estimate the force of the wind from the action that it has on certain objects, such as smoke, flags, and sails. When this is done, the wind speed is referred to what is called the Beaufort scale. This scale, which was introduced by Admiral Beaufort in 1805, is still in international use, and wind velocities that are measured are converted to Beaufort numbers in order to have a uniform standard.” In Table 48 is the Beaufort scale of wind force, with specifications and velocity equivalents.*
* By permission from Introduction to Meteorology by Sverre Petterssen. Copyright, 1941, McGraw-Hill Book Company, Inc. Except, in the case of the table speeds given by Petterssen in km./hr. and knots omitted in favor of speeds in feet per second.
The relationship between the various units in Table 48 is:
1 mph = 88 feet per minute meter per second
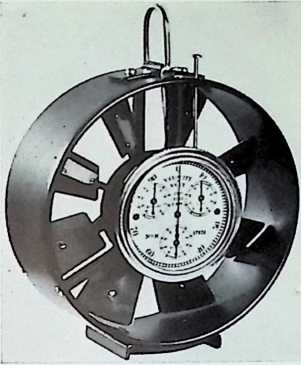 George Kimble and Raymond Bush contend in The Weather the reliability of smoke as an indicator of the "wind under certain circumstances. They say: “In addition to the locality factor, which obviously affects the direction of smoke issuing from a low chimney more than it does the wind vane, there is the fact that smoke apparently moving to the right from a chimney in the north may be coming from NW, W or SW. Provided there is a breeze, its indicative value is probably greatest in the early morning before the sun has had a chance to set up turbulent, gusty up-and-down air currents which, especially in hot weather, are capable of producing quite strong local winds bearing little relation to the direction of the regional wind.” However, because, as they say, smoke is a good indicator of the microclimatic wind, it is particularly favorable as a gauge for airchitectural purposes.
Figure 179. Short and Mason portable anemometer.
Those still desiring to use wind-measuring equipment may select from the following:
Portable Anemometer. An anemometer is a gauge for measuring the strength of the wind and is especially useful to architects when manufactured in portable form. A photograph of an instrument manufactured by Short and Mason, Ltd., of London, England, is seen in Figure 179.
TABLE 48.
**m./sec.** **feet/min.** **miles per hour**
0 Calm Smoke rises vertically 0.3 less than 88 less than 1
1 Light air Wind direction shown by smoke drift but not by vanes 0.6-1.7 88-264 1-3
2 Slight breeze Wind felt on face; leaves rustle; ordinary vane moved by wind 1.8-3.3 352-616 4-7
3 Gentle breeze Leaves and twigs in constant motion; wind extends light flag 3.4-5.2 704-968 8-11
4 Moderate breeze Dust and loose paper; small branches are moved 5.3-7.4 1056-1408 12-16
5 Fresh breeze Small trees in leaf begin to sway 7.5-9.8 1496-1936 17-22
6 Strong breeze Large branches in motion; whistling in telegraph wires 9.9-12.4 2024-2376 23-27
7 Moderate gale Whole trees in motion 12.5-15.2 2464-2992 28-34
8 Fresh gale Twigs broken off trees; progress generally impeded 15.3-18.2 3080-3608 35-41
9 Strong gale Slight structural damage occurs; chimneypots removed 18.3-21.5 3696-4224 42-48
10 Whole gale Trees uprooted; considerable structural damage 21.6-25.4 4312-4928 49-56
11 Storm Very rarely experienced; widespread damage 25.5-29.0 5016-5896 57-67
12 Hurricane above 29.3 above 5984 above 68
Note: This table gives speeds at 6 m. above ground; hence the figures may conflict with some which are
This device is 4" in diameter and 1" thick; revolving blades instantly repond to the slightest movement of air. In general it was found very useful for all purposes that an architect might have in mind, such as determining relative wind forces at different sites around buildings. Dials immediately measure the distance travelled in feet; thus with the aid of a watch (preferably one with a second hand) one can readily calculate the speed of the wind averaged over a given time. (A correction factor of a few feet per minute must be added to or subtacted from the resultthe maker supplies the necessary tables.)
Clip Anemometer. One of the more familiar devices seen around meteorological stations is the three-cup anemometer. This instrument invented by an Irish clergyman in the mid-nineteenth century, gives a continuous record through an electric circuit to a cylinder clock installed indoors. It consists of three cups mounted on arms around a central pivot; these spin with a velocity proportional to the wind speed. However, unless the architect is prepared to take observations over a continued length of time it would hardly be worthwhile to set up such extensive apparatus as this.
Wind-Giistiness Recorder. The wind is not continuous, but is of a fluctuating nature. Because of the momentum set up by the cup anemometer, or even by the portable anemometer, accurate measurement is not made of the individual bursts or lulls in the wind flow by these methods. Gusts may be of prime importance to the architect. Maximum winds recorded (for example: those that might affect the design strength of materials) are therefore shown not on an anemometer but on a windgustiness recorder, sometimes referred to as a pressure-tube anemometer. This again is elaborate equipment for an architect to set up. It consists of two pipes, one of which is kept facing the wind and the other is connected to a system of suction holes on a vertical tube. The difference of pressure set up between the two tubes is recorded by a pen on a disc that is calibrated according to the velocities reached.
The fact that the wind seems to behave in gusts, rather than in a free flow, was verified by the author on the afternoon of Wednesday, June 20, 1951, during the course of a McGill matriculation exam which he was invigilating. A portable anemometer of the type just described was set up in an open window of a room in the west-wing of the Arts Building, McGill University. It was observed during a two-hour period, that the longest gust of air was for only 40 seconds. The average was for 10 to 15 seconds, followed by a 5-second pause in the airflow. If there had been a continuous stream of air, most of the students probably would have felt much more comfortable and might even have written a better examination.
¶ design and the wind
Why worry about the wind in planning? It is because the wind can be both the friend and the enemy of man under different circumstances. Here are some examples:
Advantages
The wind ventilates
The wind evaporates moisture and dries surfaces
The wind cools
The wind is a source of power
The wind warmsby preventing cold air sinking at night
¶ macrodimatic wind
Disadvantages
The wind spreads smoke, odors
The wind assists in the penetration of water in surfaces
The wind cools
The wind assists in snow accumulation
The wind requires us to strengthen constructions to resist it
The processes of the atmosphere are these: the sun heats the earth, warming it up in certain spots more than in others; the different temperatures give rise to unequal pressures; variations in pressure induce winds. As a result, large wind patterns are set up over the globe. These are patterns that may be termed mean winds, because for the greatest percentage of time at a given place they come from a given direction. In the northern hemisphere the winds tend to travel clockwise and outwards around high-pressure areas (called “anticyclones”), and counter-clockwise and inwards around low-pressure areas (called “cyclones”).
The mean winds in any given region can be deduced very easily from normal sea level pressure maps, similar to those published by the U. S. Weather Bureau. Daily winds can be calculated from daily sea level pressure maps, a sample of which is seen in Figure 180.
Data concerning regional windslet us say, macrodimatic winds can be recorded in the following ways for any site or station:
Percentage frequency of wind by directions, per month and year.
Average wind speed in miles per hour by directions, per month and year.
Predominance of winds by directions, per month and year; i.e., most predominant, second most predominant, etc. (This is a modification of the first type.)
Relative wind speeds by directions, per month and year, i.e., strongest, second strongest, etc. (This is a modification of the second type.)
Average number of days with strong winds, by months and year, grouped according to wind speeds.
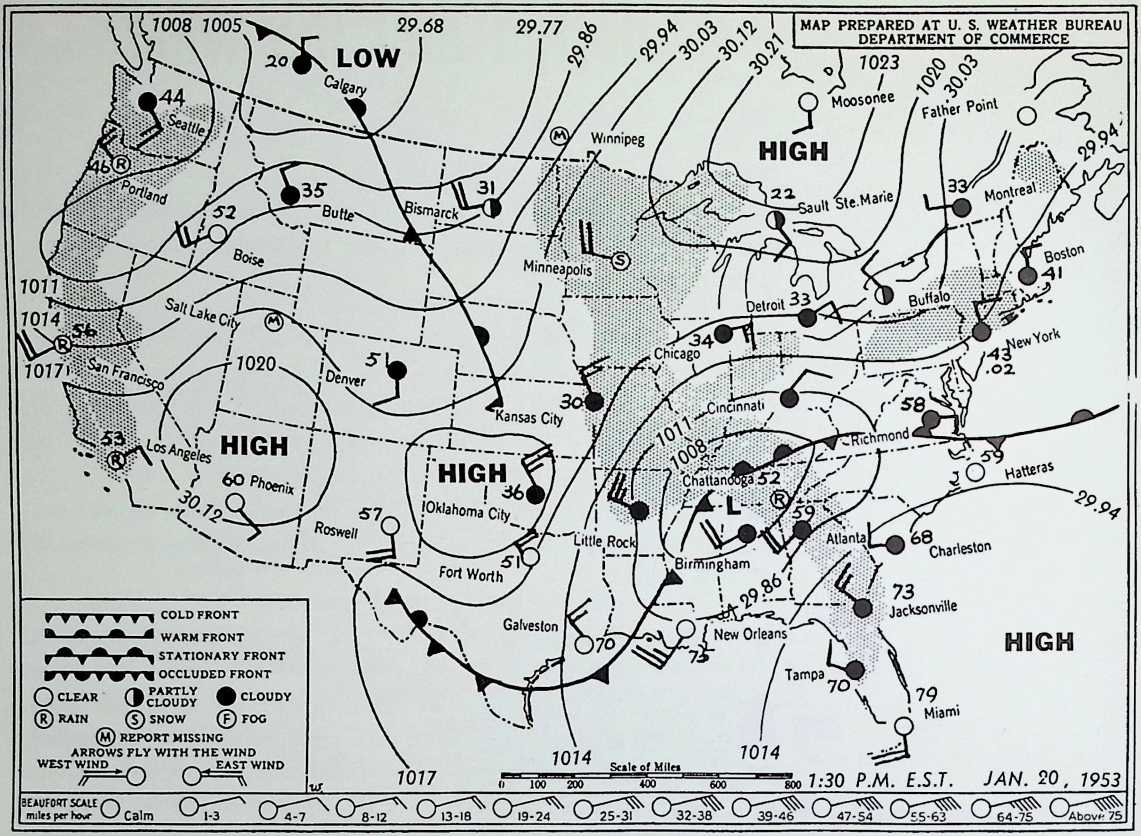 It is best, when taking readings of the general wind conditions for a large area, to position oneself in unobstructed surroundings. Otherwise, microclimatic winds would be recorded. Airfield weather stations, therefore, because they are in the open, normally record wind directions that are more representative of general conditions than are the readings of city stations, where microclimatic conditions are liable to prevail insofar as the wind directions and speed are concerned. More of this later. Incidentally, the macroclimatic wind as observed at the ground is not quite the same as that aloft, either in speed or direction. That at higher levels is termed the “geostrophic wind,” but shall not be discussed here.
Figure 180. U. S. Weather Bureau map for January 20, 1953, as printed in The New York Times.
The effect of season is realized from such tables. Buildings may be oriented or designed differently according to whether they will be used all year or only in specific months. How the macroclimatic data may be modified and why it may be favorable or unfavorable to harbor the wind will become evident when the microclimatic phenomena are reviewed.
Deductions for planning purposes may easily be made from the information obtained from such foregoing data. This data will often be all that is needed for a sensible decision on orientation or siting. Yet the statistics can be broken down further; in fact, very often in order to tell
1014
1017
1011
HIGH
85
Minneapolis
90
30.27
29.94
7023
New Orleans
Tampa
7020
7077
7074:
29.86 29.77
29 94 29.86
Detroit80
70H 7074
75/^Mqnt!ea \ \
[1:30 P.M. E.S.T. JUNE 29, 1953]
- V V V V V M COLD FRONT
**MAP PREPARED AT U. S. WEATHER BUREAU [DEPARTMENT OF COMMERCE ]{.underline}**29.94 1014
LOW 7"
Los.Angeles
74
BEAUFORT SCALE [miles per hour v-x Calm]{.underline}
Figure 181. U. S. Weather Bureau map for June 29,1953, as printed in The New York Times.
58
O65
^HIGH
MoOSOnee father Point
IVlnnipeg
29.94
Gre^^l.
^Smafck
Sauli Ste*ane
$3r> A. T ^,r
^\ an^sca
3//^eC,
i
HIGH
ButlijO.
Denver
95
HIGHr£
Kansas
8L>
Cincinnati
A wa&
iA nirhrr
Chattanooga 92
THIGH
1008
D 0 a WARM FRONT
V v\ STATIONARY FRONTLTV\J V\J VklOCCLUDED FRONT
O [clear (DcloJ^ • cloudy]
[® rain (s) snow]{.smallcaps} (F) [fog]
[(m) report missing
arrows fly with the wind
westwind _]{.smallcaps} EAST WIND
O O
XorU
30.72
Charleston HIGH
[Seal* of M0e«]{.underline}
0 100 200 [400]{.underline} [600]{.underline}
the architect what he wants to know, they have to be dissected further. Why? Just one example will suffice: suppose one wants to catch the wind in the bedrooms at night during summer. Where is the breeze going to come from between eleven in the evening and seven in the morning, on the average? Only data in the minutest detail will tell. That is why the author prepared as an example, while writing this book, tables and graphs illustrating the diurnal variation of wind for Montreal. This necessitated the abstraction of 23,328 figures on file at the Dominion Meteorological Office, Department of Transport, Dorval, P.Q. The analysis required an additional 8,640 calculations. All these were done by hand with the aid of an electric computing machine; how easy it would have been if a punchcard analysis had been made. The graphs naturally vary for each city, so no example is given here.
The frictional force of the earth decreases with elevation. During the day, a 3000-foot promontory, as the summit of a mountain, would receive winds of a higher speed than would points lower down because the strength of the wind in the free atmosphere would be more evident. The highest wind speeds in New England, for example, have been recorded at the top of Mount Washington, New Hampshire, its highest peak. Con-
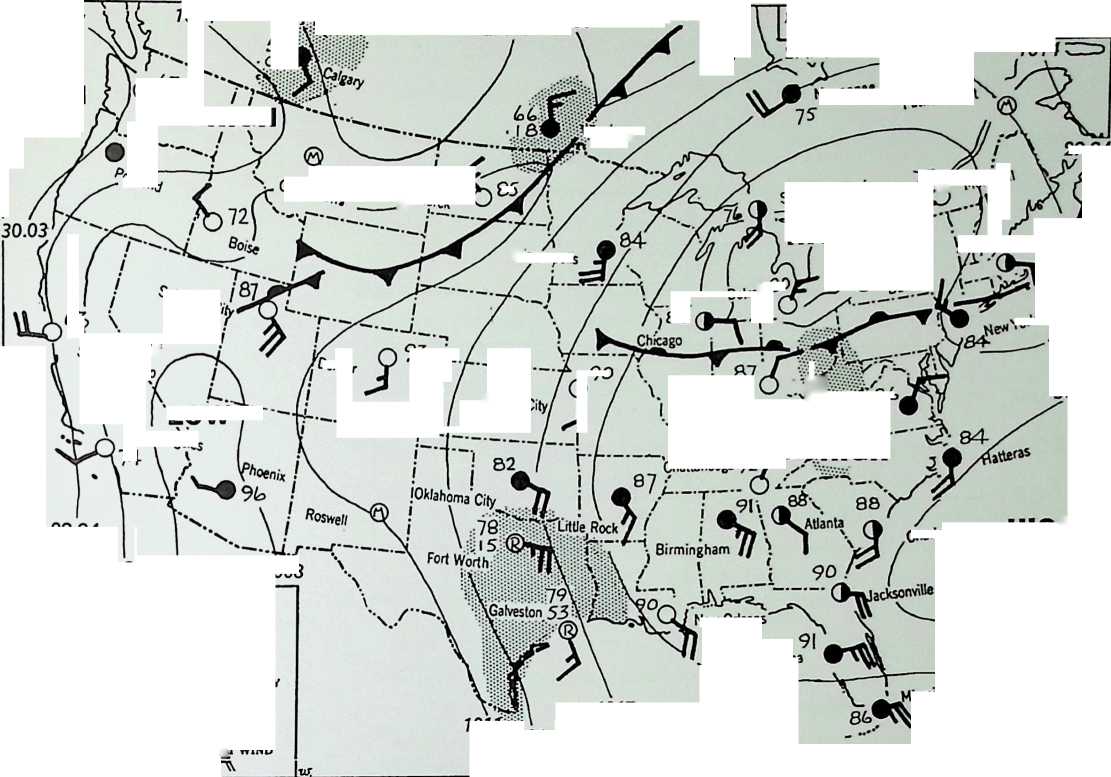


sideration of altitude in problems of siting with regard to the macrocli- matic wind must thus be undertaken. Petterssen gives the following normal variation of wind with height:
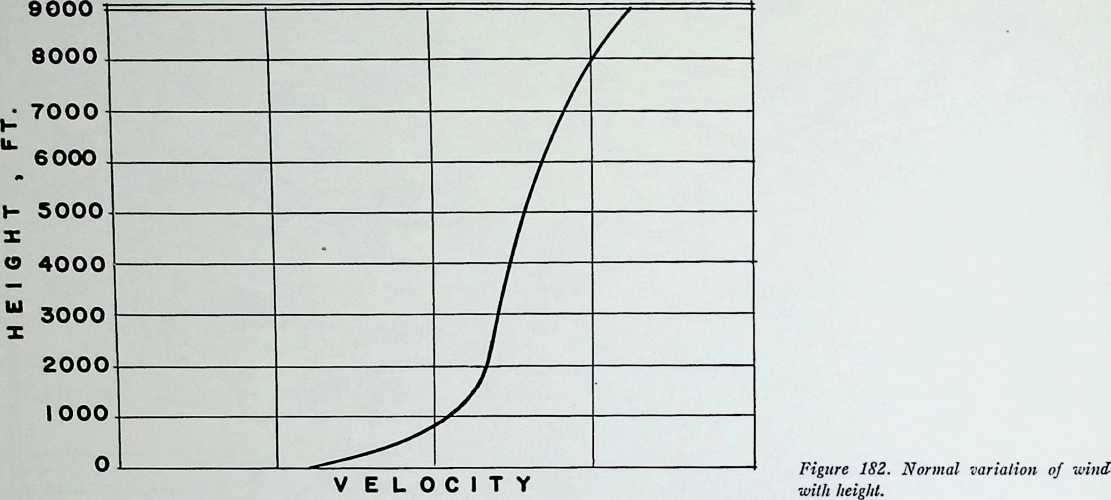
¶ microclimatic wind
The wind of the microclimate may be a modification of the macroclimatic wind or a local wind set up by certain physical phenomena, resulting mostly from an effect of topography, and known usually by the term “katabatic.” Both these types should be kept in mind throughout the ensuing argument.
Many architects will find it particularly valuable to be aware of the fact that it has been foundindeed we have already mentioned it in a previous sectionthat the wind tends to become much weaker at night, providing there are no katabatic winds present. The reader will recall the discussion that illustrated the stratification of air resulting from the nighttime outgoing radiation. “The air clings to the ground. . . .” When the sun warms the ground at day the stratification is upset and there is a certain degree of turbulence; hence wind is induced.
Remarks David Brunt, in Weather Study, on this matter: “The speed of the wind at the ground attains its highest value at 2-3 p.m., the time when the temperature is about reaching its maximum value, and falls off to a low at night. On clear nights a fight or moderate wind will usually fall off to a calm. If average wind speeds are evaluated for a lengthy period of time, independently of the weather, the form of the curve shows a pronounced maximum in the middle of the afternoon, and a minimum at night, the difference being of the order of 5 miles per hour. “At greater heights above the ground the form of the diurnal variation changes, and at 1,000 feet, at the top of the Eiffel Tower, the wind speed shows a maximum at night and a pronounced minimum at about 10 a.m.”
Just as in the case of the macroclimatic wind when land and water are heated or cooled to different temperatures by virtue of their qualities, so the microclimatic or local winds behave, although on a smaller scale. An airchitectural conception of such flow of air is particularly desirable when building at the shore of a large lake, bay, sea, or ocean.
In summer, during the daylight hours, the earth heats up considerably in comparison with the water. The hot air rises, and cool air from the water must flow in to replace that which is uplifted. (A similar case will later be observed concerning the town and country.) At night the air over land cools; the temperature above the water is then warmer and the process is reversedthe breeze is observed flowing from the land to the water. However, in this case the temperature gradients may not be as great as in the daytime and the wind may often be almost at a standstill. Kimble and Bush in The Weather enlighten us as follows: “In North America, the sea breeze seldom extends more than 15 to 20 miles inland :[11] and unaided by the prevailing wind, it seldom blows more than 10 to 15 miles an hour, or extends more than 2,000 to 3,000 feet above the surface. All the same, these sea breezes can be very persistent, even in face of a prevailing wind blowing from the opposite direction. If the pressure gradient is weak enough, they can reverse the prevailing wind, but in doing this they use up so much energy that they are below normal in strength. On other occasions they may exactly neutralize the prevailing wind, and so give calm conditions most of the day. When the sea breeze agrees with the regional. … wind it simply reinforces the latter during the daytime. In every case the effect of the sea breeze is at its maximum about three in the afternoon, and dies down about sunset.”
In the section on the effect of topography on temperature, there was described the process of cold air collecting at night and flowing to the lowest points in the land, according to its physical status as a mass heavier than the air of a higher temperature. The winds produced by such air movements are termed katabatic defined as follows:
Rata batic (kitd bit Ik), adj. [Gr. katabatikos, adj. fr. katabalnein to go down.] ileteorol. Of or pertaining to the downward motion of air, as in air drainage induced by surface cooling. Winds thus formed are called, generically, fall winds, gravity winds, or katabatic winds.
By permission. From Webster’s New International
Dictionary, Second Edition Copyright, 1934, 1939,
1945, 1950 by G. & C. Merriam Co.
It may be desirable in summer to catch such a wind, as it will provide cool air, for example, in bedrooms at night. This can be achieved by placing the building perpendicular to the line of flow. According to Haurwitz and Austin, the speed of the cold-air movement that may be expected is in the order of 1 meter, or a little more than 3 feet, per second.
TABLE 49.
**proceeding northward** **proceeding southward**
Victoria Avenue and
(S. side of mountain)
1. SE comer Ste. Catherine Calm E
2. SE comer Sherbrooke St. Calm N
3. 200 N of Sherbrooke St. NW N
4. SW comer Windsor Avenue Calm Calm
5. SE comer Cote Ste. Antoine Calm NW
6. NE comer Westmount Avenue NW NW
7. SE comer The Boulevard NW N
(N. side of mountain)
8. NE comer Sunnyside Avenue SE SE
9. SW comer Mira Road Calm SE
10. SW comer Queen Mary Road s S
Macrodimatic wind recorded at Dorval Airport at the same time: NE at 16 mph.
down-slope winds “which have potential energy with respect to the valley floor and which are fed from the central reservoir of heat.” The coarsely dotted area represents the area of down-valley wind which is to be imagined as flowing at right angles to the plane of the paper.
C. F. Marvin in the Monthly Weather Review, 1914, has confirmed this analysis of Geiger. We have also seen in the discussion of temperatures that the wannest part of a slope is not at the bottom or top, but at the middle. So his argument would seem to bear some authenticity.
These down-valley winds are much stronger than those ordinarily induced by the flow of air downslope. Geiger says: . . velocity may be more than 1.5 m. per sec. which we have set as the upper limit for cold air streams. In vertical extent it sometimes builds up to several hundred meters. …In the Wisper valley, which opens into the Rhine from the east at Lorch, a down-valley wind sets in with great regularity in the evening shortly after darkness comes. This wind attains a velocity of 3, or sometimes even 4, m. per sec. It represents the downflow of nocturnal cold air out of the cool Wisper valley into the relatively warmer main valley of the Rhine.”
Petterssen has pointed out that not only <7own-slope winds may be brought forth by the influence of topography but «/>-slope winds too. “On warm days, it is often observed that the winds tends to blow up the slopes during the day… … This is due to the fact that the mountain slopes are warmer than the free atmosphere during the nighttime. Since the cold air tends to sink and the warm air tends to rise, a system of local mountain winds develops with an upslope motion during the day.”* Although no mention has been made of this phenomenon by the other leading authorities it would be worthwhile to investigate if such a condition exists before commencing any designing or building operations.
When air behaves in such a mannerwhether it goes up or down a hill it does not proceed in an even flow, but rather in bursts. They are similar to the gusts previously described only in that the -wind occurs sporadically. There is a distinction. In the case of the bursts, the interruption in flow is due to a “building-up” of the cold or warm air mass before it gets enough momentum; in the case of the gusts, the sudden increase in flow is a result of eddies caused by some object placed in the path of the wind.

* By permission from Introduction to Meteorology’ by Sverre Petterssen. Copyright 1941. McGraw-Hill Book Company, Inc.
Figure 183. Nocturnal down-valley winds.
Accordingly, if one is desirous of catching this breeze in a building that is, the breeze that comes in “bursts”one must design the structure itself very carefully in order to maintain a continuous flow. This can be done if the problem is entertained with exactitude. We may be anticipating a future paragraph here, but the idea is to create a venturitube effect out of the area in the building to be ventilated by natural means.
“The most violent wind of the free atmosphere is to some extent slowed down by the ground. Directly at the surface the air is entirely, or almost entirely, at rest.” This statement by Geiger is almost self-explanatory. It is a mere follow-up of the conditions that we have observed in the macroclimate. Nevertheless, some illustration may be desirable. Figures 184 and 185 show two photographs taken by the author of a snow formation at the fence surrounding the old tennis courts behind the Redpath Library, McGill University.
Snow, as will be seen later, is a very good indication of the wind flow around surfaces, and here it clearly expresses the velocity of the wind at different heights near the ground. (It also indicates the possible effect of the upsweep of air at the fence. See a later paragraph.) We can refer to Brooks for additional reflections on this subject: “The average wind velocity increases with height above the ground. The rate of increase depends on the nature of the surface, being least above water surfaces or smooth grassland, and greatest above broken irregular ground or surfaces broken up by buildings. It is also greatest at night and in cold weather, and least on hot sunny afternoons.” He provides us with Table 50, which gives the speed at any height as a ratio to that at 33 feet (10 meters), the standard elevation of anemometers at meteorological stations :
We might inject the remark here that dust circulation is a function of the wind and the time of day. At the time of the nocturnal inversion dust drops down to the ground. If a slight wind then occurs, these loose particles of dust and sand would be carried away and may be particularly annoying to anyone at the lower levels of a house. Thus for this reason the first floor may be an undesirable one for nighttime occupancy. Of course, there is always the all-day round annoyance of the possibility of snow piling up against first-floor entrances and windows. Photographs illustrating this will be seen in Chapter 5 on precipitation.
We have just seen in Brooks’ remark that the ground surface has an influence on the -wind. In general, the rougher the surface, the thicker will be the layer of air film which clings to the ground. Le Corbusier has thus probably accomplished more than one purpose when he provided gardens atop the roofs of his dwellings: the layer of air trapped in the blades of grass and other plant cover undoubtedly reduced the wind-chill effect on that horizontal plane. For this reason alone, architects might be wise to follow Corbusier’s idea.
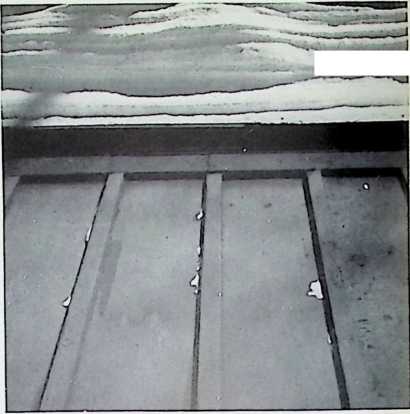
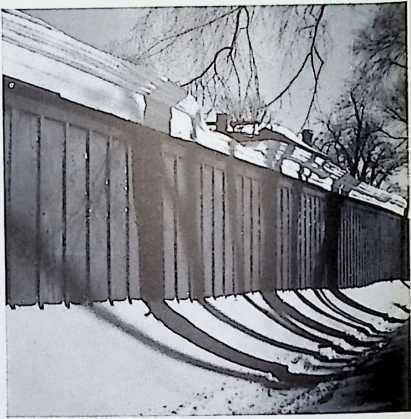 Indeed, Carlos Lazo, former President of the Mexican Society of Architects (and now Minister of Communications of Mexico), through
/ (
Figure 184 (.lop) and Figure 185 (bottom). Snow formations as sculptured by the wind.
his own approach, designed a delightful home with a grass roof at Sierra Leona 374, Mexico City. This building (Figure 186) has been described as illustrating the rebirth of the humanistic feeling in design. The plan is in ring-form, somewhat Eke a squashed doughnut with a bite removed from one small part to form the entrance. The patio in the center is topped by the skylight visible in the figure. This skylight is, in turn, surrounded by the vegetation on the roof, which not only has the effect of reducing wind chill, as noted above, but of preventing excessive temperatures due to the solar influence.
Above 3 feet or so the wind is not influenced by the nature of the ground itself as much as are some of the elements like temperature and humidity. Yet the wind is influenced by vegetation, which plays an important role architecturally speaking.
A heavy stand of forest is one of the most effective barriers against the flow of air. Geiger did some measurements on pines; anemometers were placed at different heights. Average results for a 188-hour period are given in Table 51. Thus, about 40% of the upper air wind hits the inhabitable region of a forest.
According to some European observations, quoted by Zon in “Climate and the Nation’s Forests,” published in Climate and Man-.
TABLE 50. VARIATION OF WIND WITH HEIGHT
Height (feet) 5 10 15 20 30 40 50 60 100 150 200 300
Ratio to 33 feet .73 .81 .88 .92 .99 1.03 1.07 1.1 1.21 1.29 1.35 1.46
+:---------------------------+:------------------------------+:------------------+:---------------+
| | | | |
±---------------------------±------------------------------±------------------±---------------+
| Height of anemometer m | Position of anemometer | Average m/sec | wind speed |
| | | | |
| | | | mph |
±---------------------------±------------------------------±------------------±---------------+
| 16.85 | Above the tree tops | 1.61 | 4.83 |
±---------------------------±------------------------------±------------------±---------------+
| 13.70 | Upper limit of tree tops | 0.90 | 2.70 |
±---------------------------±------------------------------±------------------±---------------+
| 10.55 | In the tree tops | 0.69 | 2.07 |
±---------------------------±------------------------------±------------------±---------------+
| 7.40 | Upper part of trunk space | 0.67 | 2.01 |
±---------------------------±------------------------------±------------------±---------------+
| 4.25 | Within trunk space | 0.69 | 2.07 |
±---------------------------±------------------------------±------------------±---------------+
| 1.10 | Over the forest floor | 0.60 | 1.80 |
±---------------------------±------------------------------±------------------±---------------+

Figure 186. Grass roof on home in Mexico City. Carlos Lazo, architect
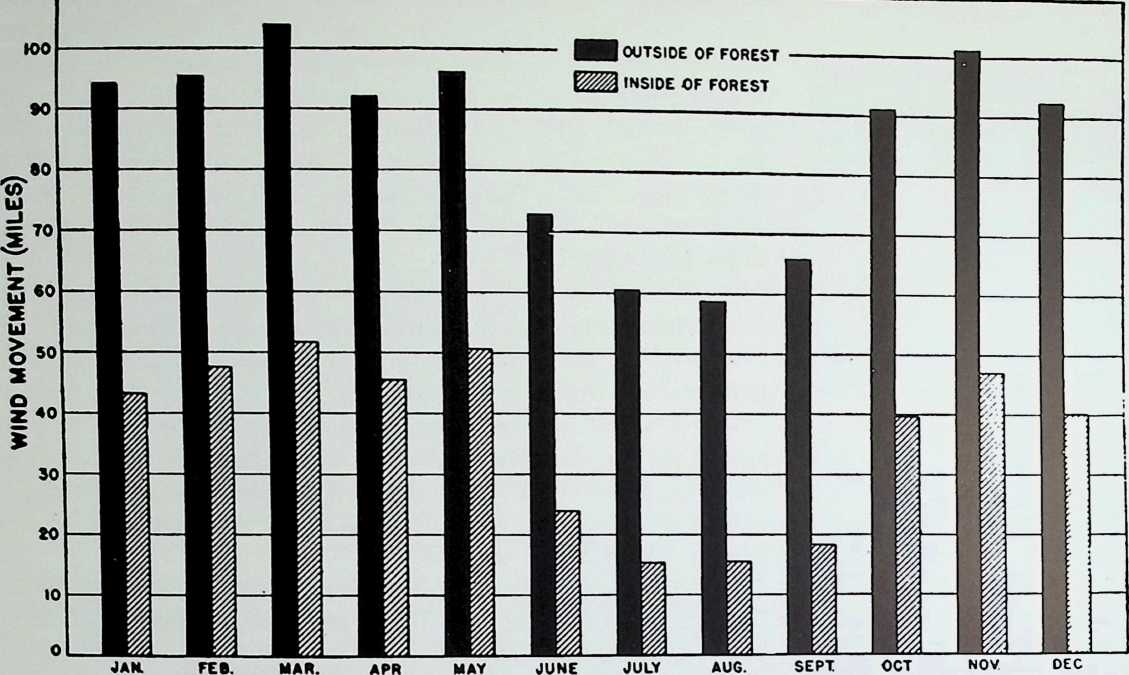 . after wind has penetrated into a dense forest to a distance of some 100 feet, it retains only 60 to 80 percent of its original force, while at a distance of about 200 feet, it has only 50 percent, and at 400 feet, 7 percent.” And Hursh and Connaughton in the Journal of Forestry say that with respect to a forest in Tennessee, “Average wind velocity was 7 to 10 times as great in the denuded zone in winter, and 34 to 40 times as great in summer.”
110
Figure 187 (above). Average daily wind movement 15 feet above the ground inside and outside a maple-birch-beech forest.
It is no wonder that the Indians, according to the Venerable Mere Marie de 1’Incarnation, as we have seen in the historical section, left their stone houses in the winter to live in cabins in the woods. Architects of today should perhaps persuade their clients to do likewise.
Notice should be given to the fact, however, that such results can only be obtained when the trees are in full leaf. Thus, if the wind reduction is desired in winter, as it probably will be in most cases, one should ignore all but the evergreen variety of forest. Even then, a difference of up to 1.5 mph wind speed can be observed in conifers of different spacings and compositions; a mixed pine-spruce forest seems to stop the wind much better than do pine woods by themselves.
The seasonal difference in the effect of the forest in retarding the wind is emphasized by records taken in the Upper Peninsula Experimental Forest, Dukes, Marquette County, Michigan, from 1927 to 1936. Diagrammatically illustrated by Zon in Climate and Man they are shown in Figure 187.
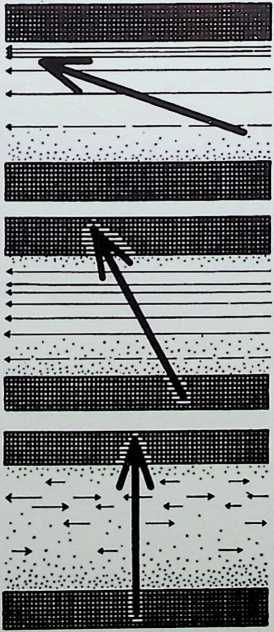 This naturally leads us into a review of the wind effects in clearings and on the fringes of forests. We may turn to Geiger once more for inspiration in this subject. In this diagrammatic conception (Figure 188): “The heavy arrow represents the wind aloft, over the cutting; the small arrows, the wind in the cutting. The stronger the winds, the closer the lines. Dotted areas indicate dead air spaces. If the wind is blowing perpendicular to the course of the cutting the wind gusts above the cutting are indicated by opposing pairs of arrows.” The wind whirl shown in a clearing formation is like that shown in Figure 189.
Figure 188 (below). Wind motion in a forest cutting in relationship to the upper wind.
Thus if the architect is aware of the direction from which the prevailing wind comes, he can estimate (although it would be advantageous to check, also) from which quarter blows the “prevailing whirl” and can design accordingly. The similarity of this effect to that in courtyards of buildings will be mentioned later.
What is the effect if one builds at the border of a forest stand? There are two extreme possibilities as far as the wind is concerned: the side can be considered windward or leeward, according to which face the structure is placed. If one builds to the side that usually receives the prevailing winds perpendicularly it would be advisable, if the effect of the air flow is to be minimized, to build right up against the forest. The justification of this is as follows: at the edge which faces the wind, the currents are forced upward. “The consequence,” according to Geiger, “is a dead-air zone at the ground, estimated at II stand-heights in breadth.” Above this elevation the wind speed is somewhat greater on account of the compression of the lifted stream lines.
The leeward side of a forest may offer less protection than the windward side in many cases, contrary to what is generally supposed. This is a result of the fact that severe eddies are often created on the side away from the direct wind. Quotes a Danish report by J. O. V. Irminger and Chr. N0kkentved which we shall refer to once again later on: “During the severe summer gale on the 8th and 9th of July, 1931, when a velocity of 28 m/sec. was registered (measured over one minute) in the harbour of R0dby, Denmark, a great many trees were blown down, but without exception on the leeward side of the woods. Further, the top was blown off a big tree which stood on the leeward side of a farm, while a row of big trees on the windward side of the same farm sustained no injury.” However, the lee side does of course have some sheltering effect. Considerable investigation has been performed on this aspect of the problem. Essentially, the matter is very similar to that of wind-breaks which have been employed by many people, especially in rural.districts, throughout the world.
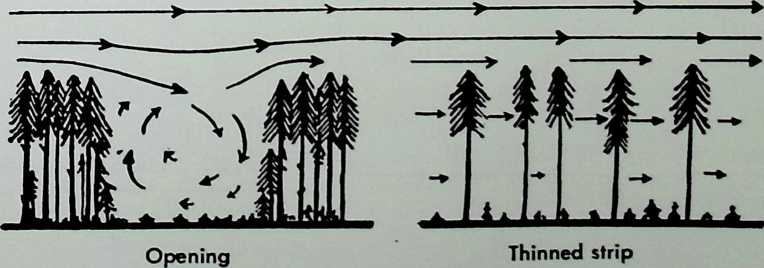
Figure 189. JIiW movement in an opening and in a thinned strip.
Here is what the various authorities comment on the influences of an existing shelterbelt:
R. Geiger: “The effect of a wind break hedge extends not only down wind but to a smaller degree also against the wind. The wind velocities, measured to establish the protecting effect, are given in per cent of the undisturbed open land speed, which is observed far outside the protected region. The range of the protecting effect is not indicated simply in meters but generally the height of the protecting hedge is used as the unit; a hedge two times as high offers protection for double the distance. But there is no agreement about the height at which the wind should be measured and with what reduction of the open land speed the protecting effect is still considered as sufficient. The wind speed, diminished in the protected zone, changes continuously to that over open land. The statements, therefore, fluctuate within widest limits. To give an idea of the order of magnitude it may be said on the basis of measurements of M. Woelfle in Germany, and W. Nageli in Switzerland that to the front the protecting effect extends against the wind to from 5 to 8 times the height of the protecting hedge, behind it to 25 to 35 times its height. The extensive measurements of the Danish Health Society and C. E. Flensborg resulted in:
At the distance of (m) 5 10 20 40 60
Wind speed (%) 30-40 45-55 60-70 70-80 85-90”
C. E. P. Brooks: “Four zones may be distinguished in the variation of -wind speed on either side of a wind-break. In [the figure] the horizontal scale represents horizontal distances up-wind and down-wind from the barrier, expressed as multiples of the height of the latter. The vertical scale represents wind speed as a percentage of the speed in the open plain away from all obstacles. Up-wind from the barrier (zone A) the wind speed begins to decrease at a distance equal to about six times the height of the barrier. Immediately behind the latter (zone B) the wind speed falls to a very low figure of 15-40 per cent, of the free wind, the lowest speed being at an average distance of three or four times the height. The denser the barrier, the nearer the minimum is to it, the smaller the wind speed, and the steeper the following rise. The third zone, C, extending from about six to about twelve times the height, is that of
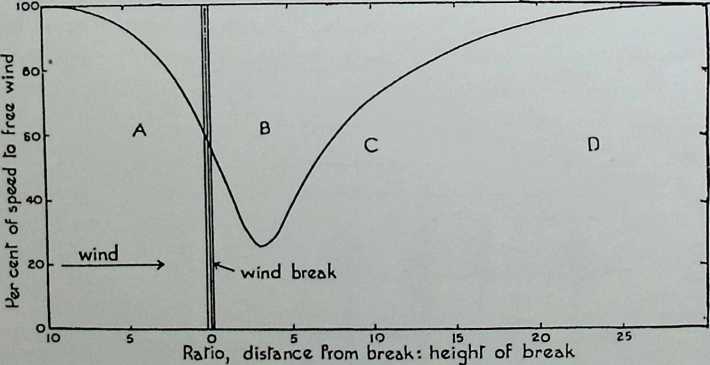
Figure 190. The four zones distinguished by Brooks in the variation of wind speed on either side of a windbreak.
rapid recovery of wind speed to a value of 75-80 per cent, of that in the open. Here the wind is often turbulent, the turbulence being greater the steeper the rise, i.e. the denser the barrier. The turbulence brings downdrafts of air which sometimes flatten crops, and for this reason too dense a wind-break is a disadvantage. Finally, in zone D the wind gradually returns to its undisturbed condition; the latter is usually reached at a distance of twenty-four to thirty times the height.
“These ratios appear to be almost constant, irrespective of the height of the wind-break and the strength of the wind. For example, a belt of trees 50 feet high protects five times as large an area as a hedge 10 feet high, and if at any spot a wind of 20 m.p.h. is reduced to 10 m.p.h., a wind of 10 m.p.h. will be reduced to 5 m.p.h. (Bodroff, however, thinks that the sheltering effect increases with the strength of the wind.) If the wind is very turbulent the reduction factor is smaller. This probably accounts for the fact that in a succession of similar wind-breaks the second and subsequent ones are sometimes less effective than the first. According to Nageli, the protection extends to and slightly above the level of the top of the wind-break, decreasing little with height above the ground, but I should expect the recovery to open conditions to be rather more rapid in the upper levels.”
John Walker: “Studies reported by the Soils Research Laboratory, Dominion Experimental Station, Swift Current, Saskatchewan, show that a fairly dense shelterbelt twenty-five to thirty feet high may be expected to reduce wind velocity to a distance of four hundred feet to leeward. At two hundred feet the wind velocity will be about 50 per cent of that in the open. An open belt fifteen to twenty feet high will cause a reduction in wind velocity of approximately 25 per cent at a distance of two hundred feet to leeward.
“Tests conducted by the Soils Research Laboratory, Swift Current, at the Forest Nursery Station, Indian Head, showed that a singlerow white spruce belt twenty-five feet high brought about a significant reduction in wind velocity, e.g.:
-
At fifty feet from the belt the wind velocity was 20 per cent of the wind velocity in the open,
-
At two hundred and fifty feet the wind velocity was 75 per cent of the wind velocity in the open.”
Parker Anderson: “While snowstorms rage at 30 miles an hour, the family living inside a well-established shelter belt is exposed to only a five- or six-mile-an-hour wind. Walks, drives, and the farmyard are well protected from snow. Fruit trees, flowers, shrubs, and ornamental trees, frequently broken by wind, snow, or sleet, are protected throughout the winter.”
Raphael Zon: “Through literally hundreds of varied observations, it has been established that shelterbelts, placed at right angles to prevailing winds, afford a protection on the leeward side to 20 times the height of the treesthat is, with a belt 50 feet high, to a horizontal distance of 1,000 feet. The wind movement does not abruptly return to its initial velocity at this distance, but some measurable reduction has been recorded equal to 50 to 60 times the height of the trees, or 2,500 to 3,000 feet with a 50-foot-high belt. It is clear that some slight effect can be carried from one shelterbelt to another provided the spacing between them does not exceed about 40 times their height. Furthermore, measurements have shown that considerable protection is afforded on the windward side, to a distance of 3 to 5 times the height of the belt. It is, therefore, entirely conceivable that if a large area were protected with shelterbelts at intervals of about two-fifths of a mile, there would be a considerable reduction of the wind movement over the area as a whole. . . .
“Tree belts reduce soil blowing. The ability of wind to move and pick up soil particles varies at least as the second or possibly the third power of the velocity. Consequently, even as little as a 10-percent reduction may mean the difference between considerable soil blowing and very little. A 50-percent reduction in its velocity would practically keep the wind from moving soil particles. . . .
“In winter, by reducing wind velocity 50 percent and consequently reducing heat losses by radiation and infiltration, shelterbelts may reduce fuel consumption in farmhouses as much as 30 percent. Such results were obtained -with test houses, some of which were protected by shelterbelts and other exposed to the wind, the indoor temperature being maintained at approximately 70°F.”
Hursh and Connaughton: “Intensive studies of the past four years show that belts of trees 50 feet high, a quarter of a mile apart, and with an occasional row or narrow belt at right angles to the main series will reduce wind movement over the intervening land by 10 to 50 percent. A belt of optimum (not maximum) density may reduce the movement over adjacent ground as much as 70 per cent.”
J. E. Davis: “Effective protection is afforded by a good windbreak to a distance approximately eight times its height. Thus, a windbreak 40 feet high should almost completely check the wind for 320 feet to leeward, and buildings and lots in this area should have adequate protection. Some influence of the windbreak may be felt at a distance up to 20 times the height of the trees, but in Illinois it is best to keep principal buildings within a 300-foot distance.”
How to plant and what to plant in a wind-break is described by various sources as follows:
R. Geiger: “It goes without saying that the width and the arrangement of the protecting hedges are of importance. A hedge which can be a little blown through by wind seems to be even more advantageous than a solid wall; this can be justified by aerodynamic considerations. Further, a level area is always assumed. Naturally, in a territory slanting away from the wind, the effect reaches farther.”
C. E. P. Brooks: “The best form of wind-break is a belt of mixed trees five to ten yards wide, which contains at least three rows of trees and is moderately dense. Spruce, which was formerly used extensively in Europe, is too dense while young, and as it ages it tends to develop bare
trunks beneath the crowns, allowing the wind to sweep through near the ground. Deciduous trees alone are too permeable in winter -when they lose their leaves. The best compromise is a mixture of the two, which should be managed in such a way as to form a barrier of equal permeability from the ground upwards. The height should be as uniform as possible, except at the ends or at any unavoidable gaps, where the level should be tapered off to avoid the formation of turbulent eddies. Wind-breaks should of course, be planted at right-angles to the locally prevailing winds.”
John Walker: “From a practical viewpoint depending on conditions on the individual farm, field shelterbelts need not be closer to one another than 30 or 40 rods. Where road protection by field shelterbelts is aimed at, in addition to protection of fields, crops, and animals, the distance from the road boundary to the field shelterbelt should be 100 feet or more. Growth near the ground level is most essential if benefits are to be realized to the fullest. Trees should, therefore, not be pruned.
“Planters of field shelterbelts must abide by provincial regulations as they relate to tree planting near provincial trunk highways. In Manitoba field shelterbelts established for highway protection are located an average distance of 150 feet from highway boundaries. In Saskatchewan according to a highways regulation no trees may be planted closer than 300 feet to a highway boundary without special permission from the Saskatchewan Department of Highways, Regina. . . .
“A popular and effective type of field shelterbelt contains only one row. Caragana or maple may be planted alone. Many planters favour a single row containing caragana at one foot apart, and for every sixth, eighth or tenth caragana, a maple or other tree is substituted. The object of this substitution is to eventually secure greater height in the field shelterbelt. In the older field shelterbelts of this type trees substituted for caragana are forging ahead, especially maple and ash.
“Some very effective single-row field shelterbelts composed entirely of maple and ash have been established. The maple is popular because of its rapid rate of growth and its capacity to recover from injury caused by insects, winter cold and other factors. Drought resistance and freedom from attack by insects are the valuable characteristics of the ash. For areas inclined to be wet at certain seasons of the year acute willow is strongly recommended. There is every reason to believe that Manchurian elm will be suitable for planting in field shelterbelts. Trees other than caragana are best planted four feet apart in the row.
“For planting in slightly alkali spots Russian olive, buffalo berry, and Manchurian elm may be tried. . . .
“A number of farmers with established field shelterbelts favour those with more than one row of trees. In deciding the number of rows to plant the following points merit consideration. A belt of more than one row is more difficult to cultivate and keep free from weed. On the other hand, where more than one row of trees is planted, there is greater snow accumulation, better protection, slower melting of snow in spring, economy in land use because of marginal cultivation, and more likelihood of a natural forest floor being built up. . . .
“The ideal direction in which to plant a field shelterbelt is at right angles to the prevailing winds.”
Parker Anderson discusses provision for a snow catch and snow trap outside the main shelter belt. A snow catch consists of two rows of low trees or tall shrubs whose purpose it is to catch or retard the snow, causing it to pile up in the snow-trap area between it an the main shelter belt. This will be mentioned further in Precipitation. But he continues, “The main shelter belt should be 80 feet wide and should consist of eight rows of trees. There should be two rows of fast-growing, shortlived, broad-leaved trees, and four rows of hardy conifers. Such a combination insures the best year-round protection. The fast-growing trees not only give early protection but also serve as a nurse crop for the longer- lived, more permanent trees. Rows 3 and 5 should consist of such fast-growing trees as box-elder, cotton-wood, Norway poplar, northwest poplar, Canadian poplar, or hardy willows. These trees should all be planted 6 feet apart in the rows, and the rows spaced 10 to 12 feet apart. All trees planted in the grove should be alternated or staggered to check the wind.
“Rows 4 and 6 should consist of more hardy, more permanent long-lived trees, such as ash, elm, hackberry, and soft maple.
“Leave a space of 12 feet between the last row of hardwood trees of Row 6 and the first row of pine, Row 7. When hardwoods grow too close to pines, they are apt to sideshade them and hinder development. This often results in deforming the pines or leaving open spots in the rows.
“Rows 7 and 8 should consist of more hardy pines, such as western yellow pine, jack pine, Norway pine, or Scotch pine, depending upon the soil and climatic conditions. The species have been named in order of preference. The pine trees should also be planted 6 feet apart in the rows, and the rows 10 to 12 feet apart. These trees should also be alternated or staggered. …
“A space of 16 feet should be left between the last row of pine and the first row of spruce. Spruce is quite tolerant of shade; the trees tend to grow dense and spread out. If too close to pine trees, the pine are likely to be damaged or deformed by sideshading. The spruce, Rows 9 and 10, (consisting of Colorado, Black Hills, or white spruce), should be planted 6 feet apart in the rows, and the rows 10 to 12 feet apart. Such spacing assures as impenetrable a wind and snow barrier as possible in the shortest time.
“Spruce has dense foliage maintaining its limbs from the ground up, 12 months of the year. This growth characteristic prevents dust and snow storms from filtering through the belt. Spruce are therefore the best species for the inside row. Locating the spruce on the inside where it can be seen by the family is also one of the first steps in home beautification. Spruce and pine have foliage all the year round, and therefore provide the greatest winter protection and summer beauty.
“Close spacing of all trees, as in this plan, forces them to grow taller faster, and, consequently, shade the ground more quickly, thus killing off competing weeds and vegetation.”
 Alberta Department of Agriculture: “Keep your shelterbelt planting at least 100 feet from any buildings to hold snow drifts away. Next consider the kind of trees you will grow, the number of rows you will plant, the distance apart of the rows and the spacing of the trees within the rows. Conditions vary. . . Local conditions will govern your decision in these respects. . . Evergreen trees such as spruce and pines are the nearest approach to the ideal for windbreaks. They provide shelter and beauty in winter as well as in the summer.”
M. A. Thorfinnson: “Field shelterbelts are usually effective in checking soil drifting to a distance of about 20 times the height of the tallest trees in the shelterbelt. However, the effective distance varies with length and density of the barrier, velocity of wind, and soil type. A series of field shelterbelts across a farm would result in more effective control. . …
 “If the boundary is a highway . . . shelterbelts should be 100 feet or more away from the center of the highway.”
Figure 191 {top). Typical arrangement of Norway spruce windbreak on north and west sides of farm buildings. This windbreak conforms to the standard recommendations of the University of Illinois. Figure 192 (.bottom). Twenly-seven-year- old Norway spruce windbreak. Farm buildings are completely hidden. Note heighth of windbreak in relation to fence posts.
J. E. Davis: “To prevent dead-air pockets around buildings in summer, and to minimize the piling of snow on buildings and walks in winter, the windbreak should be set not closer than 50 feet from buildings, and 100 feet is a better distance if room is available. Where possible, the end of the windbreak should extend at least 50 feet past the line of the last building to be protected. . . . The most effective and most easily arranged windbreak is in the form of an L . . . with the point to the northwest [i.e., for Illinois conditions.] The legs of the L may be broken to make way for farm lanes, but the windbreak should not be broken near the point, where northwest winds may sweep through directly to the buildings.”
Davis suggests that evergreen trees are the most satisfactory for Illinois conditions. Spruces and firs, he says, form an almost solid barrier to the wind because of their dense-branching habit. Pines are all right when height at an early date is desired, but they should be used in conjunction with other trees, as they do not break the wind so effectively.
Evidently, after the windbreak has been planted it is very important to maintain the trees by proper pruning and other treatments. A discussion of this will not be entertained at this point, as it is not primarily within the architect’s jurisdiction as a planner. Information, however, can be obtained from the departments of agriculture in most states and provinces.
The effect of topography on the production of katabatic and up- slope winds has been thoroughly examined. Now we shall review the influences of land formations on an existing flow of wind.
It mil be remembered that in the case of the windward side of the forest there is a convergence and uplift of the wind streamlines and on the leeward side a calm area. A similar phenomenon occurs with respect to hillocks. (See Figure 193.)
And here is what Haurwitz and Austin describe: “The streamlines are crowded together on the windward slope, especially along its upper portions and, as the upper sketch . . . shows, on the flanks of the hill. A greater density of streamline implies a higher wind velocity since the condition of continuity must be satisfied. Hence the highest speeds occur on the windward side near the top of the hill. But since the air in part detours around the hill instead of flowing over it, two maxima will be found on the windward side near the hilltop between the central streamlines and the flanks of the hill. On the lee side the wind velocity decreases downward as shown. . . . The streamlines are here farther away from the hill, and a zone of vortexes is developed.”
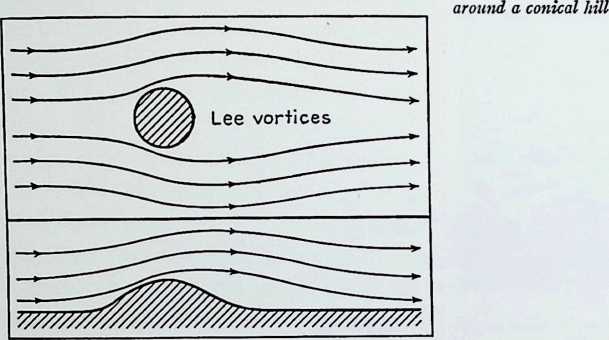
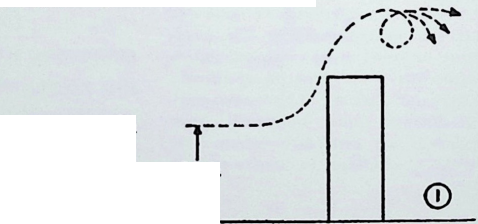 Architects may avail themselves of this knowledge in many phases of their profession.
individual buildings
Figure 193 (left). Wind distribution
50 ft.
Figure 194. When the wind is diverted upwards by a building, eddies are formed.
The construction of a building may induce in the microclimate certain phenomena which were not present when the ground was in its natural state. The wind is affected considerably; instead of following its usual course it is deflected and uplifted. Because of the convergence of the streamlines on the windward side, which occurs in a fashion similar to that of the forest or the hillock already mentioned, this exposure is the windiest. The other side does not suffer so severely but is affected to a
certain extent by the eddies that are created. This is apparent in the diagram reproduced from the Architectural Review. (Figure 194.)
The uplift of air may also be reviewed by examining the photograph of the fence in Figures 184 and 185. It was mentioned in the accompanying explanation that the effect was partly a result of the vertical air movement along the surface of the wall. This fact was also established by the author in connection with examinations of wind movement atop the 400-foot, 27-story building of the Sun Life Assurance Company of Canada in Montreal. On the morning of July 14, 1951, the author proceeded to the roof of this, the largest office building in the British Empire. The roof is roughly rectangular; observation points were established by
the author at each comer as indicated in Figure 195.
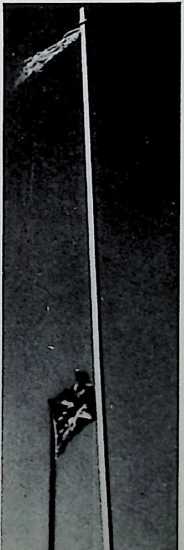 At each of these points there was affixed a one-quarter inch square wooden staff 5" high, to the end of which was attached a tuft of yellow wool. This wool responded very accurately to the slightest movement of the wind, and it was thereby possible to chart the wind patterns at different heights and different locations. Smoke might have been slightly better, especially such as that created by the researchers of the Texas Engineering Experiment Station by dipping a thin stick of wood in a bottle of titanium tetrachloride. But because the smoke thereby produced is discomforting to persons and also corrosive to metals, especially iron, it was deemed inadvisable by the author to use this on the Sun Life Building. No other substances serving the desired purpose and packaged in easily-portable form was available in Montreal, so the wool method was the only agreeable solution.
2
Figure 195. Observation points established on roof of Sun Life Assurance Company of Canada, Montreal, on July 14, 1951.
Figure 196. Divergent wind motions observed above roof of Sun Life Assurance Company of Canada, Montreal, on July 14, 19511:.,
Throughout the observation period, from 11:00 a.m. to 12:00 noon, the wind recorded at Dorval Airportand thus the wind which may be taken as representative of the general macroclimatic conditionswas from the southwest at 13 miles per hour. This was reflected in general by the motion of the Union Jack about forty feet higher than the roof level but not always in the action of the tufts of wool at the observation points. For example, at the east point (Station 4) the wind blew consistently from the east, exactly from a direction opposite to the main wind. A photograph of this phenomenon appears below; it reminds one of a recent United States commemorative three-cent stamp depicting smoke from a railroad train blowing in the opposite direction to Old Glory. The stamp did not look very authentic as far as what it portrayed was concerned. However, there is no doubt about the correctness of the illustration in Figure 196.
Extraordinary eddies are the possible cause of this phenomenon. They are large because of the comparatively great open space to the east on account of the green areas, railway yards, and the Canadian National Central Station. Consequently, one can explain the windy areas at the street comer below. As mentioned elsewhere in this book, other high buildings or very tall vegetation in the adjoining quarters would minimize this wind effect at the street level.
The east and west points illustrated extreme cases in the building. The north and south spots witnessed fluctuating winds. The author therefore gave most consideration to the first two positions, the results of which are shown in Table 52.
**feet/time** **mph**
1 West point 11.05 0 6" E 563z/5 min. 1.3
1 West point 11.15 3" E 1556 /5 min. 3.5
1 West point 11.25 5" W 3320/5 min.* 7.5
4 East point 11.45 0" W, E gusts 83 8 z/5 min. 1 .9
4 East point 11.55 3" most W 111 8z/5 min. 2.5
4 East point 12.05 5" E 201 1 z/5 min. 4.6
TABLE 52
* In one minute 1000 elapsed. This equals 11.4 mph.
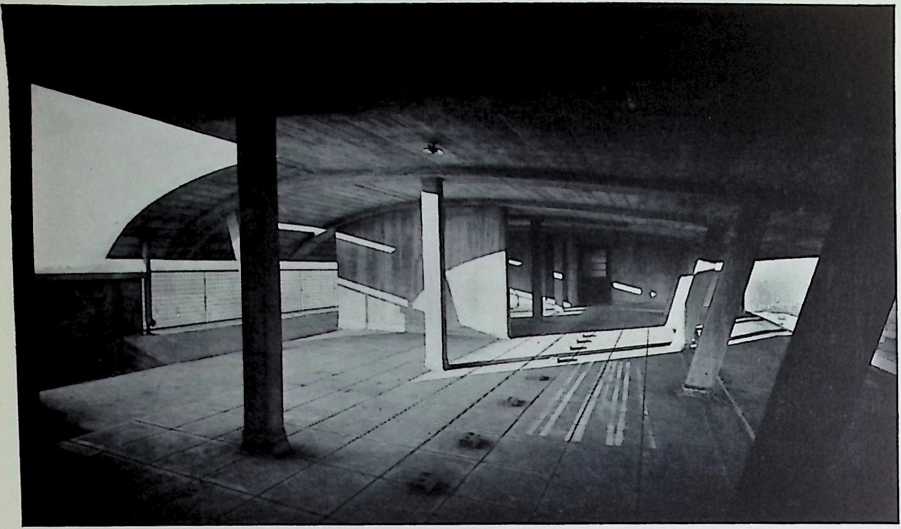
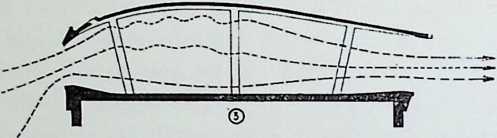
Figure 197 {above left). Roof designed by Tecton, Architects, in collaboration with Professor Levy of London University.
Figure 198 {left). Detail of roof.
Note in Table 52 that although the wind in the open country (Dorval) was 13 mph at the time, the greatest wind evidenced here was 11.4 mph and then only for a short period. This illustrates the friction effect of the city, alluded to elsewhere. Note that the lowest wind speeds are near the surface of the roof. The velocity increases with height. Note also that at lower heights (near the roof) the wind is usually in the opposite direction to that prevailing at 5". This occurred up to a height of 3" in most cases. The wind blows from opposite directions at the 5" level on the east and west sides. This would indicate that the winds must converge and go up or sideways, probably the former. One can note the flag in Figure 196 having somewhat of an upward lift. This strain rip the flag, with the consequence that in winter the management of the Sun Life Building has to replace the Union Jack about once a week. Lastly, note that although not explicitly indicated in the figures, in general for the most part of the time the wind was blowing in toward the center at the 5" level above the roof.
From this information of wind behavior in general, we may offer suggestions regarding particular applications in design. For example, regarding the form of habitable roofs, on tall buildings one should provide a reasonably tall parapet or protection wall. The wind will flow parallel to this wall for some distance after the wall has terminated and will provide shelter for the occupants.
Also, we may point out that, to minimize heat loss, it is imperative that the free flow of air across the surface of a building be uninterrupted. If small projections are introduced, eddies are created. If eddies are
created, the protective film of air adjoining the surface is removed. Then the heat loss would be increased. There are other unfavorable points with regard to the accumulation of precipitation on projections and the consequential destructive effects which we shall mention in a future paragraph.
Use of the rising currents of air has been made by Tecton, Architects, in collaboration with Professor Levy, of London University. The photograph of the Architectural Review analysis of his design appears in Figure 197. Atop apartment buildings the architect has provided drying spaces for a laundry. His approach was like this:
“1. the wind reaches maximum velocity about 50 feet above the ground, where it is free from the drag of obstructions. When it is diverted upwards by a building, eddies are formed.
“2. the wind roof traps the rising air currents and funnels them across the roof. The build-up of positive pressure where the air strikes the building results in a zone of negative pressure on the other side, helping to draw the air through.
“3. path of air currents through the drying chamber. The slots in the leading edge of the roof set up fluctuations in the airflow which increase its drying efficiency.”
This principle can be employed not only for areas of this sort but for inhabitable rooms too. Architects O’Neil Ford and Gerald R. Rogers used this idea in a San Antonio, Texas, home in 1947. Thus they were able to catch the slight southwest breeze, which is so important for comfort in that part of the continent.
Upward motion of air is a very tricky matter to foresee accurately in architectural works. Here are some of the problems as expressed by Mr. W. W. Caudill, A.I.A., Research Architect with the Texas Engineering Experiment Station, College Station, Texas, in an address at the Weather and the Building Industry conference:
“Our neighbors across the street live in a Texas Cape Cod, one of those houses with a crew haircutno overhangs. They are not very sociable except on rainy days when they about smother to death, and then I guess they take the lesser of two evils and come to see us so they can get cool, because we can keep most of our windows open because of the overhangs.
“In the case of one of those overhangs, a large one, when it rains, we do have to close those windows. Being a typical architect, I got curious, so I bought a smoke candle and lit it to try to trace the airflow pattern around this particular overhang. I held it up; swish! boy, she went right in. I moved it six inches; wow, she turned around and went the other way; so right now I don’t know whether I am getting air in any of the -windows. … .
“Let me give you another example. . . . Last year, I was commissioned to design a school in Blackwell, Oklahoma. [See Figures 199, 200, and 201.] That is a nice little town of 15,000, about ten miles from the Kansas line, and it is pretty cold there. However, they have extreme
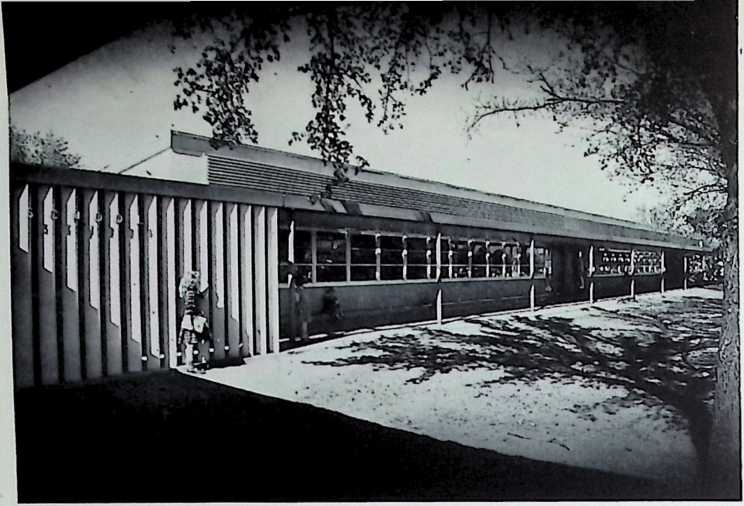
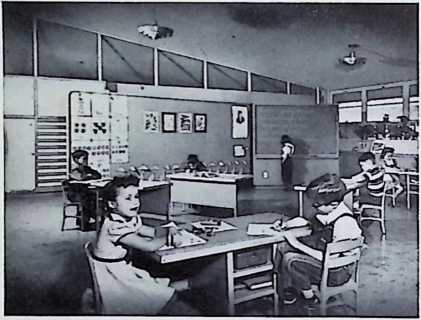
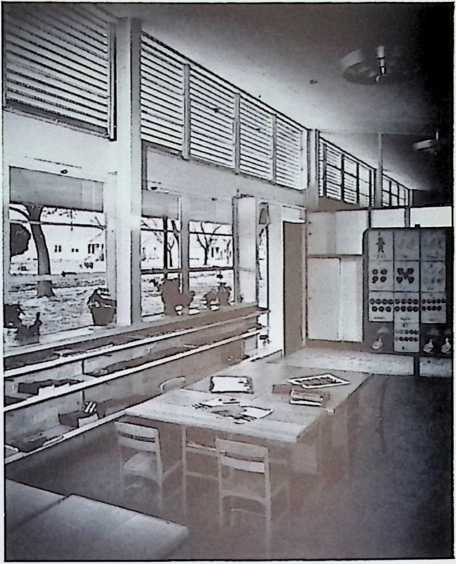
Figure 201 (right). Classroom in Huston Elementary School.
Figure 199 {left). Exterior view of Huston Elementary School, Blackwell, Oklahoma. Caudill, Rowlett, Scott and Associates, architects. Figure 200 (below). Interior view.
conditions. They have hot springs and hot falls, and so they said, ‘Fellow, we have got to have an air movement where these kids sit in order to have comfort!’
“I took their word for it. You also have to have air movement at the ceiling to carry out the hot air that rises. Well, we really cooked up a swell scheme, we thought. We had a cross section there where we had an outdoor corridor. . . .
“We had our outdoor corridor on the south so we had protection from the cold north wind, (and it really gets cold up there). So we put this overhang on the south and used it for a corridor and, above the overhang, we put windows. We put windows down below, too. Our idea was to catch the breeze down below in the windows, let it flow through this living zone where those kids are, and then catch the breeze above and let it flow along the ceiling to carry out the hot air that rises.
“Well, we designed the school and I got to worrying about my little experiment that I did at home where the breeze went cockeyed, so we made a model and took it to the college and put it through a test in the smoke tunnel, to try to trace the airflow. I went through the classroom to see if we got the movement of air at the bottom and movement at the ceiling; when we put the smoke candle up above the canopy, we couldn’t force smoke through there. That is the truth; we put it right to the ■window. It wouldn’t even go into the room.
“So, again. I am a typical architect. I don’t know the whys about these things, but we juggled around and we put a slot in our overhang and apparently it equalized the pressure down below and above, and then the air went right on through. Our building is built that way. We haven’t tested it. It is strictly an amateur job but there, again, we should know something about patterns and wind patterns at low velocities.”
Realizing the importance of such information in architecture, the University of Texas was one of the first institutions to do something about it. In September, 1949, their Aeronautical Engineering Department initiated a modest program in research on the aerodynamic characteristics of modern homes. This was carried out in conjunction with the Bureau of Engineering Research and several local firms who were interested in this and other techniques of building design. Full-scale experimental rooms as well as models of them for wind-tunnel tests, were constructed.
The first question that was raised with regard to testing models was: when the scale of the building is reduced, is it all right to keep the same wind velocity as in actual conditions? Said the Architectural Forum edition, The Magazine of Building, (May, 1951, issue) commenting on the Texas work: “Would small streams of air behave similarly in a model to large streams of air in full scale? A rule of aerodynamics indicated they would not: the principle of ‘Reynold’s Number’ is that speed is inverse to size, i.e. that the behavior of air going through a 10 high room at 15 mph. could be duplicated in a 1 high model only by a stream of air travelling at the difficult speed of 150 mph. But the testers took a lengthy look into that too and established that they were somehow, in these low velocities, not limited by this rule. In a 2 high model, if detailing was precise, they could operate in the wind tunnel at speeds as low as 160 ft. per min. [approximately 2 miles per hour], and their patterns (made by the titanium tetrachloride) were duplicates of patterns made by smoke tests in the full scale experimental room.”
The general argument of the University of Texas experiments was as follows, continued The Magazine of Building-. “Air moves naturally for two reasons: because of pressure differences and because of temperature differences. The latter is very important in ventilating tall buildings, where vertical thermal currents may be the prevailing breeze [as in the Sun Life Building], But it is the pressure differential which matters most in the ventilating of low buildings, and in the Texas testing . . .
“. … air has a great deal of inertia and does not change direction willingly. This is shown …in the photographs of models in the low velocity wind tunnel.
“The photos … . show blocks which might be building shapes. The wind comes from the left, piles up on that wall of the building, then sweeps around the sides and keeps on going past the lee of the building. The wall which the wind hits becomes a high pressure area. The opposite wall is a low pressure, or suction area, and is an equally important powerhouse for ventilation. The sides, surrounded by relatively highspeed air and solid surfaces are low pressure areas.
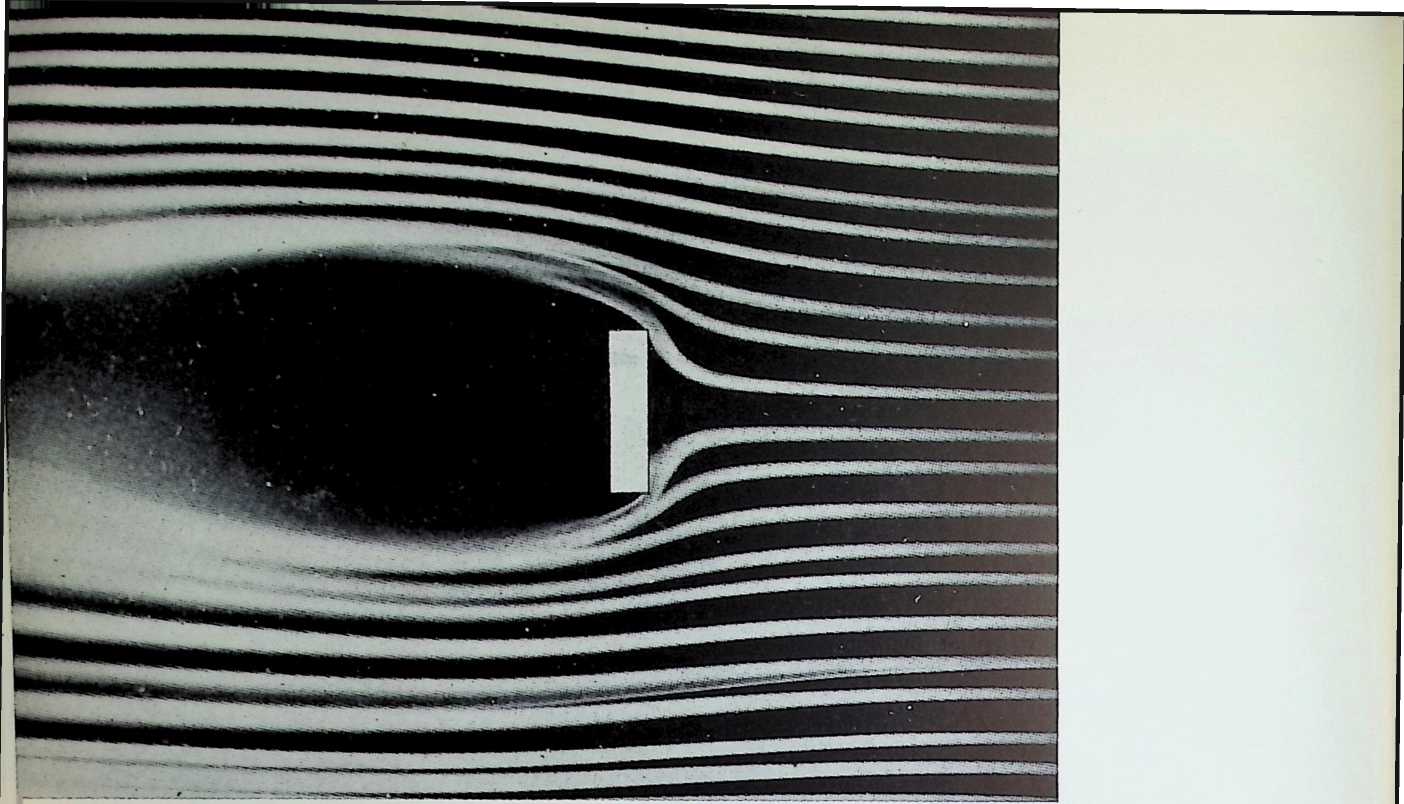
Figure 202. Wind-tunnel lesls to determine the aerodynamic characteristics of modern homes as carried on in 1949 by the Aeronautical Engineering Department al the University of Texas in conjunction with the Bureau of Engineering Research and local firms.
Figure 203
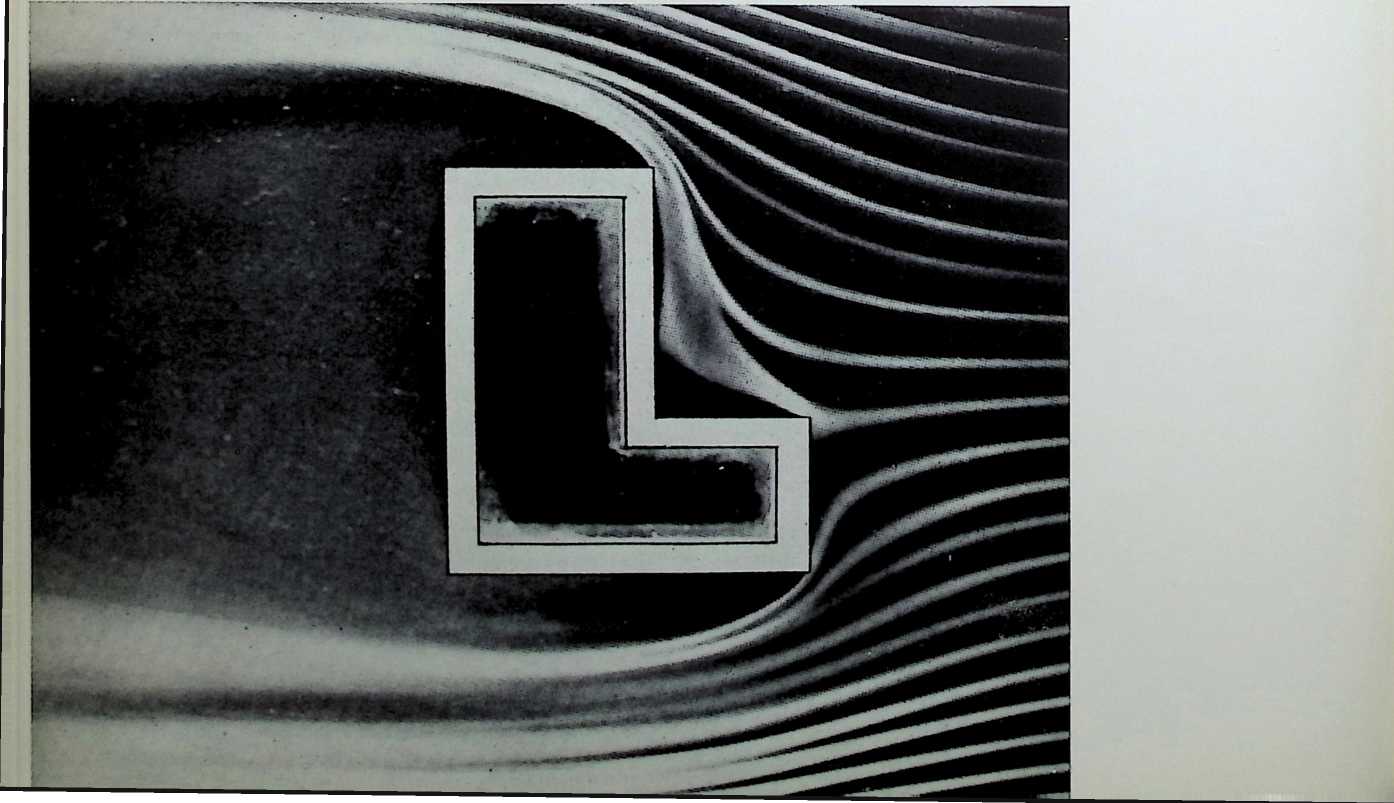
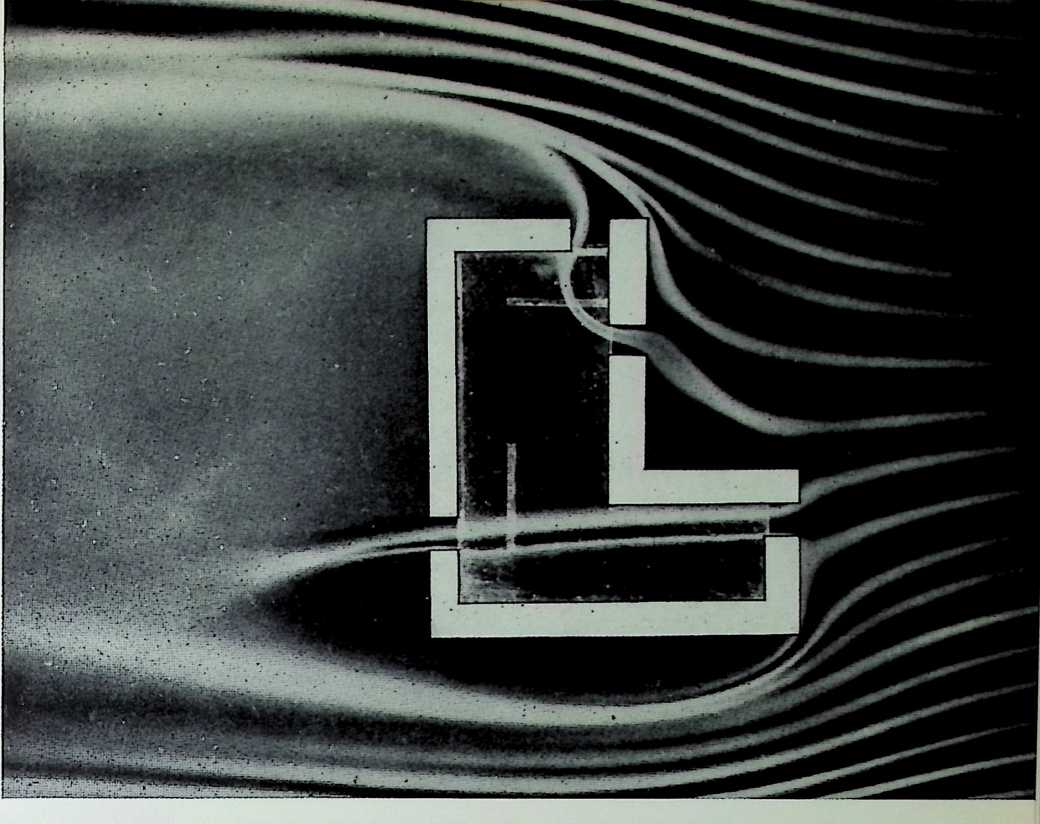
Figure 204
Figure 205
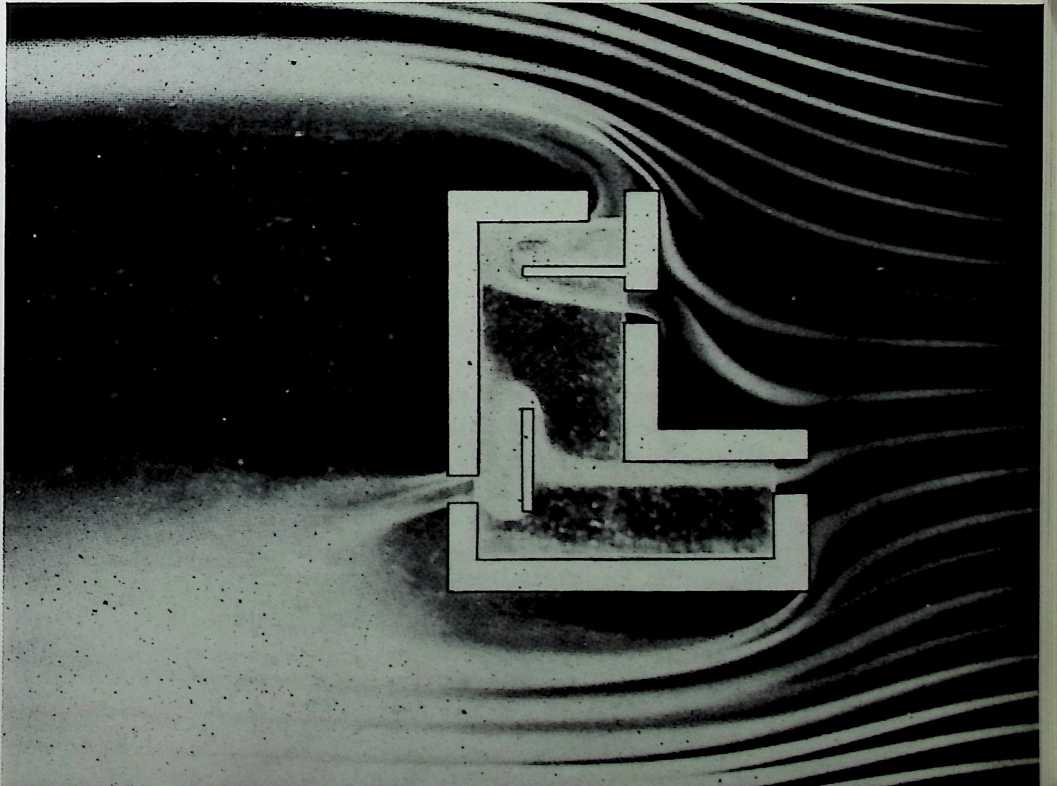
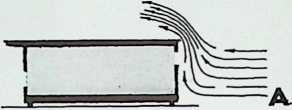 “As the pictures clearly demonstrate, the low pressure area can be used to suck air rapidly through the building. Important to remember is that any changes in the direction of air flow bleed energy from the air flow, and slow it. Since the success of cooling by ventilation depends on keeping the speed of air relatively high, necessary changes in the wind direction should come as late as possible, after the high velocity has been used. The turn should come as close to the lee side of the building as practical and should not be abrupt. In photos . . . note that partitions spread effect of air movement into general turbulence, but only after the straight, relatively fast stream has been used to advantage.”
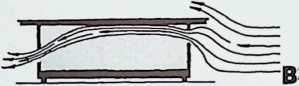
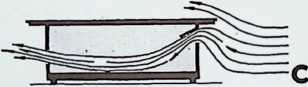
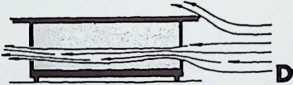 Note that it is thus extremely necessary to be aware of the exact direction of the prevailing winds in order that the ventilation plan will work. The article continues, in part: “One of the most widely argued design decisions for natural ventilation is the proper size for the windward (pressure wall) and leeward (suction wall) windows for most effective air flow through a room. The answer proved in the wind tunnel is this: a small opening should be placed carefully in the pressure wall to admit a small stream of fast moving air directly on the people to be cooled. A larger opening should be made in the suction wall to pull the air through the room and to widen the stream somewhat (at the cost of slowing it somewhat) before it leaves. The same principle applies, of course, to most rooms: the leeward window should be open more than the windward window; or in a room without through air traffic, the hall door should be opened wider than the window. . . .
Figure 206. Overhangs and louvers can deflect more air into a room.
“Tests have shown that careful studies of overhangs, roof slopes and louvers are very important in each building design. Drawings show how an overhang can be used to deflect more air into the room (if a suction power-house exists to pull it through) and how careful adjustment of a louver can put the moving air where it will have the greatest cooling effect.”
Although the University of Texas must be commended for its efforts in promoting understanding of wind flow around structures, it must not be forgotten that other architects, especially the European ones, were previously engaged in all sorts of experimentation in this field. Of particular note is the name of G. Eiffel, who conducted observations in 1919. About the same time in England there were similar investigations under government sponsorship.
One of the most complete analyses was prepared by the Structural Research Laboratory at the Royal Technical College, Copenhagen, Denmark, by J. O. V. Irminger and Chr. N0kkentved. The results, presented in their book, Wind Pressure on Buildings, are for the most part of interest to civil engineers, for there is contained therein an excellent review of stresses that roofs and walls will undergo as a result of winds. Their conclusions, in brief, are as follows.
They found, first of all, that the rougher the surface of the terrain, the greater will be the vortex region on the windward side of a building. This means that when the ground surface is rough instead of smooth, the air will start to flow over the structure at a greater distance away from the building. However, they do not elaborate on the type of surfaces concerned.
The shape of the vortex having been determined, they investigated the effect of the wind flow thus induced on different sloped roofs both on the windward and leeward sides. They summed up by saying: “As long as the slope of the windward vortex layer at a building is flatter than the roof pitch, pressure will prevail over the windward roof surface. If the roof pitch is reduced. . . the pressure vail diminish and reach the value of zero at the eaves when the vortex layer is parallel to the roof surface.” Fortunately, it was determined that a 20° roof pitch in most cases is affected by almost no pressure or suction; “fortunately,” because the reader will remember that it was previously recommended that an incline of this nature be employed to account for the demands of the sun and temperature in northern latitudes.
The Danish testers in the course of their work discounted some of the findings of Eiffel. Eiffel had thought he confirmed experimentally that different sized models of the same building (the largest he used was 50 times greater than the smallest) would give exactly the same wind-flow results. The Danes recognized, however, that Eiffel had only considered the leeward side, which does respond similarly in each model; when the entire building is concerned, the Reynold’s number, referred to in the discussion of the Texas investigations, must be employed. This should be remembered by any engaged in future research of wind-flow by the use of models.
The School of Architecture of the University of British Columbia, among others, has conducted elementary wind experiments on models by the aid of electric fans and streamers attached to the various surfaces of the test object.
When the wind goes around the sides of buildings there is an area of calm on the side, which, according to Mr. George Jacobsen, is for a distance equal to that obtained by the formula
C = KW/3, where C = length of area of probable calm along wall
K = wind factor
W = width of building.
Jacobsen says: “This formula is only good if the wind hits the building straight on and in siting a building an estimate has to be taken from the probable wind direction on each side . . . this is a practical formula. The theoretical formula is much more complicated and has to be calculated according to the aerodynamic flow formulas of the aircraft industry".” He has found by personal experience in the construction industry that in the Arctic it is best to keep the shape of the building as rectangular as possible. The effective area of calm would not be increased by extending the wall which bears the brunt of the wind to form a fin or windbreak. The calm might even be reduced because of the creation of eddies; and as we [shall]{.underline} see later, it would result in the collection of snow drifts. This would undoubtedly hold true in more southerly regions as well.
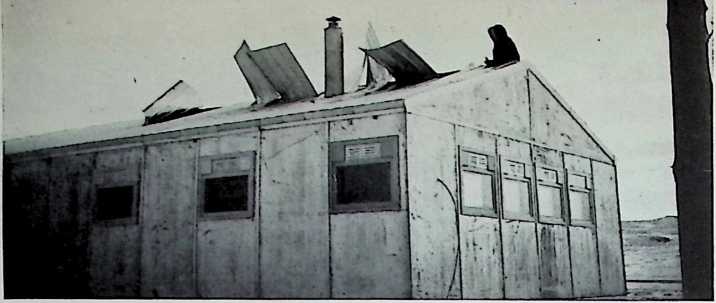
Figure 207. Destructive action of the wind on an aluminum roof.
In windy districts outside tropical or semi-tropical areas it is very necessary to have a good tight construction on all architectural details. Figure 207 shows one of George Jacobsen’s buildings constructed in Resolute Bay, Northwest Territories, at latitude 74° 29z North. This illustration shows the strength of the destructive action which the wind can exert on an aluminum roof. It occurred during a short period while the men who were putting it up were away for lunch. The trouble lay merely in the fact that when they left they had not finished nailing it down. This photograph also shows special arctic windows triple-glazed with built-in ventilators on top, special arctic chimney, and felt-lined joint strips.
It has been observed by the author that Quebec farmersespecially those in the Ottawa valley, over which he has flown in a light aircraft- almost invariably orient their farmhouses with the longitudinal axes in an east-west direction. Thus the smallest area bears the brunt of the prevailing wind, which is from the west and southwest. These farmers are employing what is a time-tested practice in the area, for no matter what is the shape of the land in which they are contained, these buildings are nearly without exception planned as above. It may well be wise for architects in this area to profit by their experience.
One of those phenomena exposed in the section of wind and vegetation was the creation of whirls in clearings. Geiger notes that “it is of great practical significance where there are courtyards within great blocks of houses.” If the trees in Figure 189 were replaced by houses, “. … we can readily understand that the chimneys in the houses at the right will not draw properly, and that in those dwellings the fire will often be driven out the stove doors. In such cases it helps to plant trees in the courtyard to hinder the formation of whirls.”
Although the wind will go up over a building, and around too, one should not think that there is no wind along the ground. Such wind can often be very objectionable and indirectly offers one reason why windows should not be placed near the ground level. With a slight wind, dust will drift along the surface, decrease visibility, and enter any openings in a wall.
Where there is enough dirt or sand and an adequate wind prevailing, this “sand-sweep” becomes “drifting sand.” The same thing applies to snow. So it is important to avoid, if possible, siting houses in sandy areas, to avoid low windows that have movable sash, and to plant grass and other vegetation around houses to minimize any inconvenience of this sort.
In many regions of the world, provision must be made to protect building dwellers from the disastrous effects of the climatic disturbances often termed hurricanes, typhoons, willie-willies, and tropical cyclones. The challenge to architects lies partly in the fact that areas of the globe which witness such storms are usually hot ones, where open planning is the theme. How should one provide, therefore, for the sealing off of the building when bad weather is in sight? Antonin Raymond and L. L. Rado in their proposed project at Guam (see Figure 163) have specified horizontal-sliding hurricane shutters that are capable of completely enclosing the wall surfaces of the building. Like the mosquito and bamboo screens on adjoining tracks inside, these shutters reach from floor to ceiling across each bay. Various combinations of these screens can be made to effect many purposes, some of which are suggested in Raymond and Rado’s illustrative sketches, Figures 208 to 210. It should be noted that when there is a nice breeze (the living quarters are raised off the ground to capture as much wind as possible) and when the screens are adjusted to permit air to enter, there will be cross-ventilation of the entire structure. This is achieved because interior partitions are cut off at the transom level.
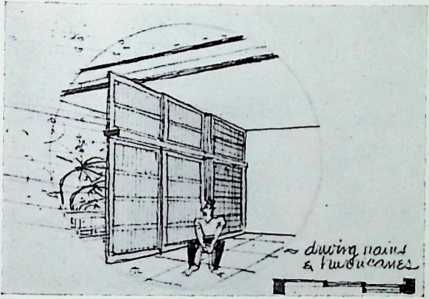

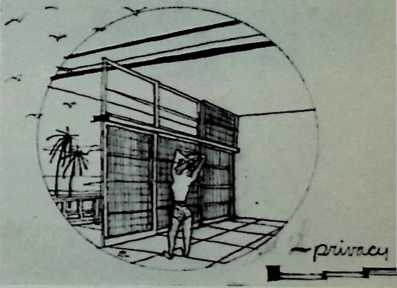
Figure 208 (left). Horizontal-sliding hurricane shutters, Guam. Figure 209 (below). Figure 210 (bdow right). Antonin Raymond and L. L. Rado, architects.
In order to admit the circulation of air within a building and to obstruct the direct rays of the hot sun at the same time, Raymond and Rado have devised an attractive concrete-block screen wall for a 500- seat Catholic Church in Negros, Philippine Islands. (See Figure 212.) Note in the section (Figure 211) that there has been no attempt made to prevent rain from penetrating this clerestory’; however, once the rain is inside it is caught by a trap and put to good useit is permitted to run down the space between the corrugated roofing and the main roof deck,
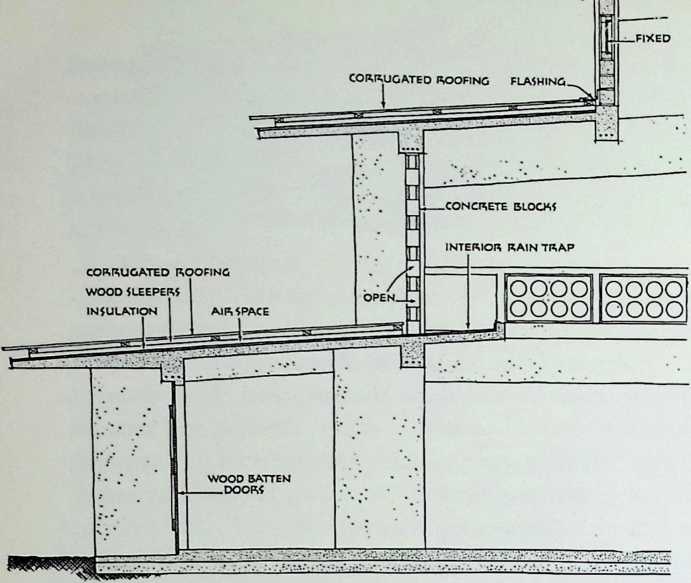
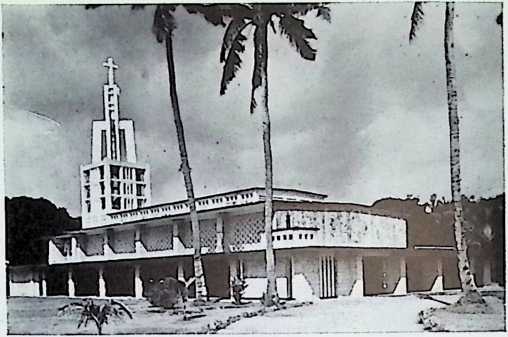
Figure 211 (below). Catholic Church in Negros, Philippines. Figure 212 (left). Section. Antonin Raymond and L. L. Rado, architects.
to assist in keeping the building cool by the evaporation principle. (See page 147.)
Double roofs, like this one and others that have been seen, bring to mind the double fly tents that campers use in desert regions. Air circulates between the two membranes and prevents excessive heating by the sun on the interior.
Paul Lester Wiener and Jose Luis Sert have used in many of their South American projects a screen which they have termed “a breathing wall.” It provides air and ventilation for the inside of the building it encloses, but at the same time it acts as a sunbaffle for both low and high angles of sun rays, offers protection from driving rain, and gives privacy to the occupants. Figure 214 shows a closeup of one of these, as developed in the mid-1940’s. These screens can be made of either precast concrete or terra cotta, and many interesting patterns can be designed. Figure 214 illustrates, in fact, the wonderful possibilities; it is a breathing wall conceived by J. Gaitan of Bogota, Colombia, and used by the Town Planning Associates, of which Wiener and Sert are the principal partners.
A “Z”-shaped block was used, as can be seen in the section, for the wall in Figure 213. This is, incidentally, a very good joint against the penetration of rain. It was developed by the Oficina de Planificacion y Vivienda, Caracas, Venezuela, as were the screens on the building in Figure 215, an apartment block designed in conjunction with the Town Planning Associates.
In most Caribbean islands it is very necessary to capture the breeze in buildings to provide for comfortable living. New York architects Voorhees, Walker, Foley and Smith accomplished this nicely in their
Figure 213 (above). “Breathing wall" developed by the Oficina de Planificacion y Vivienda, Caracas, Venezuela. Figure
-
(right). “Breathing wall” designed by J. Gaitan of Bogota, Colombia. Figure
-
(below). Apartment block employing use of “breathing wall." Developed by the Ojicina de Planificacion y Vivienda, Caracas, Venezuela, in conjunction with the Town Planning Associates.
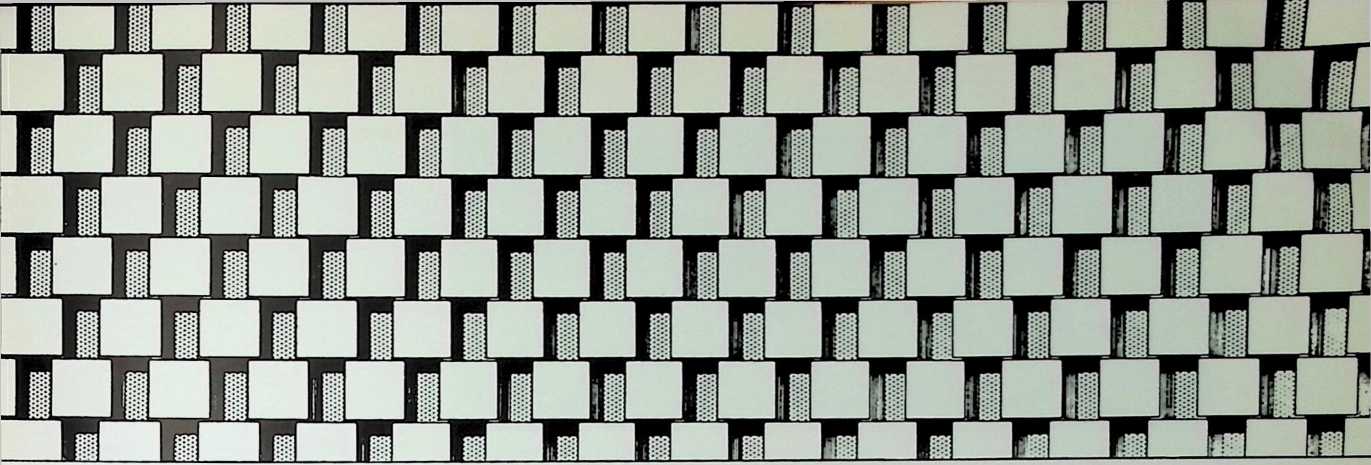
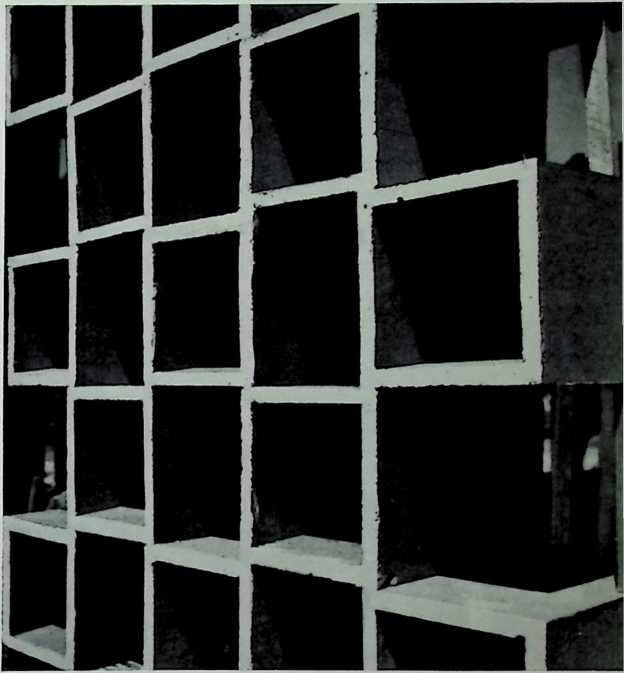
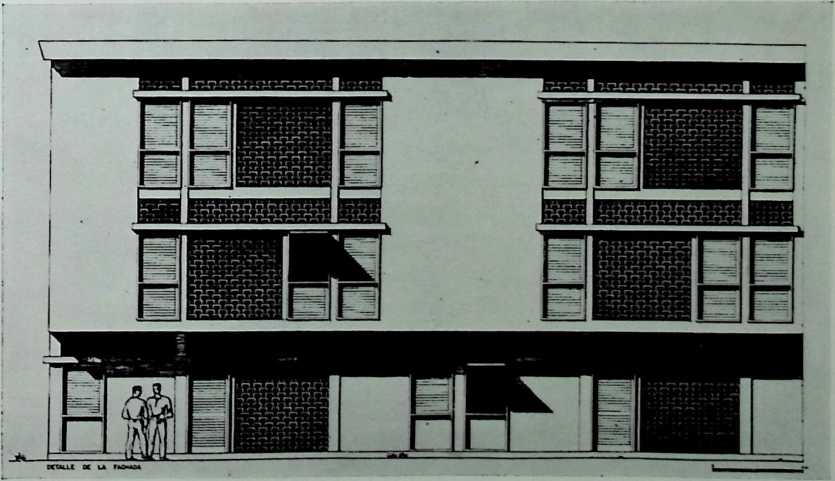
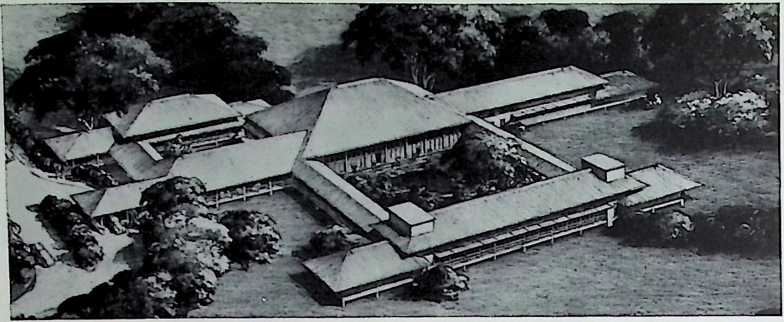
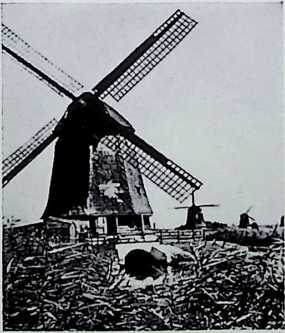
Figure 216. Guest house, Fort Read, Trinidad, B. W. I. View from the east. Voorhees, Walker, Foley and Smith, architects.
Figure 217. Windmill in the Netherlands.
design for a guest house at Fort Read, Trinidad, B.W.I. Figure 216 shows, in a view from the east, the open plan which admits the slightest wind. The windows, which are provided with insect screens to enable the occupants to sleep without netting over their beds, may remain open during rainstorms, because of the protection of the large overhangs. The asbestos-protected metal roof is also pitched in a manner that water from downpours -will be cast off quickly. Of special note here are the ridge ventilators, which capture the air flowing over the top of the roof in such a fashion that air from the interior ceiling is sucked through, creating air movement inside the building.
Wind is normally considered by architects as a cooling or ventilating agent. Yet it can be used as a source of heat too. Alfred B. Parker, a Miami architect, in Weather and the Building Industry, suggests putting windmills on houses. In conjunction with or as a substitution for solar heating, windmills can serve as a generator, the current produced being used to heat water for household purposes and for heat convectors. In regions where the wind is very persistent, not necessarily in direction but in velocity, such a scheme might be advantageous. Of course, windmills serve as a very effective source of power in the Low Countries; this is a clear demonstration of the feasibility of such a design, provided the winds are of a satisfactory nature.
Brooks has remarked that when the wind is used as a source of power, the power yield is proportional to the cube of the wind speed, so that with a wind of 30 mph it is twenty-seven times the yield at 10 mph. The useful range of wind speeds in North America is from 8 to 30 mph. At low speeds the yield is negligible and at high speeds the equipment is liable to go out of order. Thus on windmills the sails usually flip away from the wind when the speed is excessive. It has been found that the power varies somewhat with the windmill in question. According to Brooks: “A trial French integrator was graded to give 0.37 (V/10)3 kilowatts per square metre of sail surface, V being the average wind velocity in metres per second. When V is expressed in miles per hour this is equivalent to 0.31 (V/10)3 kw. per 100 square feet of sail surface. The actual yield would probably be slightly less than this.
“Since the power developed is proportional to the cube of the wind speed, and the latter is roughly proportional to the fifth root of the height above the ground, the effectiveness of a generator is more or less proportional to the square root of the height of the sails above the ground. . . . The most favourable site is on the crest of a long, high ridge lying across the direction of the prevailing wind. …A windward slope of 1 in 10 increases the wind speed over the summit by up to 15 per cent., of 1 in 7 by up to 23 per cent., and of 1 in 4 by up to 35 per cent. Sites over very steep slopes are unfavourable because the wind is thrown up nearly vertically and becomes very turbulent.”
The architect will have to interpret this information for his own needs. Proper orientation for wind cannot be recommended without reference to a particular site, because local conditions, as has been seen, are liable to influence the flow of air greatly. It is hoped, however, that enough information has been presented herein to enable the architect to weigh the problems involved -with intelligence and to execute a wise solution.
¶ site, city, and town planning
Aristotle, Vitruvius, Palladio, Rozier. Mexicans, Peruvians.
Vienna, Nuremberg, Magnetigorsk, Welwyn Garden City.
The reader should recall mention of the above, and other, names in the chapter on background. They were all related to proper planning with respect to winds. Or, perhaps the reader will not recall this; it was mentioned a number of pages back. So, to refresh one’s memory of manners by which winds were taken into account in historical city planning, let us look at Corcula in Dalmatia on an island in a sound of the Adriatic Sea. Says L. Hilberseimer in The New City, “It faces a mountain on the mainland, the Monte Vipere. The position of this mountain influenced the location of the city; winds from its summit influenced the city’s structure. The streets are arranged in a herringbone pattern so that the cold mountain winds cannot penetrate them. These streets are laid out at an angle to the direction of the prevailing winds.”
What is being done now in city planning with regard to winds? First we may refer to “twentieth-century primitive.” Very few’ farmers, for example, would position their hog barns on the windw’ard sides of the farmhouses. The odor would be very unpleasant. Those farmers who do not intuitively position their buildings with proper respect for the breeze may refer to numerous publications of government departments of agriculture. These publications often present an excellent variety of sample farm plans designed on the logical principles of house-barn orientation with respect to the prevailing winds. The Prairie Rural Committee of the University of Manitoba, the Province of Alberta Department of Agriculture, and the College of Agriculture at the University’ of Illinois, among others, all emphasize the fact that the house should be out of the path of the summer winds from the barnyard, cattle feeding unit, and hogpens. The Department of Agriculture, Dominion of Canada, with the advice of architect F. W. Graves and the cooperation of the provincial departments of agriculture, has prepared sample designs for farmstead layouts, with special reference to conditions found in various parts of that country.
The unfortunate situation today, however, is that the city dweller rarely realizes these same possibilities. Instead of hog barns there are numerous factories which emit foul smells and pollute the air with various particles of soot; but the urbanite does not orient his buildings adequately with respect to the wind that is, with few exceptions, which will become evident in the succeeding remarks.
It is first necessary, however, to examine how the wind actually is liable to behave over a city. There are several references for material of this sortmost of which are in German. In particular we may mention that of Dr. A. Kratzer entitled Das Stadtklima. Then the work of Professor Ernst Brezina and Wilhelm Schmidt, called Das Kilnslliche Klima; this discusses the climate of Vienna especially. And Brezina’s own book entitled Klima, Wetter and Mensch climate, weather and manis worthy of note. Also one may remark on Linke’s article, Das Klima der Groszs- tadt, which is an excellent source of material, and Geiger’s chapter on “The City Climate” in the Climate Near the Ground.
As has been seen already, buildings cause eddies in the wind. Thus, there is a braking or friction effect. According to the authorities just mentioned, it is nevertheless difficult to estimate to what degree buildings have influenced the flow of wind in cities. This is because, as the towns were being built up, measurements were not usually taken at the same time and the same place.
Linke, however, has recorded that there was a slowing down of the mean wind from 5.1 meters to 3.9 meters per second in 10 years in a certain German city. Also, Kratzer’s doctoral dissertation noted that in Detroit there was a retardation from 6.5 to 3.8 meters per second in 20 years. The city’s effect can be noticed too in Stuttgart, where, from 1894 to 1923 the amount of windless days increased from one per cent to twenty-three per cent.
It may be determined from this information that buildings, especially when grouped together in small areas, will greatly stop the flow of air. This is not always good; a moving breeze is an excellent way to prevent the accumulation of foul odors and unhygienic areas.
The wind over a city will be one or a combination of the following: the prevailing macroclimatic wind, the microclimatic winds induced by topography, etc., or the wind set up by the presence of the city itself. The first two have been discussed in great detail in preceding paragraphs. The third, however, needs some elaboration.
According to Linke, the fact that the city is warmer than the surrounding land at noon and night results in the formation above and around it of a wind system of its own. The warm air is fighter, and therefore over the warmer regions of the city a rising air current is formed. This occasions an inrush of air from all sides to replace that which is uplifted.
The earth’s rotation also adds its influence: the entire wind system sets itself in motion in counter-clock-wise fashion, which is commonly termed by meteorologists as being “cyclonaL” In the center of town, where overheating is usually strongest, the rising thermal is strongest, and as a result there is the strongest conflux of air. The city smog, which shall be mentioned in a forthcoming section, swirls itself upward and forms a dome, the urban smog dome, which lies somewhat to the leeward of the main wind directions. Evidently, the free ballooner and glider pilot are well aware of this urban wind complex. Even when a free-sailing balloon drifts over a city at a great altitude, it is grasped by the rising thermal that the glider pilot calls “city thermal.” The balloon is, however, at the same moment drawn right about the city, counterclockwise.
In most cases all the smog of suburban areas and industrial quarters is carried at night into the center of the city, while the suburban areas receive fresh air from the countryside, which air does not succeed in pressing to the center of the town.
Linke advised that “some towns have town meteorologists on their staff who investigate these things and on whose consultation town planning measures are based.” Many cities could very well do with such staff meteorologists, especially since, as Linke wrote in 1940, “heavy war gases move in the same fashion as cold land airthey move to the warmest and deepest areas of towneven when completely influenced by prevailing winds (providing they are not too strong).” It would not be harmful to consider this defense angle in the design of today’s cities. Some militarists might view gases as being outdated; but perhaps bacteria employed in warfare and radioactive clouds from atomic blasts would be distributed in a fashion similar to that outlined above.
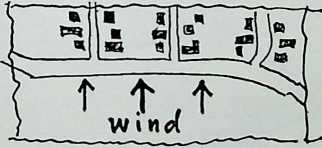 What may planners do to minimize these effects? First of all, they may pay heed to the macroclimatic and microclimatic wind patterns of the city. Secondly, they may provide industrial quarters in a manner such that the winds will not blow smoke and other impurities into residential areas. Thirdly, they may provide green spaces throughout in order to reduce the thermal heating to an extent where there will not be a huge rising current of air to direct smog where it is not wanted. Especially provide parks and other green areas in the center of the city. This will reduce concentration of thermal heating in the middle. Heat will be more evenly distributed rather than staying concentrated at one or two points. Fourthly, they may avoid industries which will assist in the production of smog (see discussion, Chapter 5). Finally, where wind is considered undesirable on the buildings themselves, they should orient the major arteries perpendicular to the prevailing wind and orient the minor roads parallel to it wherever possible. Thus the wind will not be channelled, unobstructed, along main thoroughfares, and trees and the houses themselves will reduce the flow of air along the smaller streets to a [minimum]{.underline} The diagram in Figure 218 will illustrate this^
Figure 218. Example of orienting the major arteries perpendicular to the prevailing wind.
History has taught that, in town planning, proper respect for wind pays off. This was certainly true in the case of the recent design for Chandigarh, the new capital of the Punjab, India. This city for 500,000 people, built from “scratch,” has one of the most well-conceived master plans of any yet built, for the architects, Mayer and Whittlesey of New York, considered not only the application of sociological ideas, provision for a sound economic structure, a good aesthetic approach, ideal circulation for all types of traffic (motor vehicles, oxcarts, bicycles, and pedestrians), and other factors that go into the making of a city, but also the nature of the terrain and the accompanying macro- and micro-climate.
It is notable that Mayer and Whittlesey recognized the tremendous importance of designing Chandigarh from the climatic point-of-view, because in the State of Punjab, as in many regions of India, excessive temperatures and humidities make life rather uncomfortable if an attempt is not made to modify their influence or to assist in producing more favorable conditions.
One of the first things this firm did was to consult Dr. Helmut Landsberg, noted American climatologist, and to arrange with him to make a climatic and microclimatic survey of the proposed site. The entire program was influenced by this intelligence, with the result that the master plan developed by Albert Mayer and Julian Whittlesey (with M. Milton Glass and the late Matthew Nowicki of their firm), Landsberg, and consultants Clarence S. Stein, Ralph Everlin, James C. Buckley and Clara Coffey, was extremely well developed.
The topography of the site, consisting of approximately 28 square miles, is mostly of a gentle sloping plain. However, there is one prominent elevation in the north-east quarter as well as a river near the north and east boundaries. The architects placed the Capitol on the promontory because in this place it could be seen from all sections of the town.
But there was another reason too: at night, especially during the months of April, May and June, according to Landsberg, the hill produces a breeze that extends from the ground to a height of 3 to 4 feet, because of drainage, for a distance of two miles. There was no point in putting the Capitol at the base of this slope because the Parhament would rarely be in session in the evening and, like higher-class residences, would probably be mechanically air-conditioned anyway. So the medium-class housing was placed there.
This being established, the layout of the city (Figure 219) was arranged this way. From information supplied by Landsberg, the architects plotted on a chart various orientations concerning prevailing mac- roclimatic winds and the most favorable sun conditions. (See Figure 220.) It was determined that the optimum orientation for streets would be greatly influenced by the winds, not the sun (which is within 8° of being vertically overhead on June 21) and that it would be on a northwestsoutheast axis. From this data, studies were made concerning the preferred placement for each block and the layout of the housing units inside them. (Figure 221.) An analysis of this provided the architects with a block orientation chart, similar to that in Figure 223. Then designs were prepared for various districts, each consisting of three neighborhood super blocks. (Figure 224.)
Figure 219 (above). Layout of Chandigarh, Punjab, India. Vertical grid lines run from north (top) to south. Figure 220 (below left). House orientation in relation to sun and prevailing wind. Figure 221 (below). House placement in Chandigarh, named for Chandi, the goddess of power.
NUMBERS IN CIRCLES INDICATE ORDER CE RRSTEREMCE ECR USE
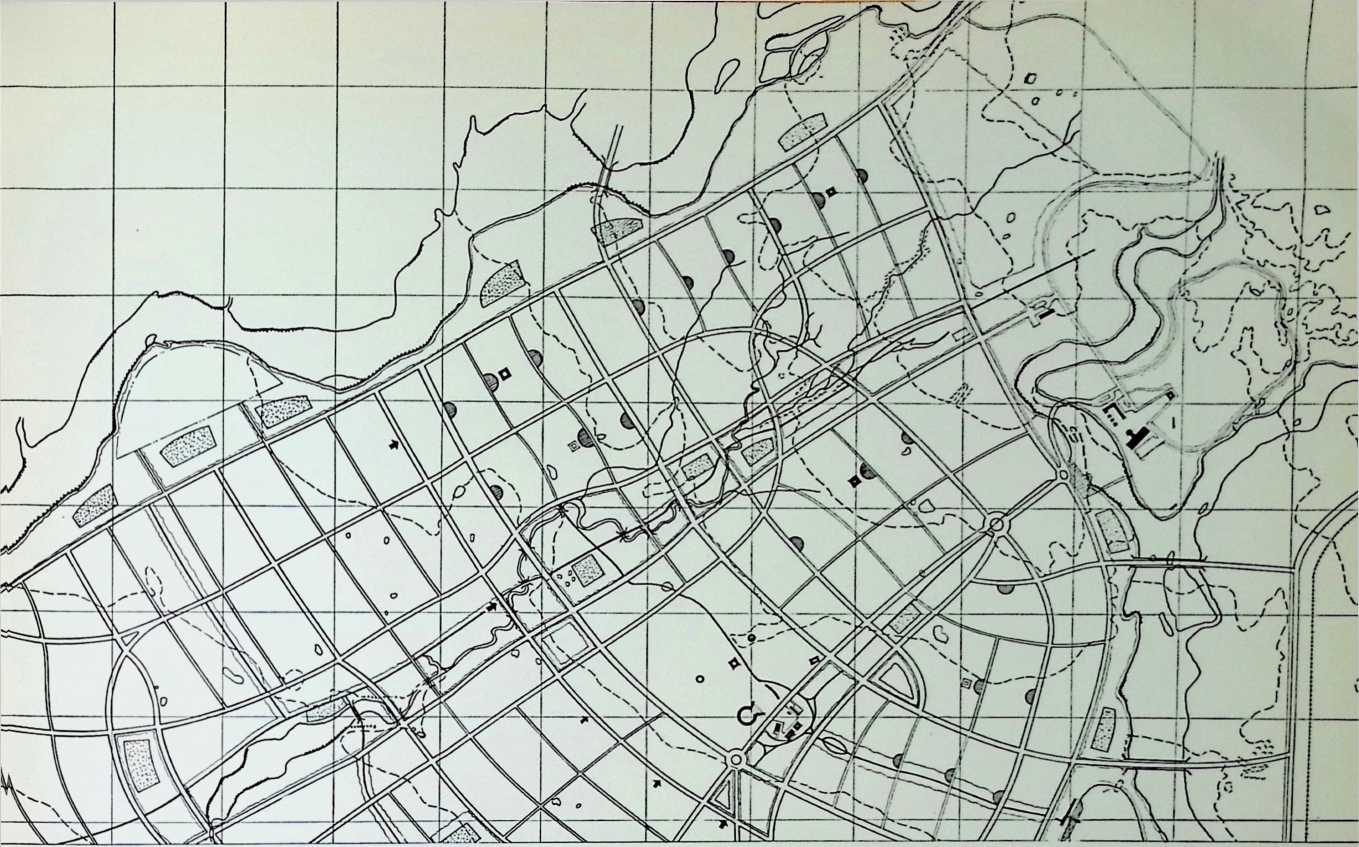

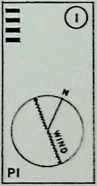
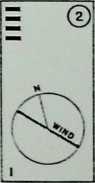
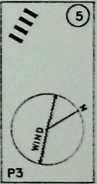
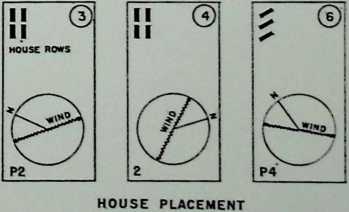
Figure 222 {above). Chandigarh fats, Punjab, India. Figure 223 {left). Block orientation.
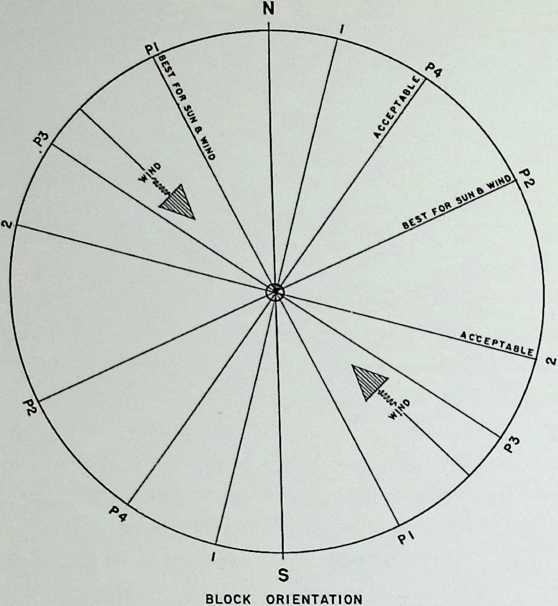
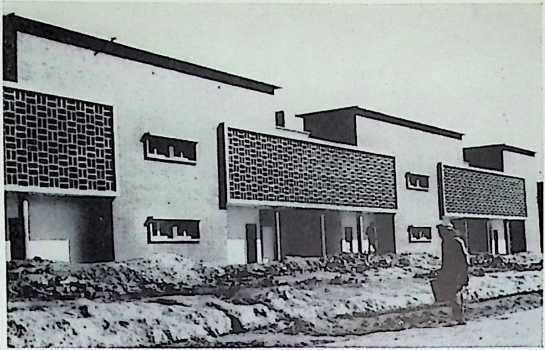
Landsberg and the architects came to the conclusion that the street layout may be 20° out of the wind in either direction and may deviate up to 30° if the house orientation is corrected for the amount of deviation. However, the streets had to be wider in such a case by a certain given percentage, according to the different heights of buildings flanking them.
It was also noted that winds would not follow the street in a change of direction. The buildings on a street curving away from the wind, beyond the 20° to 30° limits stated above, would be in calm. Yet this could be overcome by increasing street widths and distances between buildings for dimensions less than 100 feet.
In Punjab, the cooling to be had from the daytime macroclimatic wind is of a relatively small effect, since the average velocities are only a few miles an hour in the hottest months of the year and seldom greater than 15 m.p.h. However, nighttime cooling slope breezes, microclimatically induced, are important. They are capable of ventilating well any buildings that are widely spaced; that is, to an extent where there is at least twice their depth between endsand twice their height between fronts and rears facing the -wind.
Figure 224 {right). Three neighborhood super blocks, Chandigarh.
The daytime breezes, nevertheless, had some considerable influence on the city plan in this respect: they obliged the designers to select the best location for the industrial area as being to the west and southwest, to avoid smoke and odors being carried over the city. Smoke from the railroad and yards on the east side was prevented from drifting over the Capitol in summer by placing a park strip 600 feet "wide, with close planting of tall trees as a screen on the windward side of the yard.
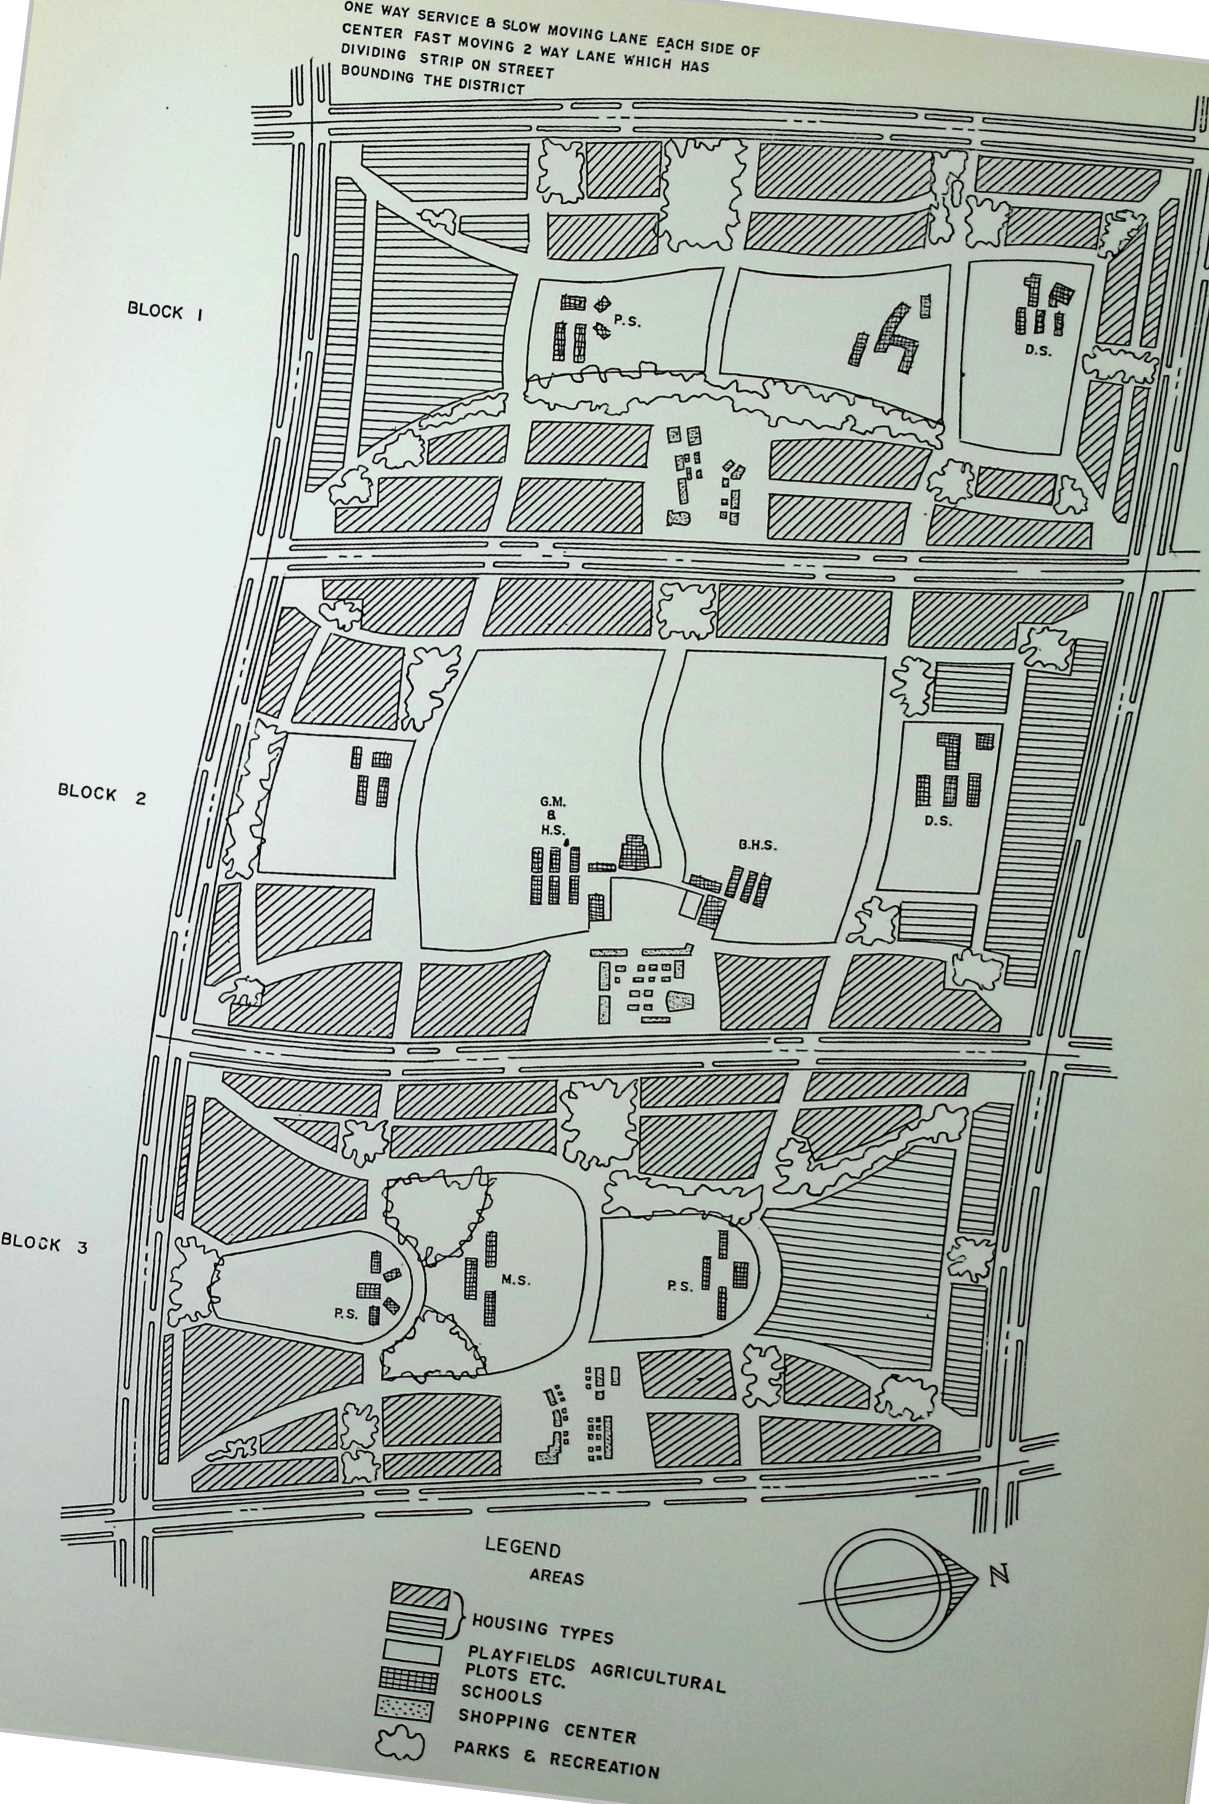
This will have the effect, as can be realized from comments earlier in this chapter and in the next, of setting up local wind turbulences, which, in turn, will precipitate soot from the air and eliminate the smoke pall over the Capitol area.
As far as the blocks were concerned, the general scheme was one of open planning, with considerable vegetation to prevent the building up of solar heat. It was suggested that house plans have openings directly opposite one another, with no obstructions interposed. As in several schemes by Raymond and Rado which have been noted already, it was thought appropriate to recommend only door-height partitions inside. It was also proposed that roof ventilators, protected from rains, could provide some additional ventilation if installed in the center of houses. Protection from the sun could be obtained by using overhangs of horizontal and vertical louvers, with slat spacing recommended as being at least twice their width.
Illustrations of such ideas were sketched by Matthew Nowicki prior to his tragic death. Several are included here. (Figures 225 to 228 inclusive.) It must be noted that Mayer and Whittlesey prepared the master plan for implementation by the Indian authorities. The various housing units, as suggested by Nowicki, are being developed in India and by Indian architects, although E. Maxwell Fry and P. Jeanneret are under contract as resident architects, and Le Corbusier carries on his duties as chief architect from his Paris headquarters.
Incidentally, Mayer and Whittlesey design towns, too, in more temperate regions. To cool off they go to Canada, where they have prepared the master plan for the new town of Kitimat, British Columbia, for the Aluminum Company of Canada. Situated in the foothills of the Rockies, on the Pacific Ocean about 400 miles north of Vancouver, many problems were posed by the topography and by the climate; the same team of Mayer-Whittlesey-Glass-Landsberg handled this challenge admirably.
Although illustrations of this project are not available at the time this manuscript is being prepared, we may dwell perhaps for a few moments on the climatic situations which influenced the design of the town. The approach of the architects was this:
Sunshine is not a major factor in winter, although buildings, especially schools, it was decided, would have to admit a maximum of light. And, since it never gets very hot in Kitimat in summer because the temperature is modified (as it is year-round) by the sea, the sun is not very much of a problem even then. The winds, however, have to be considered very carefully, especially insofar as the cold northerly ones in winter are concerned. Not only are they uncomfortable but they help to cause snow drifts. Yet, downslope breezes on summer nights were to be desired as a cooling element, unless one was situated in low areas where there are likely to form very large pools of cool and damp air.
As this is the plan of an industrial city, smoke directions had to be taken into account. Not infrequently could smog situations occur in
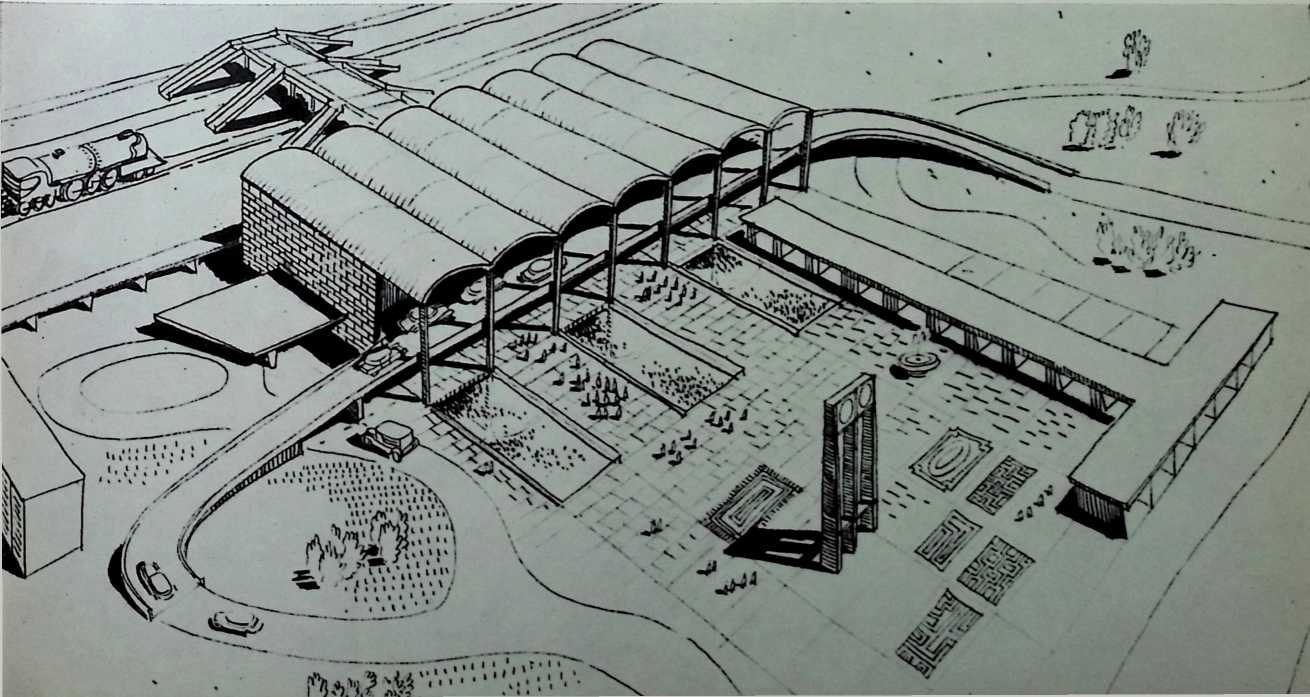

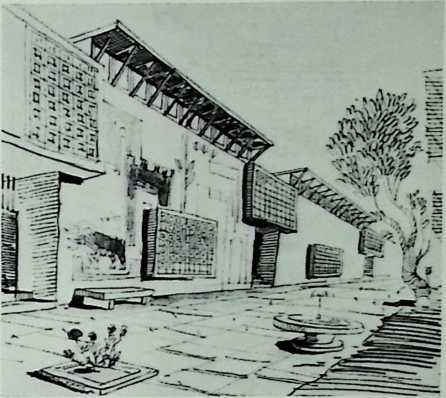
Figure 227 (left). Civic center, Chandigarh. Figure 228 (below). Proposed railway station plaza. All sketches on this page are by Matthew Nowicki.
Figure 225 (left). Chandigarh super block.
Figure 226 (below). Super block.
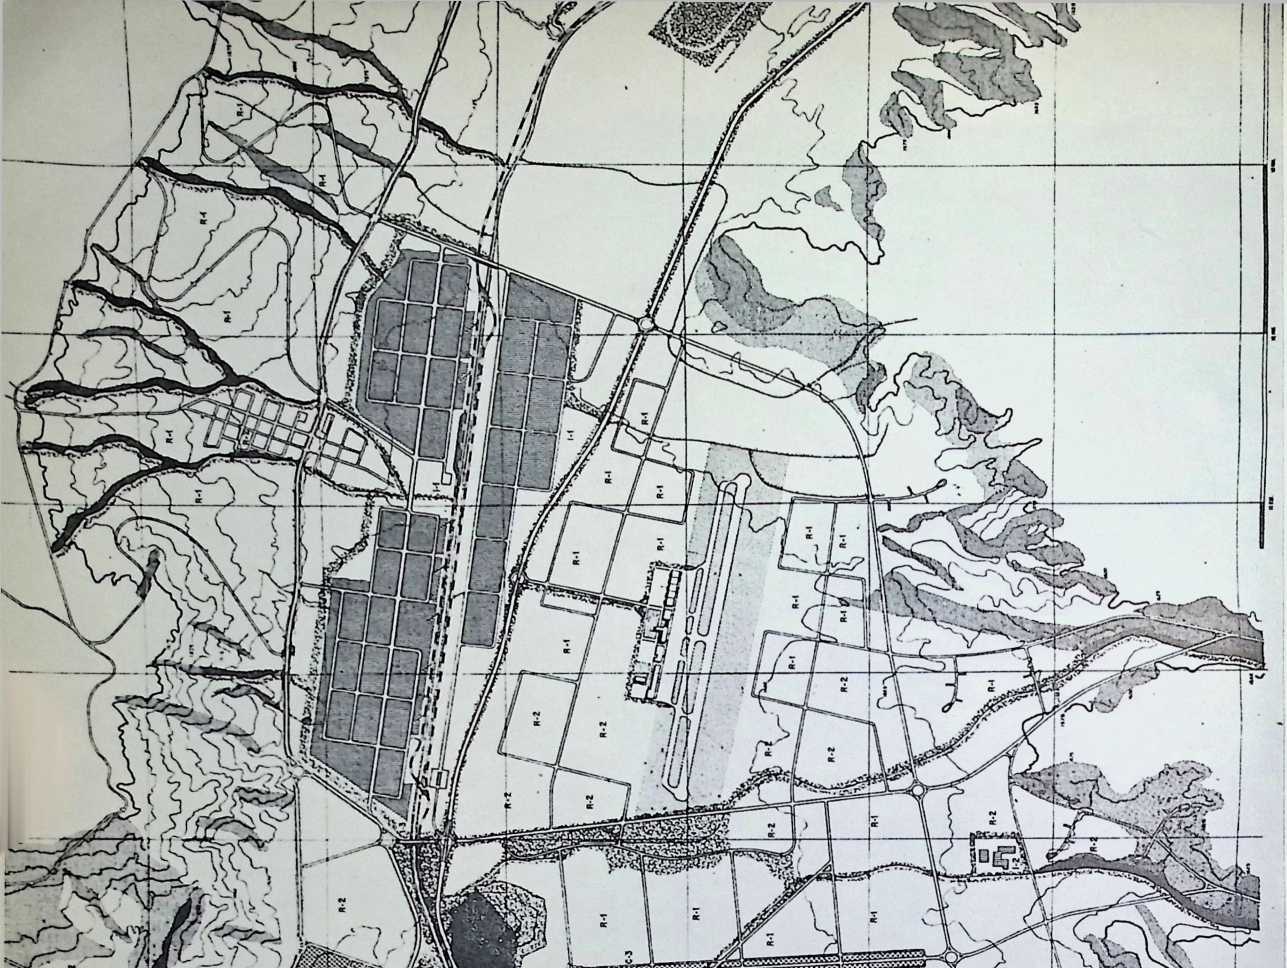
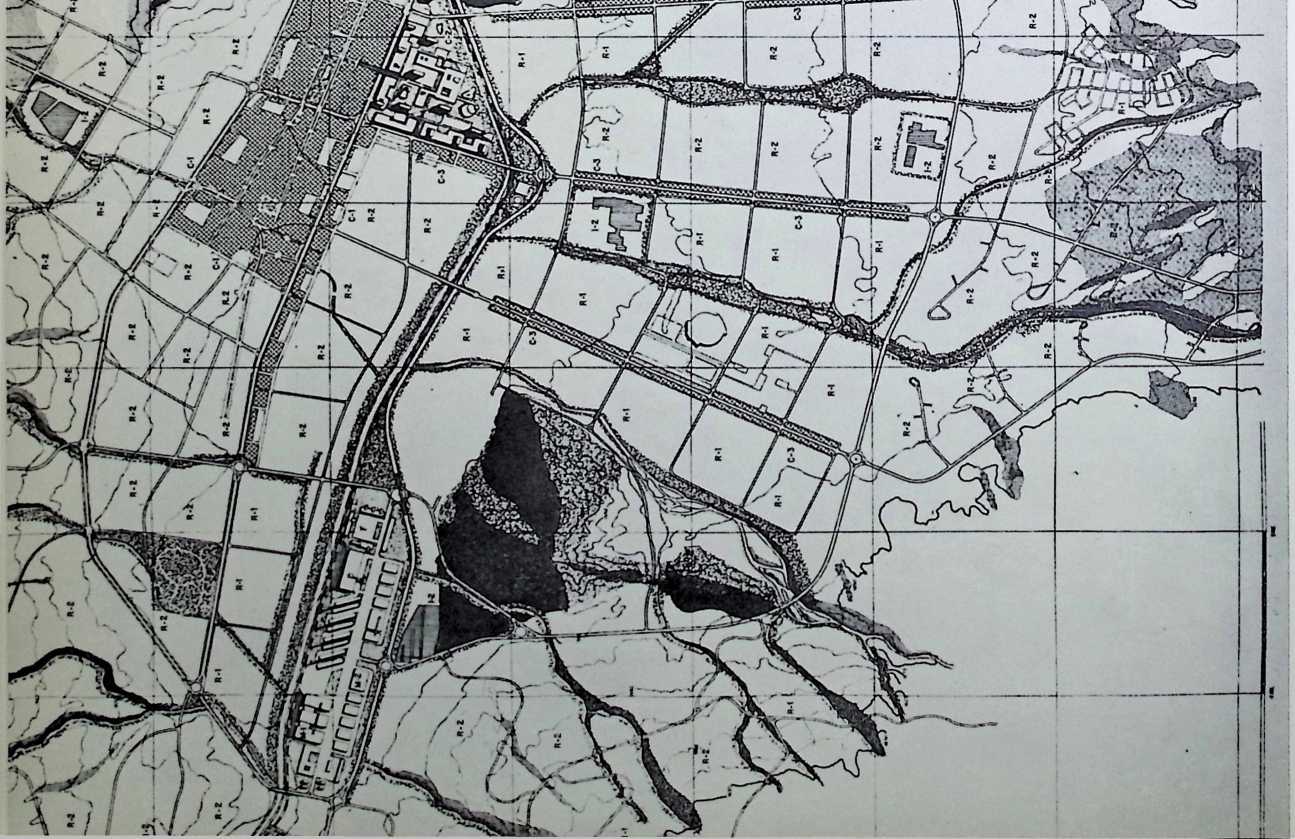
the deep valleys; such smog conditions would not be dangerous unless fluorides were loosed. However, if residences were placed above a certain height, as was proposed, there would be no need for the inhabitants to worry about any harmful or unpleasant effects.
Two other architects who have been very active in paying considerable attention to the climate in the course of designing cities are Paul Lester Wiener and Jose Luis Sert. Among those towns on which their Town Planning Associates organization has worked are Medellin, Cali, Bogota and Tumaco, Colombia; Chimbote and Lima, Peru; and Cidade dos Motores, Brazil.
Figure 229 (left). Master plan of Medellin, Colombia. Paid Lester Wiener and Jose Luis Seri, architects. North is at left of illustration.
In Medellin, the topography has greatly influenced the design. The Medellin River forms the axis of the long, narrow city and predetermined the location of a number of areas. The river was also susceptible to overrunning its banks and had to be restricted by means of dikes, which problem, with regard to other towns, will be discussed in the next chapter. However, insofar as possible, the layout of the town was governed largely by the local climatic conditions. For example, the winds, which come from the north, suggested the placing of the industrial quarter to the south, as shown on the accompanying plan (Figure 229) in dark cross-hatching, so that smoke and other impurities loosed into the air would not disturb the residential quarters; this is despite the fact that the factories use for the most part only electrical energy. In addition, the architects have isolated all industrial areas by means of green belts, which not only screen these quarters from view but also trap any unpleasant odors, smoke, etc., which may start wandering.
Tumaco was a particularly interesting problem for Wiener and Sert, for it involved the creation of a complete new city on an island off the southwest coast of Colombia just north of the Equator. Composed of twelve thousand inhabitants, the old town had been destroyed by fire in 1947, and it was decided to situate the new one on a neighboring island, where it is hoped it will eventually become a center of commerce, handling all exports for the western outlet of the Amazon basin and all imports from foreign Pacific cities destined for Colombia.
The neighborhood units planned for Tumaco will be of two main types, but with considerable variety in layout and orientation. The actual dwelling units will be divided into four main types, two of which are reproduced below. Note in both of them that the principles of native construction have been followed, as suggested by the picture of a native dwelling on stilts in old Tumaco, shown in Figure 230. In the first the roof is freestanding on columns; it will be used on the rowhouses to provide adequate protection from sun and rain while admitting proper ventilation (Figure 231). In the second, the roof is attached by a slightly different manner (Figure 232) but the openness remains, and the native influence is still evident.
The same theme has been carried through in the design of the public buildings. Figure 233 depicts the proposed church, located in the civic center. Notable is the freestanding undulating wall, open at the top,
Figure 230 (above). Native dwelling on stilts, Tumaco, Colombia. Figure 231 (right). Dwelling unit, Tumaco, Colombia. TViener and Sert, architects.
Figure 232 (below). Dwelling unit, Tumaco, Colombia.
Figure 233 (right). Proposed church for Tumaco, Colombia.
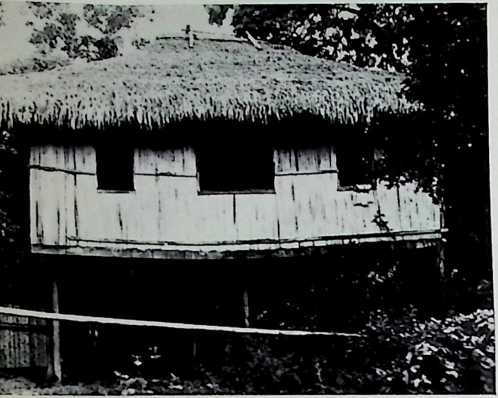
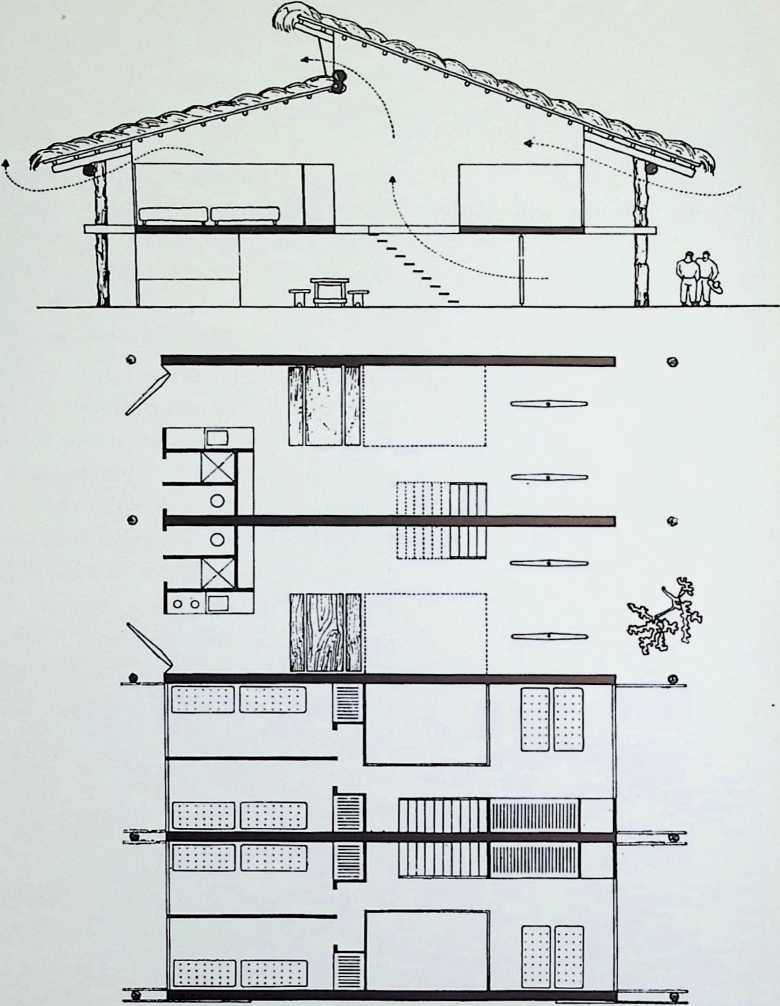
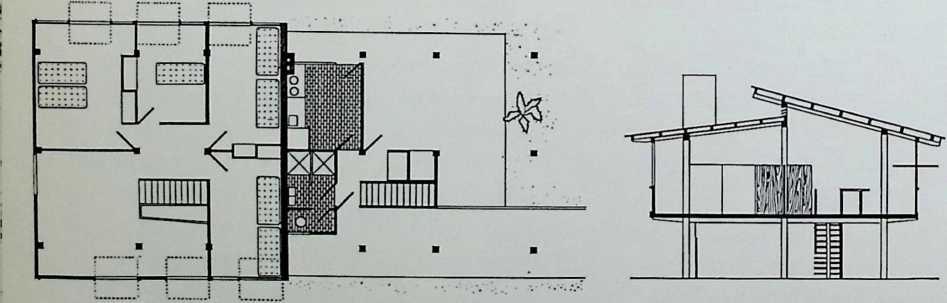
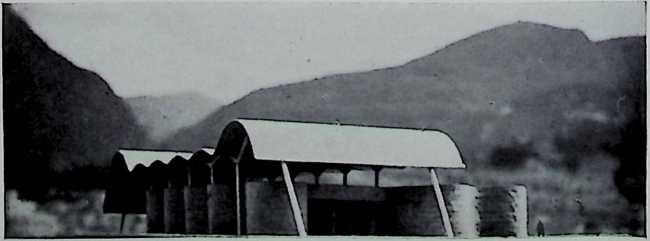
Figure 234. Cidade dos Molores, Brazil. Paul Lester Wiener and Jose Luis Sert, architects.
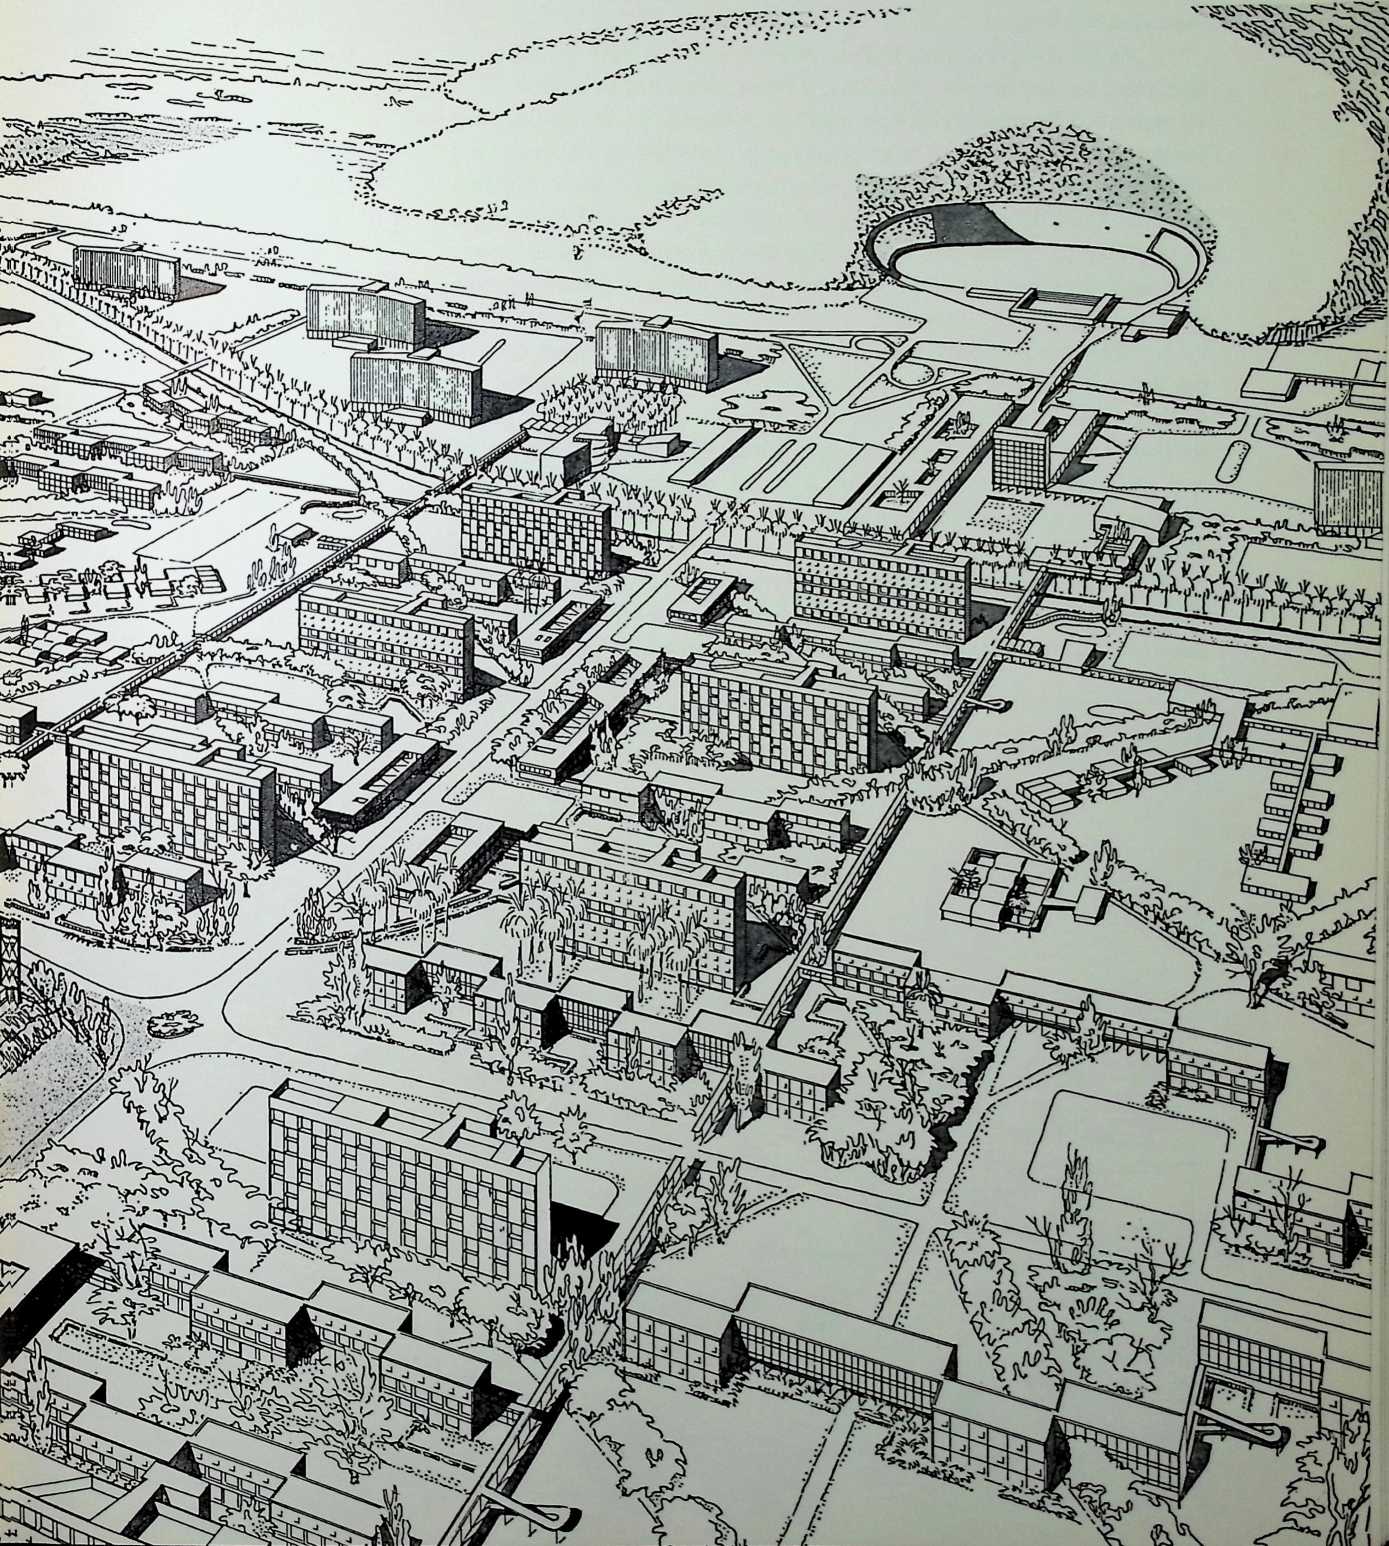
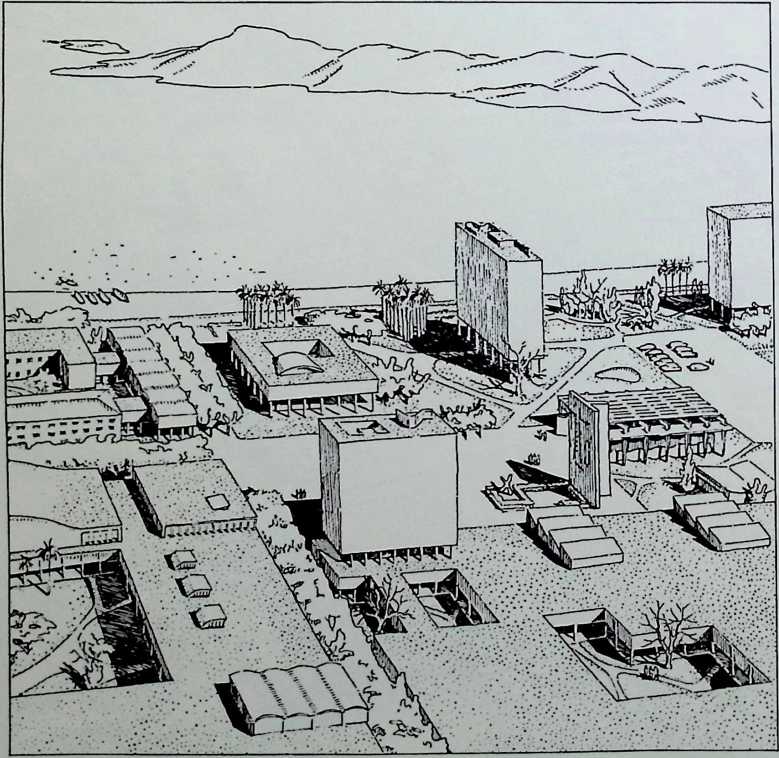
Figure 235. Civic center, Chimbote, Peru. Paul Lester Wiener and Jose Luis Sert, architects.
and the independent roof structure. This system has been found to perform quite nicely in earthquakes, besides providing for the requirements of the tropical climate.
As in other cities, Wiener and Sert have located the industrial quarter in such a fashion that smokes will be blown away from residential areas and out to sea.
South from Tumaco, in Peru, Wiener and Sert have designed the pilot plan for the city of Chimbote, a place which has been labelled as the potential Pittsburgh of that country. Although on the Pacific, like Tumaco, the climate here is extremely dryan effect of the cold Peru current; hardly any rain ever falls, and the inhabitants rely on irrigation from the Cordilleras of the Andes, 23 miles away, to water their crops. In this city the green belt surrounding the industrial area is 50 meters wide and thus fully screens the factories and harbor installations from other quarters.
The civic center is also typical of the climatic approach used by the Town Planning Associates. (See Figure. 235) Note the patios and garden areas in conjunction -with the “parasol septem”concrete slabs on posts, under which there were provided free arrangements of shops and pedestrian sidewalks. A similar feature was entertained by these architects in their conception of the new Cidade dos Motores, Brazil. (Figure 234.) Covered passages connect all neighborhoods with the civic core, so that the populace can be sheltered from the hot sun wherever they go. Yet there is adequate ventilation; for, as suggested by the perspective, all buildings are oriented towards the prevailing breezes.
¶ PRECIPITATION
pre-cipi-tation (pre-sfpI-ta shun), n. 1. Act or an instance of precipitating, or state of being precipitated; that which is precipitated; specif.: a A headlong rush, b Precipitance; impetuosity, c A hastening; acceleration. 2. Client. A precipitating from a solution; also, a precipitate. 3. Meteorol. A deposit on the earth of hail, mist, rain, sleet or snow; also, the quantity of water deposited. 4. Spiritualism. Materialization.
¶ types of precipitation
“I bring fresh showers for the thirsting flowers, From the seas and streams;
I bear light shade for the leaves when laid In their noonday dreams.
From my wings are shaken the dews that waken
The sweet buds every one,
When rocked to rest on their mother’s breast, As she dances about the sun.
I wield the flail of the lashing hail,
And whiten the green plains under,
And then again I dissolve it in rain,
And laugh as I pass in thunder.”
Shelley, The Cloud.
In brief, this is the process that causes rain: a mass of damp air may rise and expand with the decreasing pressure. The relative humidity increases and at a certain height the air becomes saturated. At a still higher level it is said to become supersaturated unless, as in all probability it will, it condenses. This condensation forms a cloud of small water droplets if the saturation level is above freezing temperature. The drops gradually grow in size until they are so heavy that instead of floating around in the air they fall to the ground. This is known as rain.
There are many processes which can cause rain. Air may be cooled and be subject to the above processes by orographical lifting. Or there may be the juxtaposition of air masses of opposing characteristics. The first process will be enlarged upon in a review of the effect of altitude on precipitation, but the latter may require a little elaboration here.
Using Montreal as a case in point, it is, unfortunately, in the line of two main tracks of depressions which traverse the North American continent. One travels west to east. Hare notes the similarity of its course with that of the Canadian Pacific Railwayand it usually travels at about the speed of a fast train! The other “low”as these disturbances are called, by virtue of their pressure characteristicscomes up from the United States along the Mississippi Valley or the east coast. Both hit Montreal eventually, and it is for this reason that the area experiences a number of storms that it might otherwise evade.
By studying the peculiarities of these various climatic factors, or by conferring with governmental or private meteorological officials, architects can estimate the macroclimatic rainfall possibilities for any given area.
If in the case described for the production of rain the saturation level is below the freezing point, the condensation will form a cloud of ice particles which will grow and become snow.
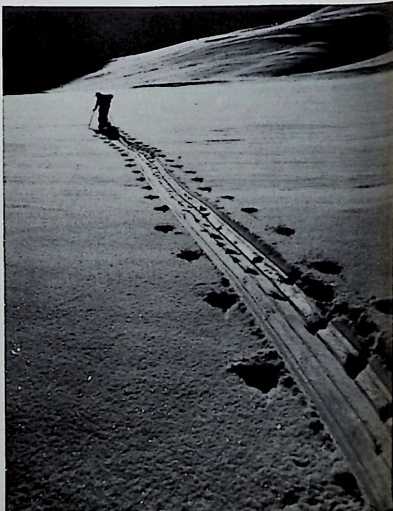 Snow: its polyhedral crystals are some of the most beautiful works of nature. Its attractiveness, however, is minimized by the dirt of the city, and sometimes it is lost completely with the process of snow removal. The architect must learn to live with it rather than oppose it, then the finest harmony of man and nature will arise.
Figure 236. Lapland.
Somewhere above the freezing level in the atmosphere a small pellet of ice may be formed. By strong vertical currents the ice may be carried still farther aloft, where it will gather snow on its surface. It then falls, perhaps only a little, but enough to encourage the formation of another layer of frozen water on its surface. The process may be repeated depending on the severity of the ascending currents. Yet eventually it drops to the ground and is called hail.
From this description it may be deduced that thunderstorms, because of the strong convective motion that occurs with them, will often be accompanied by hailstorms.
Hail is a destructive element in the climate. It destroys crops as well as houses, and much insurance is taken out each year to cover any losses by this cause. In areas that witness a fair number of these showers it would not be wise to provide skylights or other easily-breakable architectural details.
In England, sleet is precipitation consisting of melting snow, or melting snow and rain. In the United States and Canada, sleet is precipitation of grains or pellets of ice. They are transparent and occur when raindrops from warm air aloft fall through a layer of cold air near the ground. This causes a dangerous icing condition and may be more effective than snow in completely stalling traffic along major highways or in city thoroughfares. It is very difficult to notice, for the resulting ground reflections resemble those of a rain-covered surface.
Cars under such circumstances cannot be controlled; the author had an experience of this sort on the Taconic State Parkway south of Poughkeepsie, New York, not too long ago. Supposedly this is one of the best-engineered highways in North America. But as sleet (of the American variety) may occur in any region where cold air prevails even occasionally, planners should make note of the necessity of providing, at least on trunk roads, some protection from such hazards. One method, that of radiant heat piping, will be reviewed in a forthcoming section.
Cumulus clouds may occasionally extend up to great heights. An elevation of 30,000 feet may be expected in Canada and most of the U.S.A., although in the tropics such clouds may reach to 40,000 or 50,000 feet. The tremendous fall of temperature with height in a cumulo-nimbus cloud (as it would be called under these conditions), would lead to great condensation of water vapor. Accordingly, one might expect very heavy storms. Analysis of weather bureau records mil show that the highest intensities of rainfall normally occur under circumstances of this sort; architectural provision for the disposal of excessive rainfall, such as by adequate gutters and leaders, must be made.
Hail and lightning are phenomena that often accompany thunderstorms. The former has been mentioned already. The latter will be explained in a later section.
Fog is actually vapor condensed to fine particles of water, which normally obscures vision near the ground. In fact, except for its position at a low altitude, it is very similar to a cloud.
There are many ways in which fog may be produced. One hears mention of advection, coastal, frontal, ground, ice crystal, radiation, steam, surface or upslope fog. Only a few of these are of interest to architects directly, although city planners may be concerned with them all. All types of fog are nuisances, and efforts should be made to avoid them or to dispel them wherever possible.
According to Petterssen, the most frequent and effective cause of fog formation is the cooling of the air while in contact with the ground. Three types are generally distinguished: radiative cooling, advective cooling, and adiabatic cooling.
Fog by radiative cooling is quite common over cities. It has been remarked that this phenomenon assists in the production of fog and smog over cities at nights, particularly under a cloudless sky, calm air, and high relative humidity. As fog forms around condensation nuclei, all efforts must be attended to prevent the entrance of such particles into the atmosphere. Radiation fog sometimes forms soon after sunset and persists throughout the hours of darkness, when cooling of the air brings the temperature down below the dew-point. Yet the most frequent hour of the day for the formation of fog of this sort is right after sunrise. At this hour the stirring of the atmosphere that is caused by the action of the sun accounts for a mixing of the cool ground air with the warmer air above, causing fog.
Certain areas are more prone to the production of such radiation fogs than others. An inspection of the temperatures over various surfaces at night, and in different sorts of topography, as outlined in the chapter on temperature, will reveal to the architect probable places for their maximum occurrence: areas that are rather cold in relation to the atmosphere at night might receive the most fog in morning. Also, the most humid areas encourage the formation of fog and these should be avoided where fog is considered undesirable, as it is in most cases.
Summarizing, we may expect radiation fog in low places, where frost hollows may be present, as well as over surfaces where minimum nocturnal temperatures may occur: snow, sand, light loam, etc.
Fog may be developed too by advection. It is similar in essence to radiative fog a warm air mass proceeds over a cold body of land or water. Anyone who has cast eyes on the Grand Banks of Newfoundland has witnessed such fog: warm air from the tropics passes here over cold Arctic water. Where this occurs, the only practical method of avoiding it is by moving elsewhere.[12] Of course, very often the fog merely hangs over the sea; if it proceeds inland it is warmed by the ground below in many cases and consequently disappears.
The third most important fog for architects to worry about when siting is the upslope type. This is caused by moist air blowing up a hill or mountain. The reader will recall that there is an adiabatic temperature drop as a result; the relative humidity increases until there is condensation and fog is formed. In the Rocky Mountains there are notable instances where upslope fog is a prevailing condition. On the lee side of the same mountains adiabatic processes will again occur. Here the air is descending and acquiring heat through compression, and chinook or fohn effects may be expected. These slopes consequently will normally be the most fog-free and should be sought out by architects.
The influence of the fog factor in city planning xxTH be examined in a later paragraph.
Figure 237. Rain gauge.
¶ measuring precipitation
This section will be necessarily brief. Very rarely does an architect have occasion to measure precipitation. Differences resulting from the microclimate may be detected by examining the winds, as shall be seen later, and differences due to the macroclimate will not arise except over large areas. Thus there is hardly ever any need for a designer to investigate most types of precipitation. However, here are the methods:
Rain gauges are supposed to have been used in India in the fourth century B.C., according to Victor Conrad in Methods in Climatology. The same author notes that the oldest regular quantitative measurements of rain were made in Palestine in the first century A.D. by a method very similar to that employed today.
The type of gauge now used is essentially a funnel. The diameter varies in each corm try. In Canada an eight-inch size is used at Dominion Meteorological Stations. In the United States, the Weather Bureau uses eight-inch and twelve-inch gauges. However, the size of the gauge is relatively unimportant provided proper precautions are taken to make accurate observations. For example, the gauge should be situated preferably so that it is relatively unaffected by wind which would prevent the deposit of rain in the same manner as in calm conditions. It is normally set in grass; if installed over a hard surface the rain drops are liable to bounce on the ground and back into the gauge, thus rendering the reading inaccurate. The rain is channelled down through a funnel and drops into a container via a small seesaw device which tilts upon the collection of one-hundredth of an inch of precipitation. This is recorded on an electrical measuring clock so that the intensity of rainfall within a given period may be checked. The total is then compared with that in the gauge itself and is marked as the total precipitation for the same time.
Government observations are always made with a rain gauge placed horizontally. Yet this does not always give a true account of the rainfall, as far as architects are concerned; for example, a windward incline will receive much more precipitation than a flat, sheltered area- Says Geiger: “In the distribution of precipitation around a hill, the influence of ground slope is to be added to that of the wind. What is always of most interest to the practical man is the precipitation falling on the actual inclined slope, not that which falls on the artificially located horizontal mouth of the rain -gauge, which, moreover, is a meter above the ground.
“Comparative measurements of a horizontal rain-gauge and one whose mouth was parallel to the ground surface on the Hohenkarpfen showed that the 20° slope on the side of the hill turned toward the wind received more precipitation than the level ground. The excess resulted from the wind velocity prevailing during the rainfall. This excess was as follows:
At wind-speeds below 4 m per sec 3%
At wind-speeds of 4 to 5 m per sec 11%
At -wind-speeds of over 5 m per sec 27%
In a single case (thundershower) 34%
“The brisker the wind, the more obliquely the rain beats down and the more this favors the sloping ground. On the side of the hill which is sheltered from the wind, however, where the rain falls straight down, 5% less was measured on the slope than in the horizontal gauge.”
It is very difficult to measure snow accurately. First of all, the sample must be taken in a place that may be considered representative of the general conditions. Snow tends to accumulate in the lees of hedges and other obstacles; consequently there are rapid variations in snow depth. The site where readings are made should be such as to prevent the snow from blowing away but not too large, in which case drifting might arise. This is the method for the observation of the macroclimatic snow, as recorded by various weather bureaus. Yet architects may conceivably want to investigate the depths of drifts instead, and they would be perfectly justified in doing so at any given location without observing the above recommendations.
The architect may want to have information on the depth of snow itself or the depth of the water equivalent of snow. Both will be useful to himthe former in determining snow loads for roofs, etc., and the latter for estimating sizes of gutters, leaders and drains. The first may be obtained by stick measurement, and the second by either melting the snow or assuming an arbitrary index; for example, ten inches of snow equals one inch of water. Most Canadian Government stations use the last method for meteorological measurements. But here are the comments of Kimble and Bush in their book, Weather. “Many folk will tell you that there is no difficulty … . that all you have to do is to divide the depth of newly fallen snow by 10 and read off the answer. However, there is snow and snow: depth for depth, light fluffy snow may have less than half the water content of fine, crystalline snow or sleet. The only proper thing to do is to melt the snow down. . . . Generally, the gauge gives you short measure. . … Only in calm weather is the gauge method likely to yield satisfactory results. At all other times it is advisable to rely upon measurements made with the help of graduated vertical stakes placed at intervals over the open ground. By using a hollow sampling rod, cores of snow (equal to the depth of snow that has fallen) can be taken from the vicinity of these stakes: melted down, these will give a very’ fair approximation of the water content of the latest snowfall.” Thus, the official instructions of the United States Weather Bureau call for converting freshly fallen snow to its water equivalent by adding a measured amount of warm water. The same procedure is followed in the case of packed snow, unless the station has the proper equipment for weighing a measured sample.
Precipitation is made up of the rainfall added to the waterequivalent of snowfall and all other forms of frozen precipitation, such as hail, sleet, etc.
The average annual precipitation, like most weather data in average form, is not apt to convey much to the architect. It may assist in advising whether a site is located in a wet or dry climate; but in such a case one must also consider the temperatures in the area. For, as an example, a rainfall of one inch would take a longer time to evaporate from the soil in cool regions than it would in a hot area.
In Figure 238 is a map of average annual precipitation in the United States. This map, and succeeding ones, are illustrated through the courtesy of the Weather Bureau, United States Department of Commerce.
The map in Figure 238 becomes more useful for an architect when the information is broken down. Thus, the four following maps show precipitation in inches for the United States for the four seasons.
Information on the average number of days with precipitation of 0.01 inch or more is perhaps rather useful. When one considers influencing factors in the course of designing a building, this type of chart will tell how often precipitation will occur on the average, and one can weigh its relative effect along with other elements, climatic or otherwise.
Statistics on the maximum precipitation in one hour are the most useful in determining run-off requirements in the process of designing roof gutters and leaders, sewers, and drainage ditches. The chart below represents the maximum recorded in the United States in one hour over a 40-year period. It is suggested that one add a safety factor of, say, five percent, to account for any future severe conditions, and design accordingly if economically feasible. However, it must be pointed out that these maxima may occur so infrequently in some regions that perhaps it is not always necessary after all.
The chart on maximum precipitation in twenty-four hours can be applied for purposes similar to those mentioned above.
The average annual snowfall is interesting to know, although it is not too important for architects, except insofar as spring flood predictions may be derived partly from such knowledge. Although the maximum snowfall to be expected is of greater use to architects, since snow load predictions and other calculations (with appropriate safety factors added) are based on such figures, there is presented here just the average snowfall in isoline form, because it is the only one available.
Figure 238 (right). This map and the succeeding ones are printed through the courtesy of the Weather Bureau, United States Department of Commerce.
233
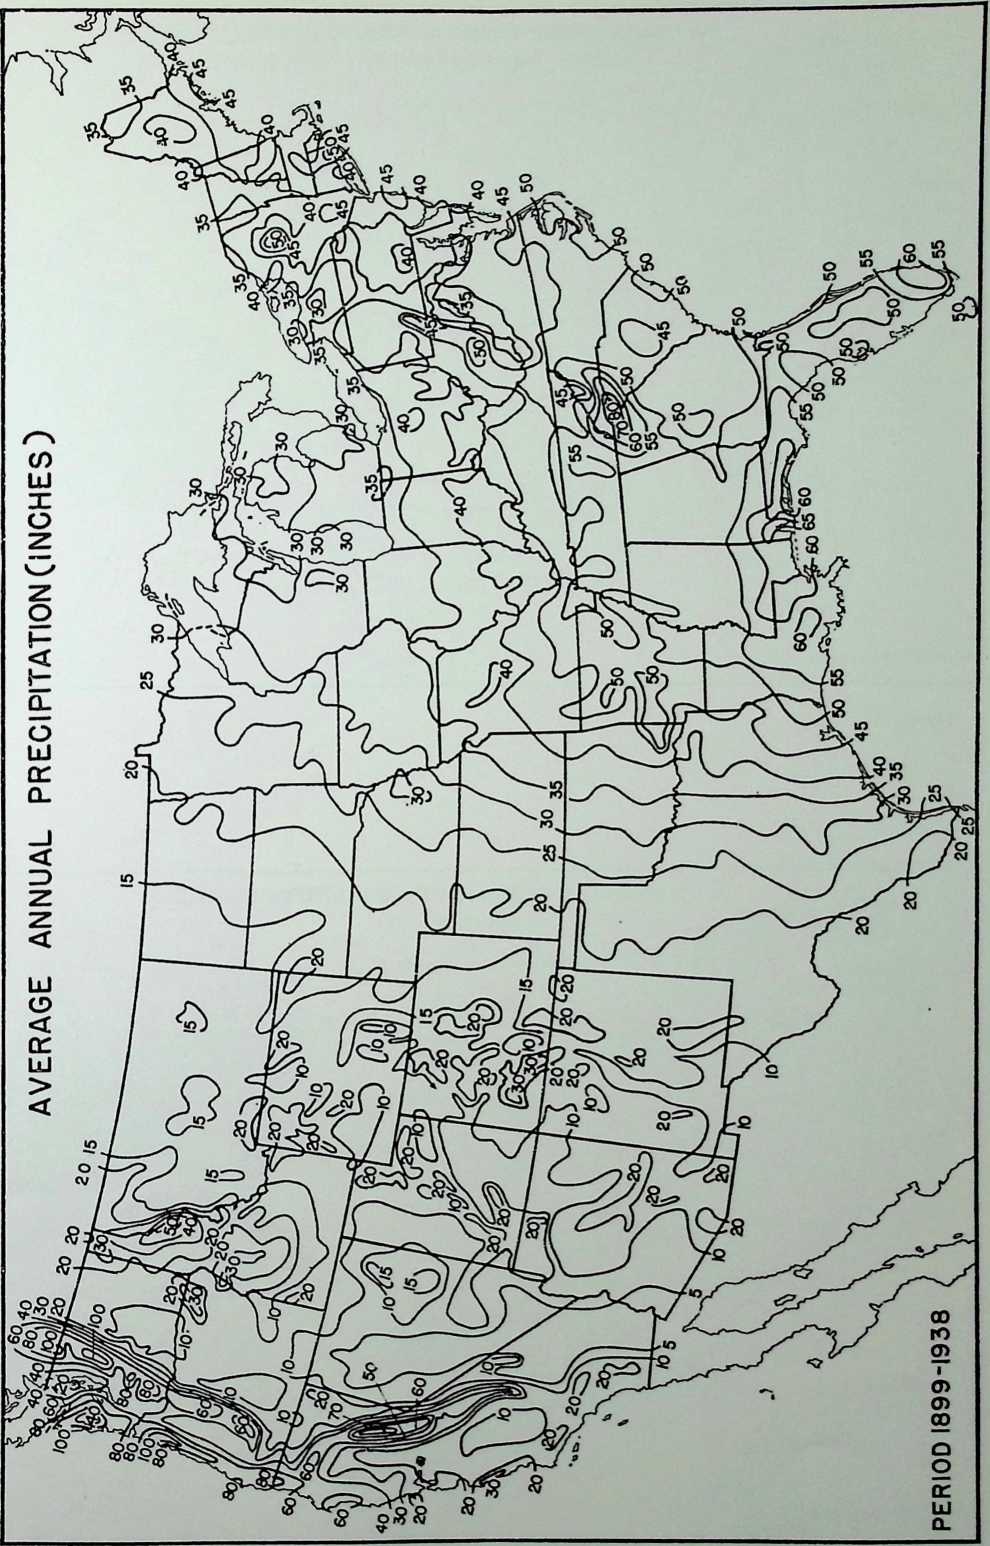
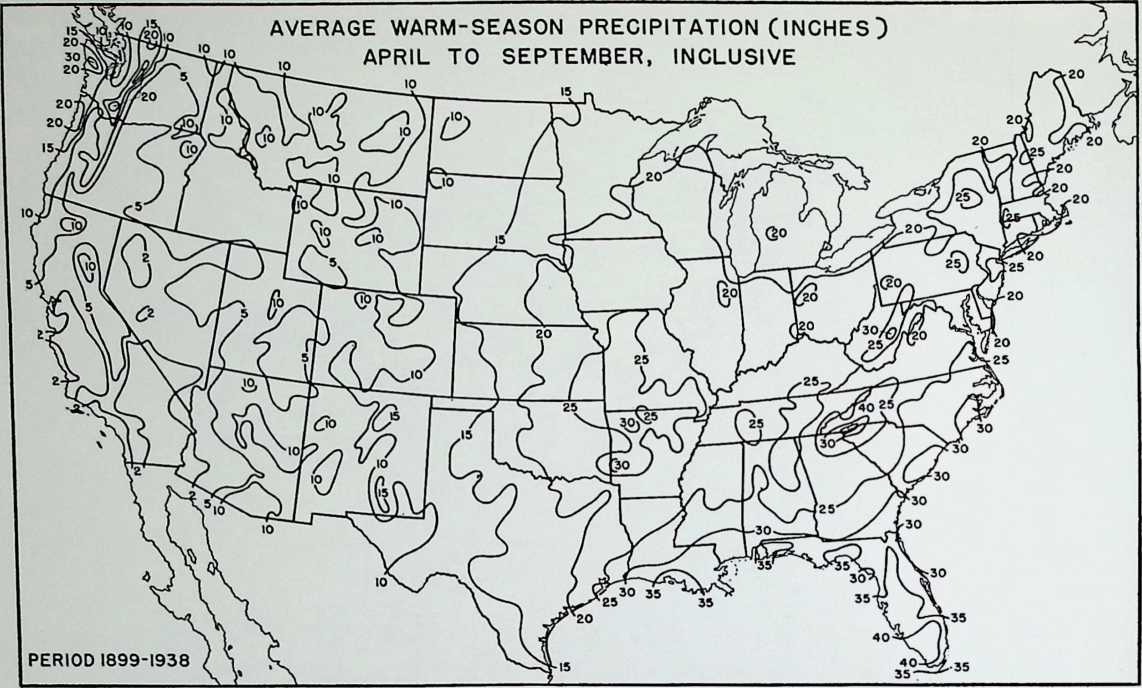
Figure 239
Figure 240
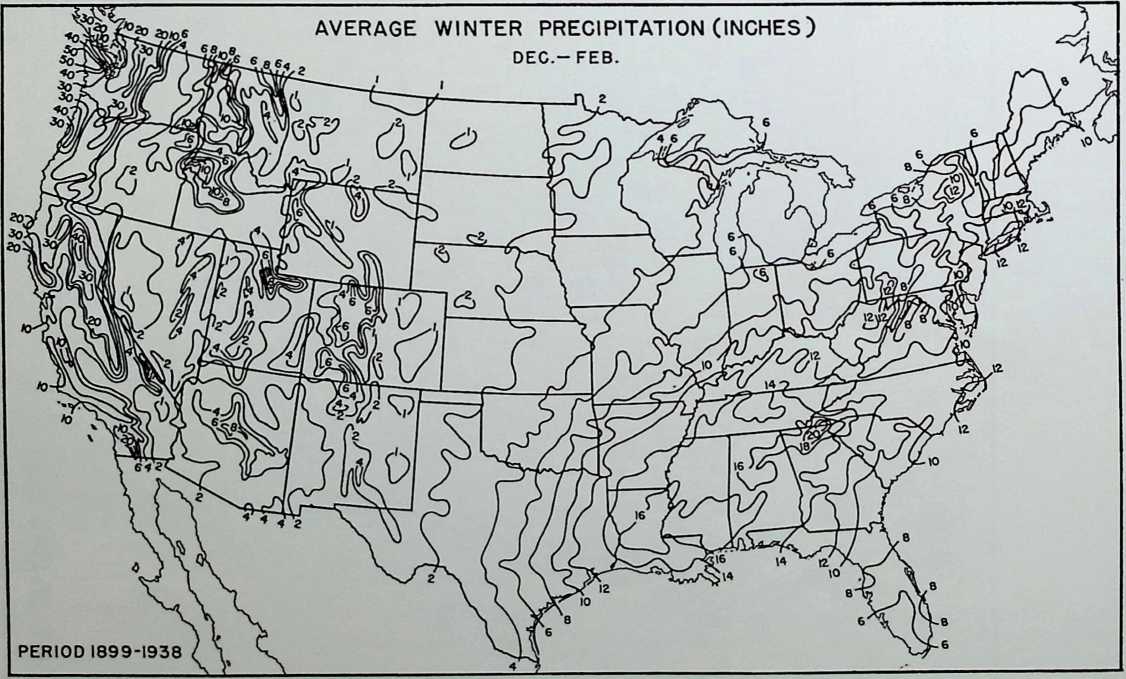
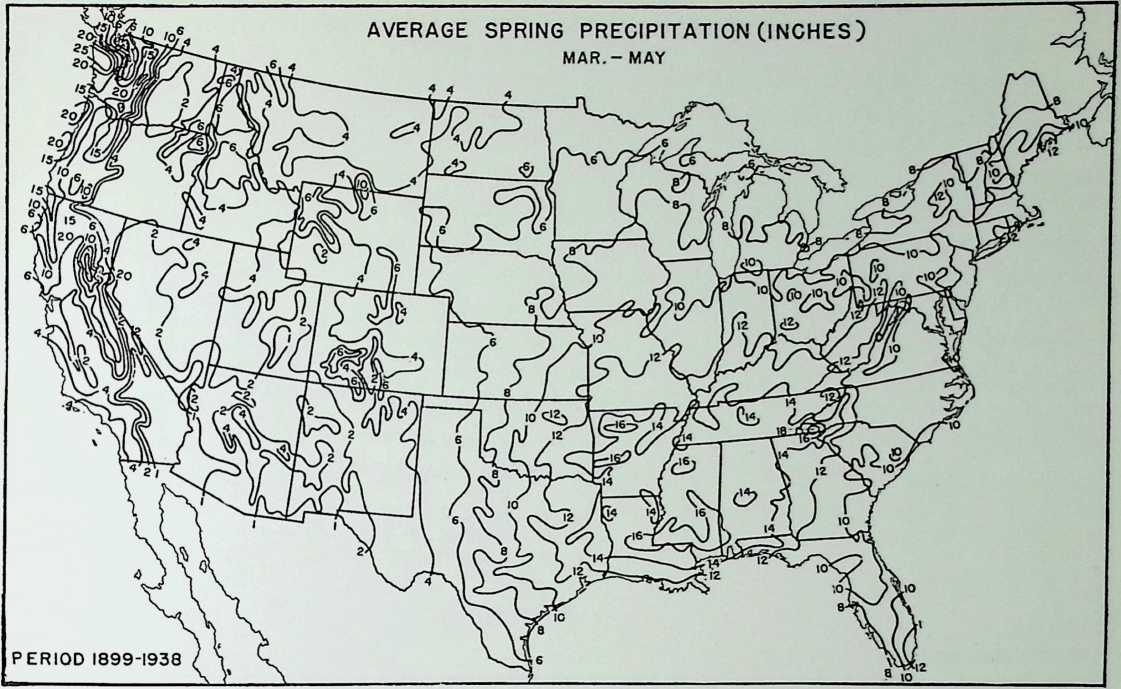
Figure 241
Figure 242
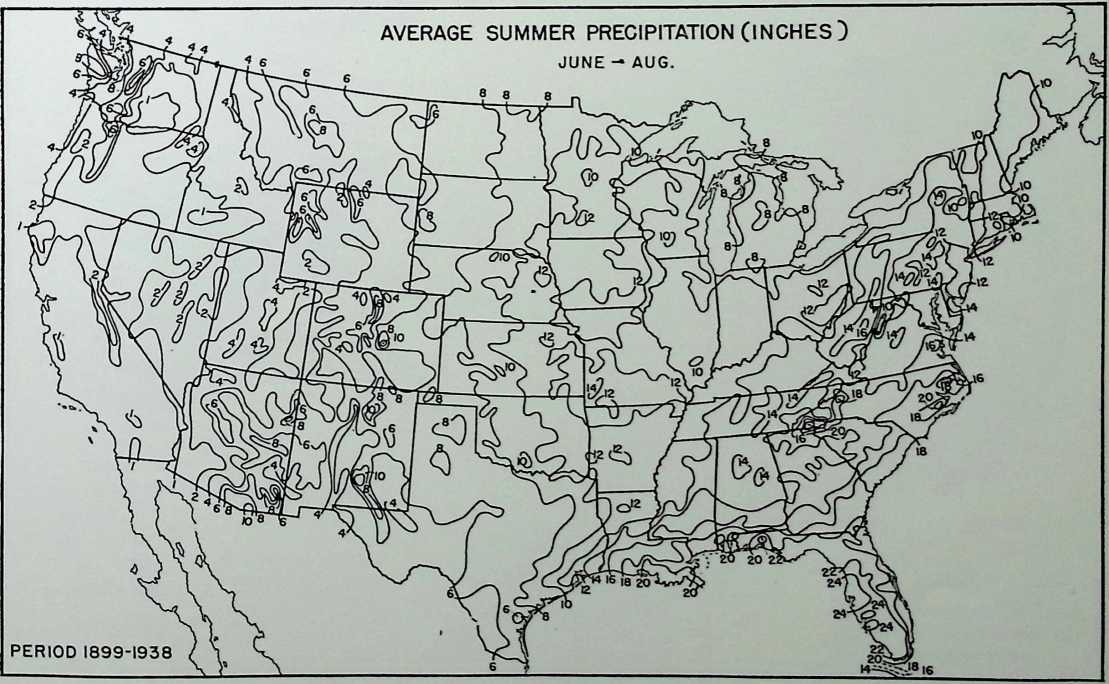
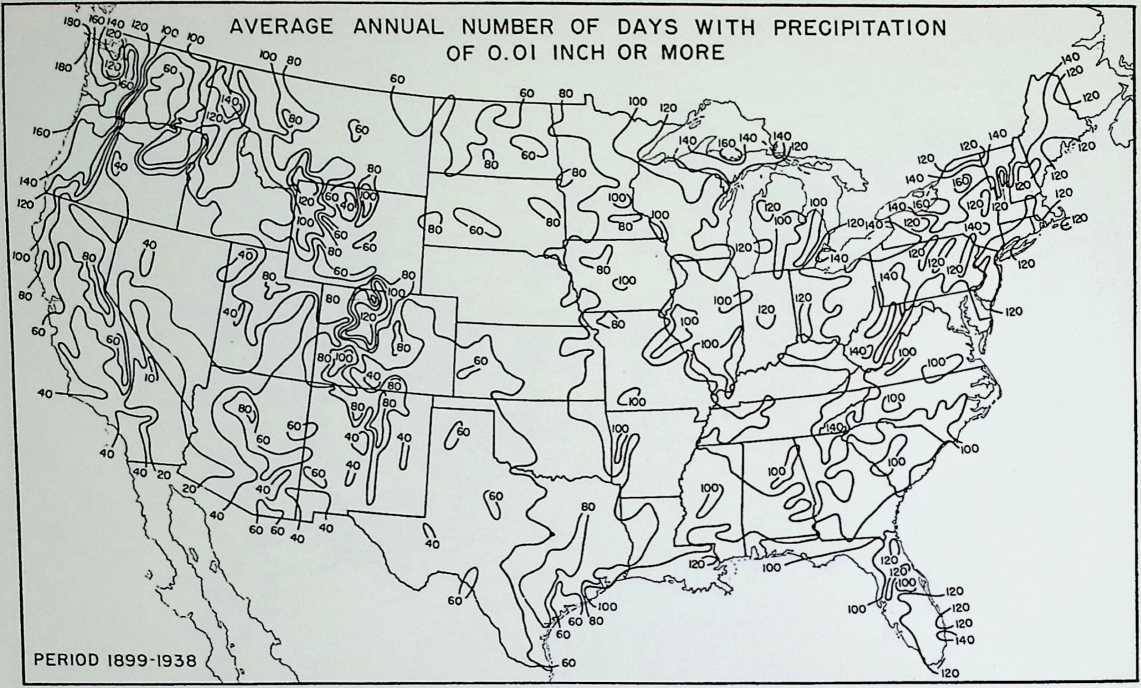
Figure 243
Figure 244
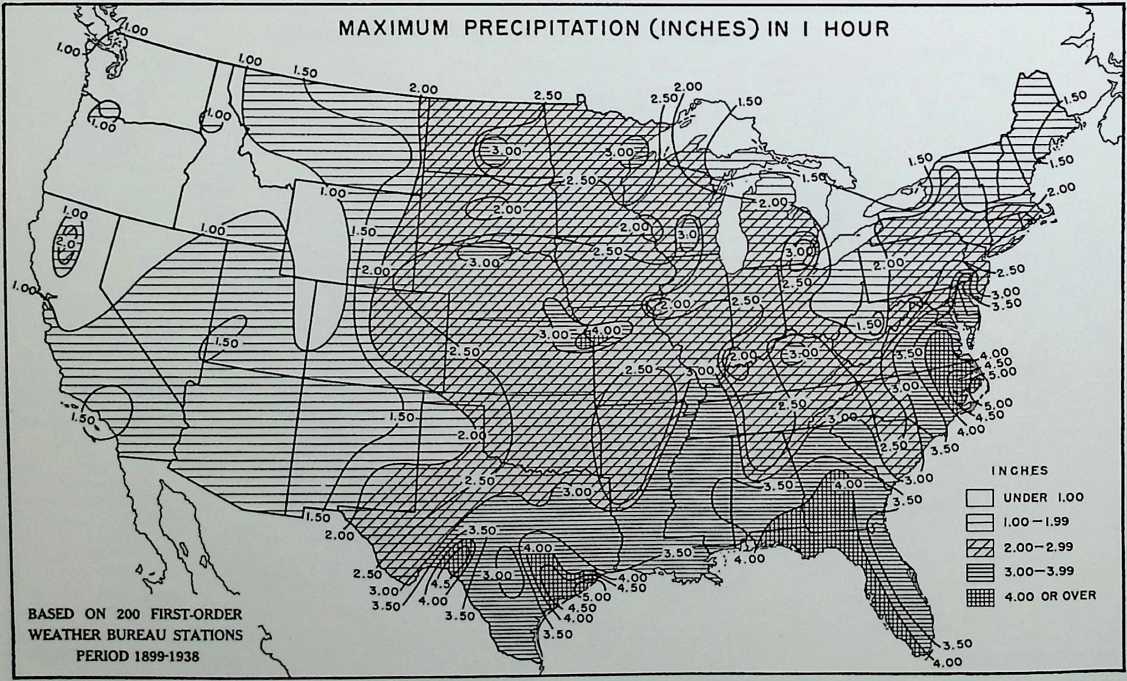
The map for the average annual days with snow cover may assist in weighing various influencing factors that present themselves in the course of designing buildings. From it, one can derive the percentage of the year that one has to contend with snow.
It is also of interest to investigate, if the data is at hand, the maximum rate of snowfall in twenty-four hours or in shorter periods, and the maximum rate of rainfall for given intervals less than one hour the latter again to determine leader sizes. One might also investigate the number of thunderstorms to be expected on the average during the year, together with their probable directions and intensities.
As far as hail is concerned, in the author’s opinion it is just necessary to determine if any hail occurs at the site of the building. Most areas in the United States experience at least one hail storm a year, which means that architectural details should be such that they will not be damaged by such storms.
Figure 245
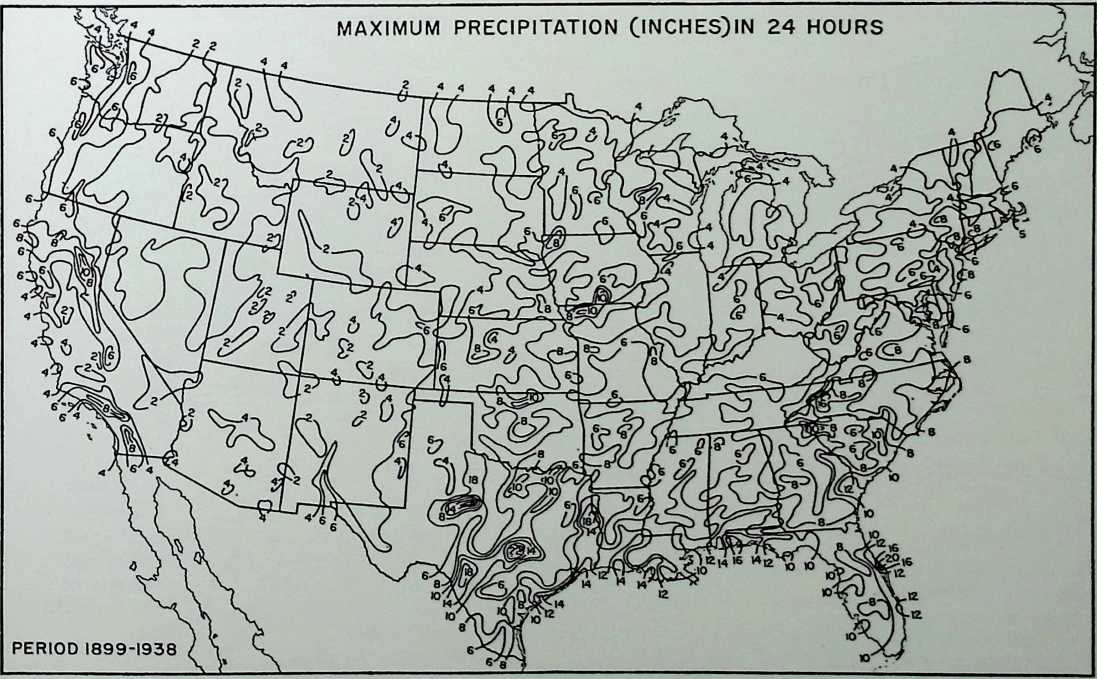
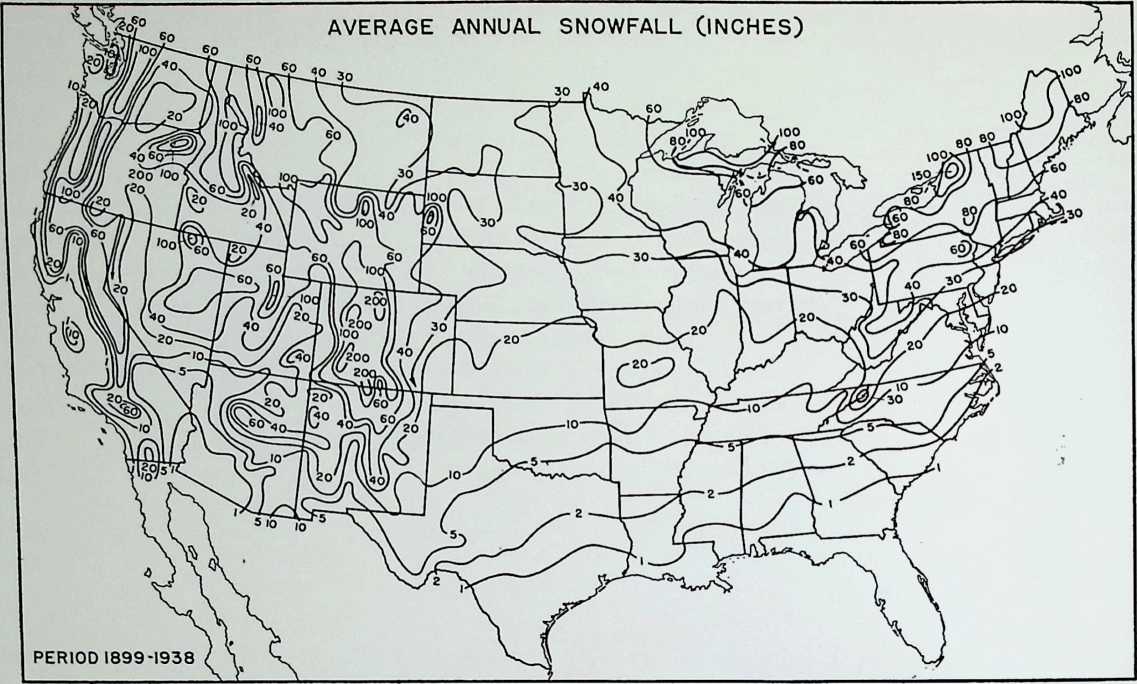
Figure 246
Figure 247

¶ design and precipitation
The advantages and disadvantages of the precipitation in an area must be considered carefully by the architect before he designs a house or development.
Disadvantages
Advantages
Insulating quality of snow Moisture is a cooling agent Rain washes away dirt Psychological effect, aesthetics Reflects beneficial radiation
Snow can pile up in unwanted places Moisture is damp and annoying Possible floods by showers themselves or by the consequent over-flowing of rivers, streams, lakes.
Sleet is hazardous
Damage from hail
The types and amounts of precipitation received in an area depend upon a number of macroclimatic and microclimatic conditions.
¶ macroclimatic conditions
Mountains are conducive to the production of precipitation because they force air to rise and cause one of the following things to occur: the air is cooled adiabatically (that is, it loses temperature with height) and is forced to release some of its vapor; a small depression, which would eventually build up anyway, is disturbed by the mountains and is rapidly enlarged, resulting in immediate precipitation.
But whatever the reasons for increased rain and snowfall, architects may be advised that the windward sides of mountain ranges are normally the wettest. One has only to regard the Rockies, Andes, and the Himalayas, or even the Laurentiens and Adirondacks, to perceive the validity of this statement. Also, the leeward sides are regularly the driest sometimes they even approach desert conditions, as in the eastern part of Argentina.
The macroclimatic precipitation for any given locality in Canada may be obtained from the local Dominion Meteorological Office or from the headquarters in Toronto. In the United States one may contact the local office of the United States Weather Bureau or the head office in Washington.
Continuing the review of the effect of topography, which is really connected to the height factor, we may apprise the reader of the fact that precipitation increases with altitude. In the tropics this extends only up to a certain elevation and may even do so in temperate latitudes, although this is uncertain because in the temperate zones most of the precipitation is in the form of snow which gets blown around and offers obstacles to accurate observations.
Whatever is the quantity deposited, precipitation at high levels may be a nuisance to buildings. In the case of snow there is the danger of avalanches; in many corm tries these have wiped out entire villages. Where rain is involved, water may dislodge rocks and start landslides of a nature similarly destructive.
A lodge for alpinists is, in the author’s opinion, the only structure suited for great elevations of this sort. Yet clients would probably have to seek alpine architects and perhaps alpine climatologistsbefore building operations could get under way. (A helicopter is suggested for ease of approach.)
The only similarity between an orange that a grammar-school teacher employs to instruct classes in geography and the real earth is the general spherical shape of the two objects. If the earth had the same exterior appearance as this fruit, climate would be a consideration only of the latitude and time of day or year. As it is presently formed, however, the earth is composed of different bodies of land and water which play effective roles.
The significant temperature differences over continents and oceans have been mentioned elsewhere. These geographical regions give rise to diverse pressure systems and air masses. Those of a watery origin contain many more possibilities for casting precipitation than those developed in a dry-desert area. It has been found that rainfall over large seas and oceans is therefore greater than that over land, and between the two there is a transition area that we are interested in.
But here it ends. It is fruitless to generalize. There would be too many exceptions. Estimation of future macroclimatic rainif it is permitted to term it as suchmust be resolved on the basis of the existing archives.
Maximum rainfall, except in certain regions that enjoy a “Mediterranean climate” or are in the equatorial belt, occurs over most of the globe during the summer months.
However, although the rainfall is greatest in the summer, so is the evaporation. The two must be considered concurrently in order to determine the advantage or nuisance to architecture as the case may be. Much literature has been issued on this subject and many theories have been proposed. To cover such a topic completely would take too much space; to cover it in a few pages would do it injustice. Those readers desirous of further elucidation may refer to any of the sources listed in the bibliography.
The time of day has a great influence on the formation of fogs. This has been touched upon elsewhere. However, according to F. Kenneth Hare, there is no distinct variation for rain, in North American cities. In the tropics, there is often found such a variation, however; West Indian Islands can count on, in most instances, a rainfall at exactly the same time each summer afternoon.
¶ microclimatic conditions
The chapter on wind taught us that the highest speeds of the flow of air occur on the windward side of a small hill. It should be noted that the distribution of precipitation is partly governed by such action. Where the wind velocity is great, there is a relatively light fall of precipitation compared with that on the other faces, exactly the reverse of the situation in large mountains.
This phenomenon has been well understood as far as the accumulation of snow is concerned but not so in the case of rain. However, it is often observed in nature. In the fall of 1950, students of architecture at McGill University were engaged in a project of land subdivision in the town of Oka, Quebec. From aerial photographs the author recognized that vegetation was invariably distributed on the east sides of hillocks; in this area the prevailing wind is from the west. It was suggested that the plants grew in greater abundance to the leeward side because more moisture was available there.
In this regard architects may concern themselves with two problems. The first, with reference to siting, is whether to put a building on the windward side of a hill so that it will be as dry as possible. The second, with note of the building itself, is how to provide for excess moisture if the building is on the wetter lee side.
The subject of snow accumulation will not be discussed under this heading. The reason: it behaves in a similar fashion around buildings and other obstacles as it does around snow fences, in which category it may be more appropriately handled.
Topography can also influence selection of sites in that it affects the flow of water down certain slopes. In spring this is especially objectionable. Rivulets, although of a picturesque and poetical quality, may develop into large streams and will erode the earth considerably. Preferably, siting should not be made in such locations; but if there is utmost necessity for building here, there are several measures that can relieve these difficulties to a certain extent.
The object is to minimize the run-off water. Where country locations are under consideration, proper cultivation of the surrounding land can greatly assist in the fulfillment of this aim. Crop rotation, strip farming, terracing, contour cultivation, contour ridging, contour furrowing, rotation grazing, and reforestation are a few of the means. The character of the vegetation is a factor of special importance: “a dense cover provides a canopy that intercepts a portion of the rainfall and returns it to the air by evaporation without permitting it to reach the ground,” note Ringland and Guthe. They also note in Climate and Man: “This same canopy also breaks the impact of the rain on the ground, thereby retarding soil dispersion and the clogging of the pores in the soil. Stems and fallen leaves of plants obstruct the overland flow of water and in combination with roots furnish an important means of soil stabilization.”
Tillage along the contour on slopes will increase the detention of storm water on the ground but only up to a certain point. Continued cultivation has the disadvantage of lowering infiltration rates by destroying the soil structure.
Professional architects should not cast aside the significance of the above remarks. Flooding can be a hazard as well as a nuisance. Results of damage due to such causes will be exposed in the section on city and regional planning with regard to precipitation.
A photograph of a snow fence on the McGill lower campus is shown in Figure 248. Note that the fence is placed away from the road it protects and that snow piles up on the lee side to advantage.
Another photograph at McGill, taken of the Carleton Road snowfence behind the Cyclotron, is shown in Figure 249. This fence stopped the snow, but in the wrong place. It was improperly positioned. Snow fences are designed to form drifts where they are not of any inconvenience. Thus the snow will not accumulate in those areas which can be used otherwise. The principle involved is that the open fence hinders the forward thrust of air, and in the resulting area of relative calm drifting snow will deposit itself.
The use of windbreaks formed by trees has an influence on the path of the snow. They should be positioned with regard to the buildings and roads in such a manner that they will not cause the accumulation of snow at entrances or in other outdoor usable areas. This is very important. Where the vegetation is extremely thick, dense and tall, the snow will probably collect on the -windward side; otherwise it will gather to the lee in the fashion expressed in the foregoing pages.
It is safe to say that snow will always behave in this manner when it hits an obstruction. One or two exceptions may be illustrated by these photographs (Figures 250 and 251) taken by the author during a snowstorm. (One can even see the falling snowflakes.) The snow in these cases clings to the windward sides of trees and posts because of its wetness. Even when on the ground, this type of precipitation will not drift very readily unless it dries out.
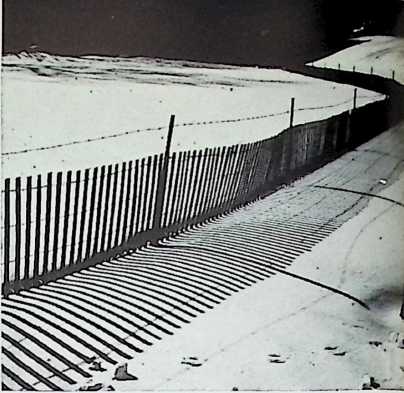
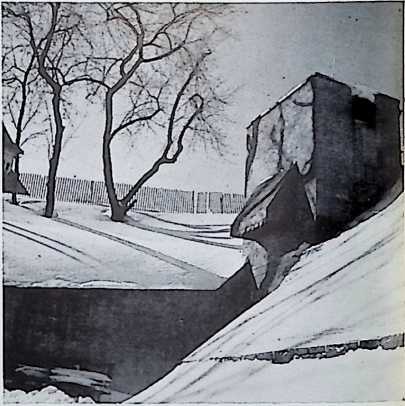
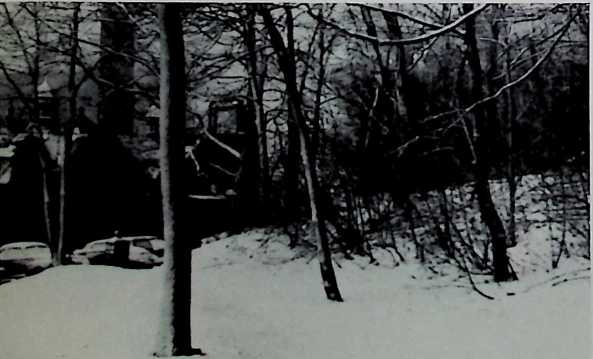
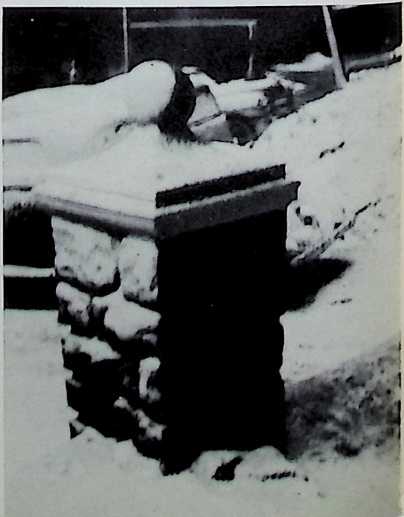 Let us look at the activities of the Highway Departments of several states to ascertain their methods in erecting snow-fences.
Figure 248. Snow fence, McGill University.
Figure 249. Carleton Road snow fence behind the Cyclotron, McGill University.
Figure 250 (left). Falling snow, clinging to windward side of trees.
Figure 251 (right). Falling snow, clinging to windward side of a post.
In Washington, according to Maintenance Engineer R. P. Newland, slat type snow fences that come in 50 and 100-foot rolls, 4 feet high, are used. However, due to changing conditions, principally the production of more efficient snow fighting equipment, his department has been able to cut down in snow fence erection. In fact, it is reported that they have not ordered any new snow fences for nearly ten years.
In Oregon, most of the Oregon State Highway system is not subject to drifting snow, but where the snowfall is considerable and strong winds prevail from one direction, snow fences of two types are used with reasonable success, reports State Highway Engineer R. H. Baldock. In the first type, for undeveloped areas, a fixed fence on wooden posts (or fence jacks, if on rock) is built. The horizontal members are 1" x 16" spaced 4" apart, while the vertical members, which comprise the height of the fence, are 6 feet. In farm areas a second type is used. It is a movable fence that is erected each fall after harvest and removed in the spring. Steel posts are used to support the fence of vertical slats x 1W x 4, woven with five double strands of #12 galvanized wire in a horizontal manner.
In either case, however, in Oregon, the fence is placed so that the drift down-wind will not reach the road. The actual distance depends on the slope of the terrain and the velocity of wind to be expected, but in general the fence is between 75 and 150 feet from the edge of the road. » Fences are definitely most effective when placed at right angles to the prevailing winds.
California’s State Highway Engineer G. T. McCoy reports these specifications for snow fences in that part of the country: lath type fence, each lath being minimum thickness, 4 long, 4" on centers, and woven with 5 double strands of #12 galvanized steel wire. If a single lift of the fencing is to be installed, “T” section metal fence posts 8 in length are driven at 10 centers, and are guyed by #9 galvanized steel wires. If two lifts of fencing are installed, 6" by 6" select structural douglasfir or dense select all-heart Redwood posts, 12 long, are placed on 12 centers. The lower 3 feet of these posts, which are embedded in the ground, are treated with a wood preservative. Figure 252 shows one of the double-lifts of fencing, placed about 96 from the edge of the highway pavement, as is the custom in California. Braces have not been in-
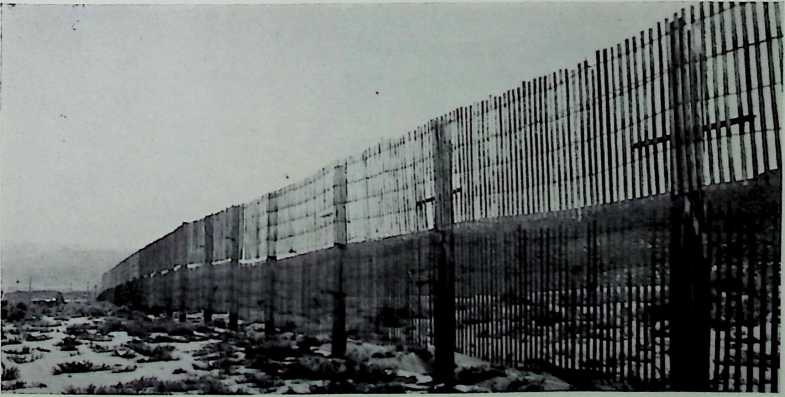
Figure 252. Double-lifts of fencing, placed about 96 feet from the edge of the highway, California.
stalled in this picture, but are seen in Figure 253 (where only one lift has so far been erected).
Martin B. Powers of the Montana Highway Commission reports that in his state the standard 4-foot wood slatted and wired snow fence is used exclusively, either in single or double-deck form, as in California. Here, however, the 12-foot treated wooden posts are set, not three, but four feet in the ground; also, the single-deck variety is placed at least 150 feet from the shoulder of the roadway, and the double-deck type 300 feet or more, depending on the prevailing winds, of course.
From North Dakota’s Highway Department, Chief Engineer M. P. Wynkoop advises that the usual wood slat type of fence is employed there, and placed from 125 to 200 feet from the centerline of the highway it protects. Usually it is parallel, but in some places it may be at an angle of 45°. As prevailing winds in North Dakota are from the northwest, fences are placed on the north side of east-west highways and on the west side of north-south highways.
Earl B. Lockridge, Maintenance Superintendent of the State Highway Commission of Indiana, notes that the bulk of snow fencing there is placed in the northwest portion of the state, where there occur the most frequent storms of maximum intensity. Two types of fencing are used: the steel snow fences and the wood picket type. Both types are set parallel to the road on the windward side at variable distances, depending on the geographical location and anticipated wind velocities. However, the average distance from the edge of the road for snow fence setting there is approximately 100 feet.
The steel fencing consists of steel posts and metal boards. The steel posts are driven five to seven degrees off the vertical, and away from the road. The 6-inch metal boards are placed horizontally with approximately a 6 to 8-inch gap between them. Usually about four boards are used. The wood-picket type of snow fence in Indiana consists of steel posts driven vertically, with 2-inch wood pickets interwoven in wire that is stretched horizontally between them.
The Indianans have found both type of snow fence to be worthy; but they remark that because only a small part of their state is subjected to consistent snows and placement of fencing is almost 100 percent on private property, the highway department has kept the practice of using snow fencing to a relatively minor scale.
N. A. Staples, Chief Maintenance Engineer for the Commonwealth of Pennsylvania Department of Highways, has informed us that although the fencing is positioned with regard to prevailing winds and the terrain, the average distance is 50 feet from the section of roadway it protects. It is parallel to it on the windward side and is installed along 2,600 miles of the 41,000 in Pennsylvania’s State Highway System during the winter months. A photograph of a fence on Route 304, Erie County, Pennsylvania, is shown in Figure 254.
B. A. Lefeve, Director of the New York State Bureau of Highway Planning, has indicated that his office advocates the use of picket snow
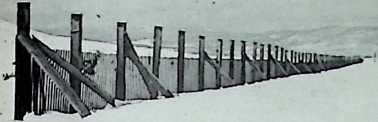
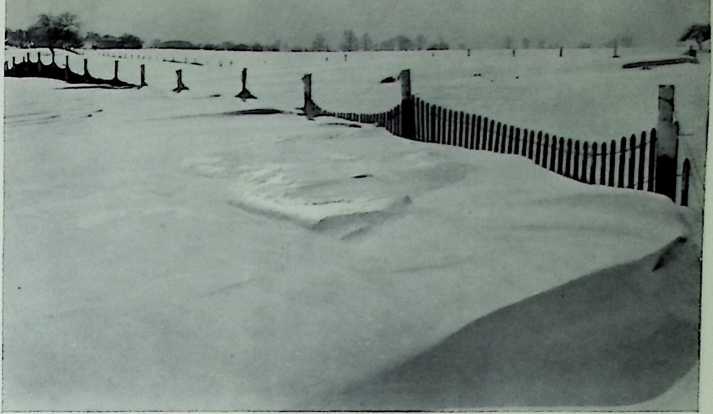
Figure 253 (above). Braced snow fence, California. Figure 254 (above right). Snow fence, Erie County, Pennsylvania.
fences made from No. 1 lath and supported by temporary7 posts. These are placed approximately 100 feet from the highways at right angles to the prevailing winds.
According to Technical Information Engineer C. E. Lamarche of the Department of Roads, Province of Quebec, his government agency recommends installation of snow-fences in parallel lines 75 to 90 feet from a highway if the wind is normally perpendicular to it. J. A. Racicot, District Engineer of the same department, said in The Canadian Engineer: “The prevention of snow drifts is partly obtained by cutting weeds and brushes, before snow sets in, along the roads to be maintained in winter; also by placing snow fences along these roads at distances varying from 100 to 125 feet from the center line. A study of the topography of the surrounding country and of the prevailing winds will enable one to place these snow fences at the proper locations, but experience gained after a few years’ observation of the results obtained will either justify this localization or point out more effective placement for these snow fences. The type of snow fencing used in this province consists of 4-foot wood slats held in a steel wire weaving, supported by steel posts, T bar section, placed at intervals of from 10 to 12 feet in length.”
Where heavy drifting is liable to occur it has been proposed that one establish, when in open country7, a windbreak to serve as a “snowcatch.” What has been termed as a “snow-trap” will thus be formed between this windbreak and the main line of shelterbelts. In the words of Parker Anderson: “A snow catch consists of two rows of low trees or tall shrubs whose purpose it is to catch or retard the snow, causing it to pile up between it and the main shelter belt. Without a snow catch and snow trap, snow will pile up . … break limbs of taller trees, and break down or smother young growing trees. …
“Rows 1 and 2 of the snow catch should be planted of low shrublike trees such as common lilac, Caragana, buffalo berry, Russian olive, diamond -willow, golden willow, or other low-growing native hardy willows. Wild fruit trees may7 also be used successfully, Tartarian honeysuckle and common lilac are especially hardy7 and desirable, as they grow dense from the ground up. If tall willows are used, they should be trimmed back to a lower height, a foot or so above the ground every two years, so that they will continue to grow as dense as possible. The trees in the snow catch should be planted from 4 to 6 feet apart in the rows, and the rows should be 10 feet apart. They may even be spaced farther apart.” These plants are indicated for Minnesota conditions, but many are appropriate for use elsewhere. It should be recalled, however, that one should always check the habits of plants in the locality concerned before planting, as there are many factors besides climate which may impede satisfactory growth.
The Alberta Department of Agriculture has confirmed the necessity for snow-catches in most cases in that region of the country: “On the wind-swept prairie there is danger of snow drifting so deeply into the shelterbelt as to break down the trees before they become sturdy. In such locations it is best to provide a snow trap at a hundred feet beyond the main shelterbelt.”
Regarding the effect of a hedge or tree belt on snow accumulation John Walker of the Dominion of Canada Department of Agriculture has indicated: “For a belt seven to ten feet high this influence may extend as far as seventy-five feet to leeward. Snow accumulation is accompanied by increased soil moisture in the area covered by the snow, and in a greater area on slightly sloping land.”
An observer might at first glance feel that a deciduous forest offers more protection from the rain than a coniferous one. This impression would be derived from the fact that deciduous leaves form quite a complete canopy over the forest floor. Geiger has accurately concluded, however, that this is not the case where fight rainfalls are concerned. Comparing beech and spruce, he found that while the drops remain hanging on the separate spruce needles, they flow together on the beech leaves and proceed via twigs, then branches, to the trunk and ground. “Consequently,” he says, “the proportion of the rain dropping through the crown amounts to more than 50%, even with the weakest rainfall and the quantity running down the trunk amounts to a fifth of the total.” Hursh and Connaughton provide the following intelligence in the Journal of Forestry: “Batteries of trough rain gauges erected beneath tree crowns, and collar-like catchments placed around the boles, gave evidence that, for the 40-inch rainfall belt of the Southern Appalachians, 12 to 18 per cent of the total annual precipitation was intercepted by the forest type studied. This amount includes one to three per cent of the total precipitation which later reached the ground by flowing down the tree boles.”
The effect of a forest on the passage of snow to the ground is not as remarkable as the case with rain. The reason, according to Geiger: “snow which accumulates on the crown branches breaks away by its weight and falls to the ground. Moreover, low temperatures prevent any great loss through evaporation directly after a snowfall, such as occur after a summer rain.”
Zon of the United States Forest Service confirms Geiger’s results in Climate and Man: “Numerous observations in this country and abroad
show that the crowns of the trees may intercept as much as 15 to 30 per cent of the total precipitation, depending upon the age of the forest and its composition. Only a small part of the precipitation reaches the ground directly through the openings between the leaves and the branches. Another part wets the surface of the leaves and branches and is evaporated back into the air, and still another may run down the trunks to the bases of the trees and into the ground. Coniferous forests, such as spruce and pine, permit a relatively small amount of precipitation to reach the ground, while hardwoods, such as oak and maple intercept comparatively little, especially when the leaves are off. The amount intercepted is equivalent to a considerable reduction in the total precipitation over the area occupied by forest.”
So it would appear that less rain reaches the ground of a conifer- composed forest than a deciduous one. Whether it is wise to construct buildings in either one will have to be determined by the architect in each particular case. One particular case, for example, where it would be definitely advantageous to site buildings within or adjoining forests is in regions that experience frequent or serious hail storms, for Zon remarks: “Repeatedly and in different countries it has been observed that forests prevent hail from falling over adjoining fields. Coniferous forests have the greatest effect in deflecting hailstorms. Statistics collected for 20 years to 1897by a company insuring against hail, confirm the fact that forestless regions are subject to frequent hailstorms while in forested regions hailstorms are of very rare occurrence.”
The relative merits of siting within forest clearings, as far as the precipitation is concerned, are evident in this statement by Hursh and Connaughton: “Of particular significance is the fact that while small openings in the forest were effective as snow-accumulating areas, they did not appreciably increase snow melt. Research on snow conditions at several western forest experiment stations has demonstrated conclusively that a forest cover both intercepts snowfall and retards snow melting.”
Forsling in Climate and Man confirms this. He says: “Forests have an important influence on the rate of snowmelt because of their obstruction of wind movement. Wind velocity may be reduced more than 90 percent by a dense coniferous forest… . . Even very open coniferous stands and hardwood forests reduce the velocity to some degree. The rate of snow melt is thus reduced in forests during the critical periods of warm, moist winds.” Forsling also ably sums up the effect of forests on snow: “Under dense coniferous forests snow accumulation is least, soil freezing is moderate, and snow melt is slowest; under hardwoods and open coniferous forests snow is deepest, soil freezing is prevented or reduced to a minimum, and the rate of snowmelt is moderate; in cleared areas snow depths are intermediate, soil freezing is at its maximum, and snow melt is rapid. On a watershed having different types of cover, the varying rates of melting favor lower flood peaks than would occur if one type of cover prevailed.”
Some authorities have claimed that forests induce precipitation by virtue of their nature. Evaporation from them and the rising thermal current that occurs above their tops are said to be responsible. Say Hursh and Connaughton, regarding observations in Tennessee: “In the winter of 1936, precipitation was 17.5 per cent greater in the forest than in the denuded zones, and in the preceding winter, 25 per cent greater. In both summers it was over 28 per cent greater. This record, although of extreme interest, is so short that until further study and analysis have been made caution must be used in classifying Tain production’ as an attribute of the forest cover.”
But Zon contends: “Whether the forest actually increases the amount of precipitation is, after 80 years of observations, still a moot question. Though parallel observations carried on in the interior of the forest, on the edge of the forest, and in the open show that the amount of rainfall, as registered by rain gages, is greater inside the forest than on the edge, and on the edge than at some distance from the forestsometimes by as much as 25 per centthey do not furnish convincing proof that more rain actually falls over the forest. All that these records indicate is that the rain gages inside the forest, being protected from the wind, may register more water than the rain gages in the open, where they are exposed to the wind. The most that can be said is that the forest may have some effect upon the frequency of precipitation.”
As conditions of soil, topography and vegetation are so closely linked and as each category is so variable, it is impossible to draw any general conclusions on this subject. However, some general observations may be offered in the hope that the architect will be able to select appropriate building sites with regard to moisture. In doing so, one does not make mention of the different load-bearing capacities of the various soils; for engineering data of this sort it is necessary to seek other references.
The advantages and disadvantages (or, at least some of them) of moisture and precipitation around a building are listed earlier in this chapter. The architect should determine from that source whether he desires to accumulate or do away with moisture in the environs of the building. Then he should consider the soils of the site.
Soils are capable of absorbing quite a large amount of water. Under favorable conditions one or two inches of water per hour may infiltrate the ground. Musgrave in a Climate and Man paper has outlined soil characteristics in a manner particularly convenient for those practicing architecture: “The amount and rate of infiltration are primarily dependent on (1) the sizes of pores, or openings, in the soil, (2) their permanency during a storm, and (3) the total volume of space unoccupied by water or infiltrated soil particles. The size of the pores is largely dependent on the size of the particles comprising the soil profile and their structure or arrangement. Other things being equal, a sandy loam soil will have a higher rate of infiltration than a silt loam because of the larger size of particles and pores. However, the silt loam under favorable management and good land use may have its particles arranged in groups, or aggregated, so that each aggregate, or group, behaves with respect to water movement like a large individual particle. High rates of infiltra-
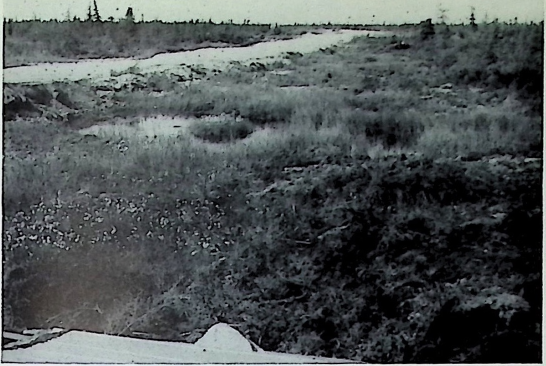 tion are then likely to occur; in many cases higher rates are found in silt loams under such conditions than in sandy loams. . . .
Figure 255. Muskeg landscape with scrub limber south of Churchill, Manitoba.
“A soil in which conditions initially favor high infiltration may, during the course of a storm, lose its favorable structure because of (1) “melting” or slacking of its aggregates, (2) the partial clogging of openings by fine particles deposited by downward-moving water or (3) partial or complete filling of its pores by water.
“Usually soils that have not been intensively cultivated tend not only to have higher infiltration rates at the beginning of a storm period but also to maintain higher rates throughout the storm than do soils whose organic matter has been exhausted and whose structure has been modified by intensive tillage. Lowdermilk showed in 1930 that turbid or muddy water applied to soil caused the rate of infiltration to drop to low levels. Run-ofi water from grassland or well-forested areas commonly is comparatively clear, while that from intensively cultivated areas is ordinarily highly turbid. In the grassland or forested areas the favorable aggregated structure of the soil is more stable and less apt to disintegrate during the course of a storm.
“In wet soils the infiltration of water ordinarily is less than in dry ones, although this is not invariably true. Soils high in clay and colloids swell when wet, and the pores become smaller, so that when such a soil as the Houston black clay, for example, is thoroughly moist, infiltration is practically zero, although it may be very high in the same soil when dry. Soils with impermeable subsoils of course have their infiltration rates reduced as the space above becomes filled with water. On the other hand, soils with little clay may have at least as high an infiltration rate when wet as when dry, if not a higher one. This is particularly true when subdrainage is good or the soil is permeable to a considerable depth. For soils in general, therefore, infiltration has not been found to be proportional to increases or reductions in soil moisture.”
Figure 255 illustrates vividly a poorly-drained soil. Here is a typical muskeg landscape with scrub timber south of Churchill, Manitoba, on the west coast of Hudson Bay. The Indians call this “The Country of the Little Sticks.” Water stands everywhere, and the only way to build a solid foundation is by providing a bed of gravel with a floating foundation on top. (Note typical arctic cotton grass in the left foreground.)
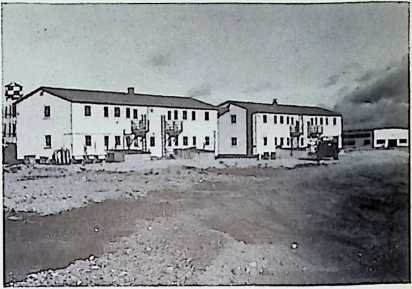 George Jacobsen and the Tower Company, Limited, of which he is president, is noted for his ability to tackle such problems in the far north. Figure 256, taken by him, as was the previous illustration, shows two large buildings constructed by him at Fort Churchill. They are Canadian Department of Transport living quarters (two four-apartment emits). One can see here the floating gravel bed foundation. These very heavy apartments rest on a steel grid on which the buildings float.
Figure 256. Canadian Department of Transport apartment houses, Fort Churchill, Manitoba. Tower Company, Limited, builders.
Incidentally, according to Hare, one can often determine the nature of the soil by examining the trees that are growing on the site in question. Eighty percent of the time, he says, we will find certain trees on soils of the general moisture contents as indicated in Table 53.
Moist sites poorly drained Moist sites well drained Dry sites
Red maple Sugar maple Ironwood
Arbor vitae Elms Beech
Silver maple Ashs White pine
Willow Bur oak Red pine
Balsam poplar Basswood Red oak
Black spruce
TABLE 53
It became evident in Chapter 3 that vegetation is a powerful source for removing water from the soil. Hare remarks that Thornthwaite in New Jersey has devised a system for disposing, per day, ten million gallons of waterthe end product of canning vegetablesby supplying an entire oak-hickory forest with eight inches of water. The forest relinquishes the water in the process of transpiration.
It would therefore seem advisable for architects to consider the justification of siting in the vicinity of trees in regions that tend to become flooded, especially in the warmer half of the year.1 The disadvantages might be that the building would be quite damp because of the evaporation of moisture in the proximity; that the cellar might be hard to keep waterproof or damproof (good construction must be entertained) because the water -will be drawn to the region of the structure by the suction and roots of the vegetation; and that the wind velocity, as has been seen already, would be reduced in a forest or woods, thus minimizing the evaporation of moisture by this means.
An advantage, however, is that trees and other vegetation could remove water from the immediate area of a generally-moist soil before it could build up pressure against a cellar wall.
¶ protection
Siting and other miscellaneous factors which influence the design of the massing and details of a building have been reviewed in previous sections. Yet several questions remain unanswered.

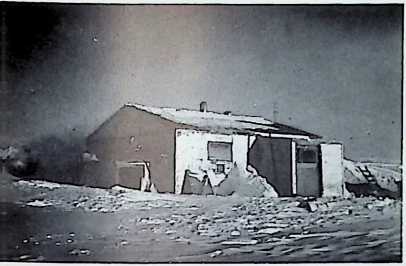 Orientation with regard to precipitation should be based on the slope of the land, the prevailing wind, and the sun. The building should not be placed on a slope that carries an excess run-off of water unless appropriate retaining walls and other devices are provided for in the design. Interpretation of this should be done with care, however, in such localities as the Province of Quebec, where the ancient law provides: “Lands on a lower level are subject towards those on a higher level to receive such waters as flow from the latter naturally and without the agency of man. The proprietor of the lower land cannot raise any dam to prevent this flow. The proprietor of the higher land can do nothing to aggravate the servitude of the lower land.”
Figure 257. Ionospheric station, Baker Lake, N. IV. T. An example of poor orientation.
Figure 258. Generator building, Baker Lake, N. IV. T. An example of good orientation.
The other two factors, those of the wind and the sun, are included because they are agencies for evaporation. Either one or both of them should have some influence over the surroundings of a building at some time during the day. Particularly important is the necessity for evaporating moisture in the morning during the winter, although in the summer it may be desirable to keep it there as long as possible perhaps until the afternoon, when it is most wantedbecause of its potential cooling powers.
The effect of fences and other obstacles on snow formations have already been investigated. It is indeed important to have them in areas that require their use, but it is just as necessary to orient buildings properly, with regard to the snow, in regions that experience heavy drifts. Figure 257 shows an ionospheric station at Baker Lake, N.W.T., which was not oriented in the correct manner, as evidenced by the tremendous drifts. They always occur on the lee side of buildings, so it is imperative to position the structure in a way that the lee side is not used as a means of access or as a source of light. Also, it is wise to have the long axis of the building parallel to the prevailing wind.
A good example of proper orientation is the generator building at Baker Lake (Figure 258). One can see a clear front entrance in deepest winter and the big snowdrift on the lee of the building in a position where it does not do any harm. It also shows the lack of cornice overhang, the windows which are used only for the admission of light, and the special ventilators. The temperature when George Jacobsen took these two pictures was, incidentally, forty-one degrees below zero (° F.). Of course, the thermometer is liable to go lower stilleven lower than the ° F. that the author has himself experienced in this region. Certainly, no one wishes to dig a path through a snow drift in weather like this (or at any other time).
History has shown that man has devised his roofs with particular regard to precipitation. This is true even today, by practices already mentioned as well as the following interesting one noted by Hare. The town of Akita on northwest Honshu Island, Japan, experiences an average of 200 inches of snow in the month of December and more than 500 inches per annum. The streets are quite narrow for the most part and are flanked by steep-gabled roofs on the houses. These roofs, however, are
 so constructed that there is an overhang of one or two feet; the snow thus falls off into the center of the street, leaving a clear passage along the walls of the buildings. The story is told of American airmen after the war who were stationed near this town and were perplexed by the problem of crossing the road. The terrific pile of snow offered itself as an annoying obstruction. Nevertheless, this was soon solved by the natives, who, for a slight fee, shovelled a path from one side to the other. Not inviting a bad turn in their business, though, the Japanese, after the flyers had passed through, promptly filled in the walk and waited for the next helpless aviator!
Figure 259. Japanese children in a cave of snow.
Such snow, and such children, are seen in Figure 259. Here, in northern Japan, on New Year’s Day, they are celebrating the children’s festival of “Kamakura,” in a cave of snow.
There is not enough snow to offer citizens of most North Ameri
can towns business opportunities like those the Japanese enjoyed. However, Americans have found that it is good business and a sound architectural practice to provide overhangs along their store fronts. It is not a universal custom in cities, unfortunately, although it might be an item to consider in future designs, if one remarks the sudden crowding of Morgan’s Department store, in Montreal with its covered walk, whenever a downpour hits the area. It also offers a pleasant shadow on a hot summer day, as any woman shopper can testify.
Figure 260 shows this store viewed from the southwest on Ste. Catherine Street West, Montreal. The four-storey building in the foreground was built in 1889 from the design of John Pierce Hill, Montreal architect. In 1903, the sidewalk canopy was added to the structure from plans by Montreal architect Robert Findlay. The eight-storey building, with its canopy, was built in 1923; the architects were, in this case, Messrs. Barrot and Blackader of Montreal.
Figure 261 indicates a sidewalk view of the canopy on the western side of the building. The advantages can be realized immediately in almost any type of weather.
Arcaded walks, of course, had been used in previous centuries, not only in warm climates, as in countries bordering the Mediterranean, but also in northern Europe and in England.

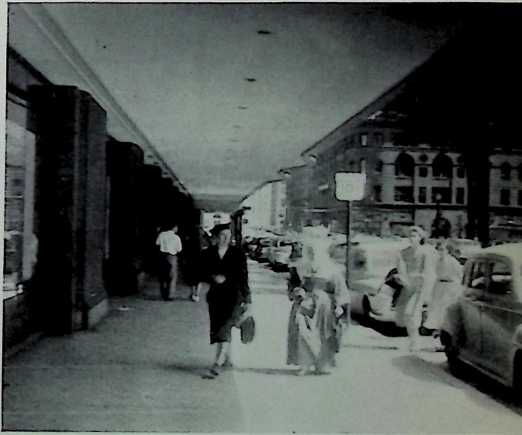 The covered wagon days in the United States popularized the idea of porch-front store fronts, and it is still a practice in some of the smaller towns of the west. The trend of “modernism” evidently did away with this idea elsewhere, but some of the more climate-minded architects, real-estate investors, and clients have retained it as one of the necessities in store designs. Notable, perhaps, is the design for Purchase Street, as redeveloped, in Rye, New York, conceived by architects Ketchum, Gina and Sharp, and shown in Figure 262. Here is an eyelevel view showing that not only are the covered walks functional but
Figure 260. Southwest view of Morgans department store, Montreal, showing covered walk.
Figure 261 (above). Sidewalk view of the. canopy on the western side of Morgan’s department store, Montreal.
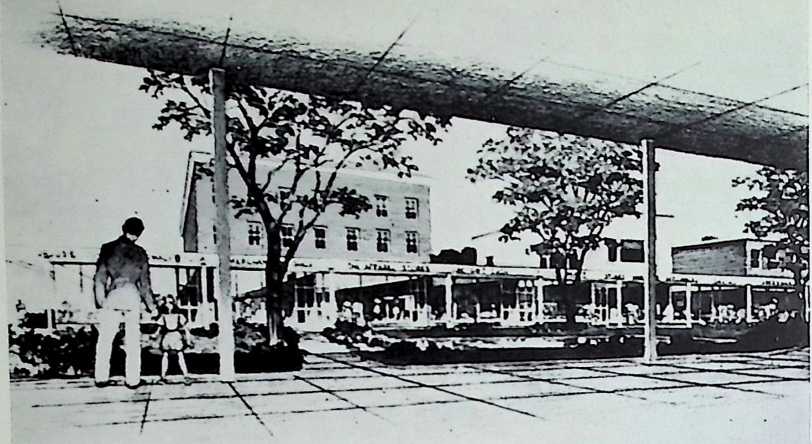
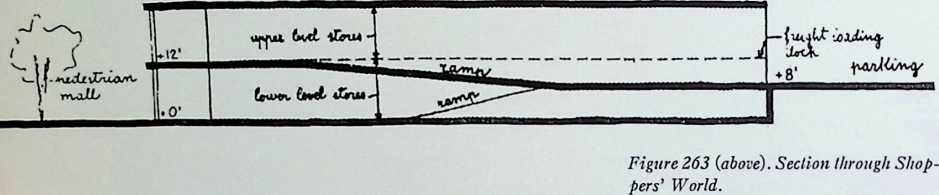 that they serve to tie together what has been heretofore a series of hodgepodge buildings.
Figure 262. Purchase Street, Rye, New York. Ketchum, Gina and Sharp, architects.
Ketchum, Gina and Sharp, and their associates listed with the accompanying pictures, may be commended particularly for their recent achievement in Shoppers’ World, 19 miles outside of Boston, in Framingham, Massachusetts. Here is a suburban shopping center, comprising no less than 44 stores, besides other facilities, including parking spaces for 6000. (See aerial view, Figure 264). Shops front along two tiers of covered walks, which may eventually be enclosed in glass to reduce heat losses from the stores. The parking fields are at an intermediate level and are connected to the promenades by ramps (see section, Figure 263). Thus, perambulator-pushing paters and maters will have a fairly easy time negotiating the rise.
Overhangs are of prime necessity when one desires to employ movable sash in windows because, when it rains and one is in an overhangless dwelling one is sometimes faced with the proposition of either keeping the windows closed and smothering in stifling heat or opening them and letting in the rain.
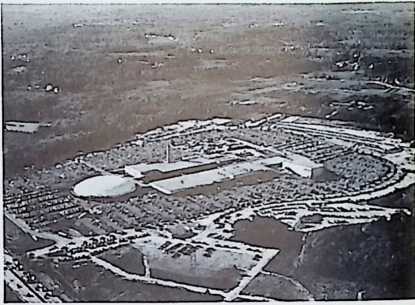
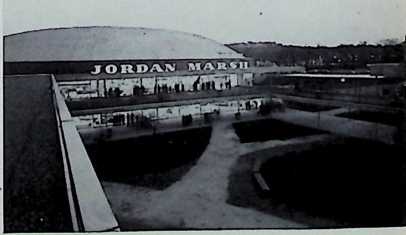 The angle of falling rain is partly determined by the existing wind, which is quite variable. Therefore, one cannot estimate the required width of the overhang with any degree of accuracy. However, if the overhang has been designed properly in accordance with the suggestions in Chapter 2, it should be sufficient to exclude any precipitation (except that accompanying severe storms) from the walls. Recommenda-
Figure 264. Aerial view of Shoppers’ World, Framingham, Massachusetts. Ketchum, Gina and Sharp, architects.
Figure 265. Close-up of one store in Shoppers World.
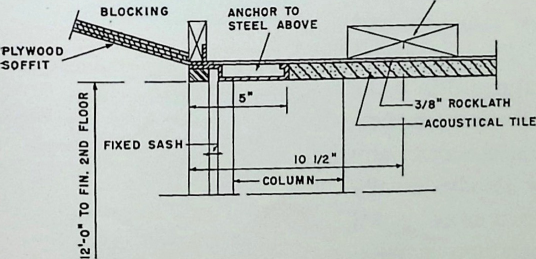
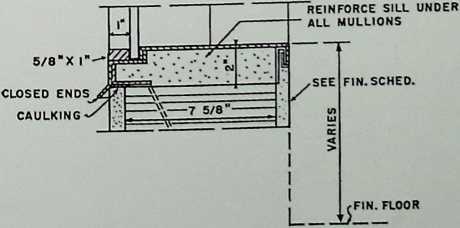

igiire 266 {below). Window detail debited by Lester D. C. Tichy.
2"X6” GROUND CONTINUOUS AROUND ALL WALLS OF RESTAURANT
Figure267 {below). St. Ann’s Church and School, Mission, Kansas. Kicett and Myers, architects.
tions outlined in the paragraphs on “roofs” should be followed when designing any type of overhang.
Lester D. C. Tichy, in a design for the Kiptopeke Beach, Virginia, terminal of the Virginia Ferry Corporation (15 miles from Cape Charles), placed the main building at the extreme end of a long pier. Thus, water was on three sides, and on windy and rainy days a spray is swept almost horizontally to these walls. To prevent such water from penetrating windows, Tichy devised an ingenious but clean-cut window detail, shown in Figures 265 and 266.
George Jacobsen has noted that there should be no overhangs on Arctic buildings. Firstly, overhangs would be subjected to uplift winds; secondly (and more important), overhangs are not conducive to good joints at the walls, thus enabling moisture to penetrate at such points. In the generator building he built at Baker Lake, N.W.T., (see Figure 258), the lack of cornice overhang is evident, for this very reason.
Because of the severity of winters in cities like Buffalo, Detroit, Minneapolis, and many in Canada, it is to be recommended that all exterior doorways have canopy protection or be otherwise sheltered. This may be extended into an entrance vestibule cut off from the actual interior of a building. Here, for example, the floor could be treated to resist water, mud, or snow that may be tramped in, and shelves could be provided for the storage of overshoes (compare -with igloo porch, Figure 3).
Overhangs are necessary in areas subject to precipitation and where people are liable to congregate. The pastor of St. Ann’s Church and School (Figure 267) of Mission, Kansas, can certainly thank Kansas City architects Kivett and Myers for the nice deep overhang that enables him to shake hands with his congregation under cover, no matter what the weather.
It may be desirable in many districts to preserve as much snow as possible on the surface of the roof. It is an excellent insulating blanket. Says Brooks about snow on the earth: “Loose snow is a good insulator, and a thick cover of snow prevents the temperature of the ground beneath from falling much below 32° F. The conductivity of new snow is three to four times that of air, roughly half that of ordinary compacted soil, and equal to or slightly greater than that of loose soil or loose sand. Thus the insulating effect of a layer of loose, new snow 1 foot deep is roughly equivalent to that of 2 feet of dry sub-soil and to a much greater thickness of rock. As the snow becomes compacted, however, its thermal conductivity increases, and for old snow it is three or four times that of new snow.” Geiger confirms the above by these remarks: “Deep within the snow, its temperature is only slightly below freezing, even when the air temperature may be as low as °. This illustrates how great protection is afforded seeds by a winter snow cover. Heat waves penetrate the snow considerably faster than do cold waves, for while the latter are transmitted only by true heat conduction, the former have the benefit of pseudo-conduction through infiltrating water from melting.” And Brunt reports in the Quarterly Journal of the Royal Meteorological Society: “…the temperature of the surface of the ground under snow will remain steady at a relatively high value. Thus Franklin (1919) quotes data showing air temperature over a layer of snow 3 inches deep varying from ° C. to ° C., a range of nearly 19° C., while the surface temperature of the ground under the snow remained steady at 0° C.”
Kimble and Bush say: “Air is an excellent insulator against heat and cold. Everybody knows that it is the air held in the meshes of woolen blankets that keeps the warmth in and the cold out. Now newly fallen snow seldom contains less than 10 parts of air to one part of ice; sometimes it contains as many as 35 parts to one. Even an old snow cover is rarely less than half air. It is because of this that snow is so good at keeping the warmth of the soil in and the cold surface air out. The snow surface, in losing much of its small store of heat by radiation and evaporation, becomes extremely cold on clear nights. Even on sunny days the presence of snow results in lower air temperatures than if the ground were bare, for the snow surface can never rise above a temperature of 32° F. which means that the snow cannot warm the air to any extent. Meantime the soil temperature remains fairly steady, usually some little way below freezing point. The extent to which a snow blanket can keep the heat in is seen in the following temperatures simultaneously recorded during a very cold snap in the Midwest:
Temperature 3 ft. above the snow surface = °F. Temperature of snow surface = °F.
Tempera true of snow 7 in. below surface = +24°F., i.e., a difference of 51° between top and bottom of the blanket, a difference incidentally, greater than that between the average summer and winter temperatures of places like Chicago and New York.
“Eskimos and coureurs des bois make use of this blanket effect
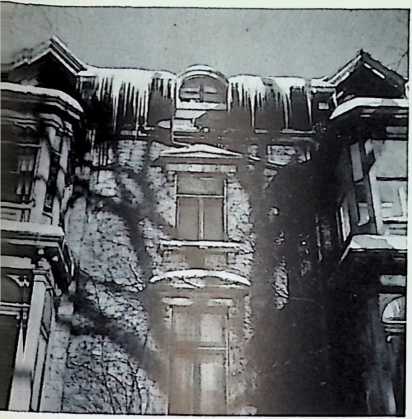
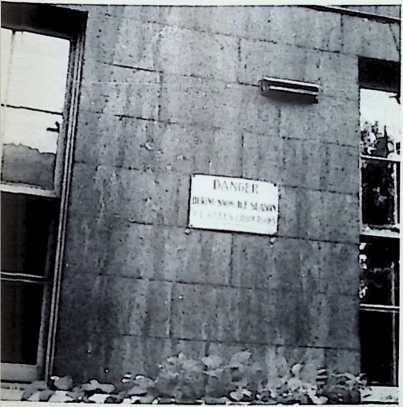 when they build igloos, or snow cabins. Once the igloo is built, quite a small fire inside keeps the temperature upno matter how cold it may become outside.
Figure 268. Montreal house. An example of poor roof insulation.
Figure 269. Sign on McGill University building reads: “Danger: during snow & ice season ice falls from roofs.”
“In the St. Lawrence-Great Lakes region the deep and prolonged snow cover saves the soil from being frozen to great depths. Early in December, severe frosts may freeze the soil down to 30 inches or more, since in most years not much snow has fallen at that time. By the end of the month, however, 12 to 15 inches of snow have usually accumulated over the open country, and the ‘blanket’ has been ‘spread.’ The freezing of the soil then ceases and the bottom of the frozen layer remains about 30 inches or so below the ground surface for the rest of the winter, despite the severe cold of January and February.”
Mr. Svenn Orvig of Bergen, Norway, in a Master of Science thesis at McGill University, entitled “The Climate of the Ablation Period on the Barnes Icecap in 1950,” has discussed in great detail the temperature profiles through snow and ice. Parts of this thesis are also contained in the Geografiska Annaler, Vol. XXXIII, Heft 3-4, 1951 (see bibliography). These papers are recommended reading for anyone interested in this subject.
Talbot Hamlin in Architecture, An Art for All Men writes that “a steep roof. … would allow snow to slide down in masses in freezing and thawing weather, and would be a definite danger. Hence roofs in countries of heavy snowfall are usually of medium pitch, well under forty-five degreessteep enough so that water will flow off readily as the snow melts, but flat enough so that the greater part of the snow will remain on the roof throughout the winter. Roofs of this gentler slope are the rule in Alpine countries, in Chinese hill towns, in Norway and Sweden. It is significant that the settlers of New England at first built the steep roofs they were accustomed to in England; later, as they learned the severity of the winters, they gradually flattened the slope until the roofs of the typical New England farmhouse of the early nineteenth country have a pitch that varies from about thirty-five to forty degrees.”
Roofs must be insulated from the inside by sound architectural methods; otherwise, the heat would melt the lower few millimeters of snow, which would run down any slope, destroy its insulating qualities, and assist in the formation of icicles at the eaves.
An example of poor roof insulation is seen in Figure 268 of a Montreal dwelling.
The attention of architects in Montreal is called to the following provisions about precipitation in the Montreal Building By-Law: “Every Building with a roof sloping towards the street, shall be set back from such street a distance at least equal to one third the height from the ground to the lower portion of the eaves, and such roof shall be fitted on the street side with a snow-shield. . . Rain water from the roof shall not be drained onto the street… .” Hence, the hanging icicles seen in Figure 268 would cause a summons to be issued to the owner if they fell (and a policeman was looking). Similarly, we may remark the signs warning of snowslides from the roofs of many McGill buildings, as illustrated in Figure 269.
The weight of snow demands attention in the calculation of supporting members of the roof, as any architect or civil engineer knows. The Montreal building code (and codes in other cities are not too different basically) provides for the following: “Roofs with an inclination of less than 20 degrees with the horizontal; load per square foot of horizontal projection:
unheated buildings 50 pounds per sq. ft.
heated buildings 40 pounds per sq. ft.
Roofs without parapets inclined to more than 20 degrees with the horizontal: load per square foot of horizontal projections:
unheated buildings 40 pounds per sq. ft.
heated buildings 30 pounds per sq. ft.
(Live load may be reduced by one half pound for every degree of inclination greater than 20.) In places where piles of snow might form, the live load shall be increased according to the probable size of the accumulation.” What this “probable size” may be, how it shall be determined, and what load to consider per square foot is not suggested by the building department. Here, however, is a statement of the weight of snow, as given by Brooks: “The weight of freshly fallen snow varies according to its ‘fluffiness’; an average figure is about lbs. per cubic foot. As the snow becomes compacted its weight per cubic foot increases and in old snow may be as much as 30 lbs. In the coastal ranges of western North America the weight of snow on level surfaces may be as much as 250 lbs. per square foot, roughly a ton per square yard. In these regions houses are always built with steep roofs, which allow the snow to slide off; a slope of 60° does not carry snow. In the north-eastern United States and eastern Canada the snow cover on flat roofs may reach a weight of 50 lbs. per square foot; in New York it is customary to allow for 40 lbs. In Britain and western Europe the maximum depth of undrifted snow on level ground rarely exceeds 2 feet, equivalent to about 13 lbs. per square foot. As, however, owing to drifting the depth of snow may be locally greater it would seem to be desirable to allow for a snowload of at least 20 lbs. per square foot on large flat roofs. Where the local topography causes the snow to pile up in drifts the thickness may be much greater, and hill country is especially Fable to deep drifts. Two or three feet of snow may seem a trivial addition to the weight of a roof, but it has sufficed to cause the collapse of large buildings. A notable example was the Knickerbocker theatre disaster in Washington in 1922.”
The National Building Code of Canada (1942) requires snow loads on roofs to be calculated this way: “Roofs having a slope of 20 degrees or less shall be capable of supporting a vertical live load of from 20 to 40 pounds per square foot of roof surface, the value to be assumed depending upon the probable snowfall and rainfall in the locality in which the building is to be erected.
“(As a guide to the selection of the live load to be assumed the following formula shall be used:
L = 5 + *R
*where S is the sum of the average snowfalls in January, February and
March, in inches, over a number of years;
R is the sum of the average rainfalls in January’, February and March, over a number of years; and
L is related to Eve load by the following table:
L Live Load
less than 20 20 pounds per square foot
20-30 30 pounds per square foot
more than 30 40 pounds per square foot.)
“For roofs having a slope of more than 20 degrees and no parapets the loading may be reduced to that given by the following formula:
L, = L[1 - 0.0233(a - 20)]
where Li is the snow load for a sloping roof;
L the snow load for a flat roof; and a the slope of the roof in degrees.
“In portions of roofs where an unusual depth of snow may accumulate, adequate provision shall be made to support the snow load likely to occur.”
Robert F. Legget, Chairman of the Associate Committee on the National Building Code and Director of the Division of Building Research of the National Research Council of Canada, is now in the process of revising the document entirely. The author, who has been asked to submit comments to the committee, has seen advance drafts of the new code and is happy to commend it. It is especially interesting in that here, in one book, are building regulations covering an area of 3,690,410 square miles over many climatic regions.
Walls may be seriously damaged by precipitation. Driving rain may penetrate any crevice in joints and freezing may expand this moisture so that deterioration sets in rapidly. Inadequate juncture of the roof and wall surfaces may have a similar effect. Drip moulds and other details at openings should be made in order to avoid wind-driven rain penetration, as we have noted already.
Apart from this, there is the appearance factor. Projections on the exterior walls of city buildings tend to collect much of the atmospheric dirt that is prevalent in the town. On light-surfaced buildings precipitation subsequently collecting on the ledges will run down the wall, carrying the dirt particles with them, leaving unsightly streaks. This was already beginning to occur on the facade of the new McGill Physical Sciences Building when it was only nine months old. On older stone- veneered structures that have undergone “aging,” the precipitation has the opposite effect: precipitation that originally collected on projections will wash away dirt in its path as it flows along the wall to the ground. This can be seen on either side of the Physical Sciences Buildingon the Architecture and on the Pulp and Paper buildings. (Figure 27o).
The lesson to learn from this is to avoid projections of any sort on the exterior walls of buildings. This is also in conformance with suggestions outlined in the study of wind effects along walls and thus does not serve just a singular purpose.
Where canopies meet walls, streaking of another sort may occur. The photograph of a University Street house in Montreal (Figure 271) will serve as an example. In this case the rain bounced on the porch roof and thence back onto the wall, washing it of any dirt and leaving this peculiar curve-shaped line of demarcation between the clean and unclean areas. If the pitch of the roof had been toward the street (which would have necessitated a gutter) splashing would not have occurred in the manner thus outlined.
Windows should not be placed too near the ground because of splattering by rain, and in certain areas because of the possible drifting of snow. A photograph of a window in the front-entrance wall of the Registrar’s Office, McGill University, shows the danger inherent in placing windows too near the ground. Opening this would render the inside quite uncomfortable for the occupants.
And what about McGill’s Cyclotron built up against a hill? It is a wonderful place for the collection of snow. Opening these windows might make the scientists think that a new atom had been exploded.
The same thing is true of doorsills, which should always be elevated sufficiently to prevent snow or flash floods from entering a building.
Details on walls should prevent the formation of icicles. As has been seen, if icicles are in such positions, there is often a violation of a city by-law besides the fact that it is hazardous.
An advertising booklet of the A. M. Byers wrought iron company commences its sales talk with the following: “On December 26, 1947, a sidewalk became front page news all over the country. The sidewalk was on Fifth Avenue, New York, in front of the store of Best and Company. It became news by remaining clear when almost every other spot in the city was buried under 26 inches of snow after one of the worst snowfalls in New York’s history.” A photograph of the Best and Company sidewalk on that day is seen in Figure 275. A similar absence of snow is seen in the photograph of the sidewalk in front of a building in Pittsburgh (see Figure 276).
Installation of such underground piping for snow-melting has a variety of uses in sidewalks, roads, driveways, airports, and loading areas. It should not be overlooked in highway depressions under railway trestles, especially where there is a pier in the center of the street; winter skidding often causes serious accidents at such points. It is an imperative installation at entrances to hospitals. One realizes the necessity in winter when viewing ambulances tragically attempting to mount the upper part of University Street adjacent to the Royal Victoria Hospital, Montreal.
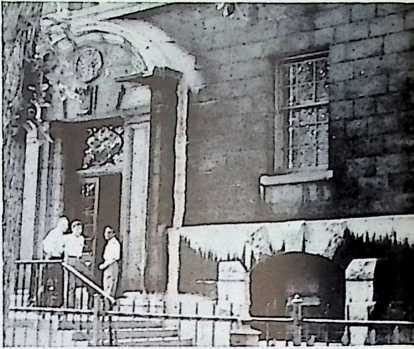
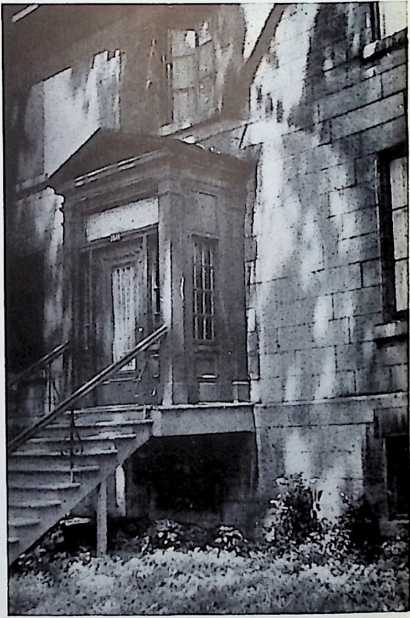 To return to the review of sidewalk melting, however, Figure 274 shows an example at McGill University. The main difference between
Figure 270. Streaking on wall of Pulp and Paper Building, McGill University.
Figure 271. Streaking on wall of University Street house in Montreal.
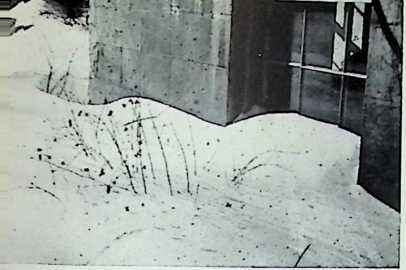 this and the Best and Company sidewalk is that here is the same effect produced accidentally. Snow melting -was not the aimonly the covering of heat pipes. Yet it is so effective that one can note in the photograph that although the surrounding areas are snow-covered, the white flakes do not even settle on this ■warmer surface •without turning to -water.
Figure 272. Front entrance wall, Registrar’s Office, McGill University.
An installation such as the above is quite common. However, according to Byers, “… .the oldest recorded installation of the sub-surface coil type of snow melting system dates back only to 1925. In that year the Rochester (N. Y.) Gas and Electric Corporation placed \y2" wrought iron steam pipes parallel to and about 14" below the concrete sidewalks on two sides of their new building. … . Effective as this installation was, it did not start any trend toward the general use of snow melting systems. No further progress seems to have been made until more than a decade later when the phenomenal success of radiant heating by embedded heat pipes led engineers to adapt radiant heating techniques to the problem of snow and ice removal.”
Regarding the appropriate design for snow-melting systems, there is no standard method. However, a calculation of the heating requirements may be obtained by use of the following formula given by Byers:
H = A-t-d-F
where H = heat requirements, in Btu
A = area in square feet
t = thickness of snow in feet
d = density of snow in pounds per cubic foot (about 6)
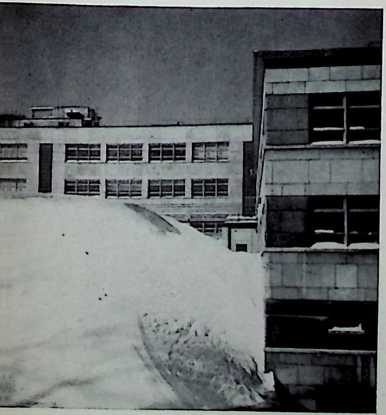
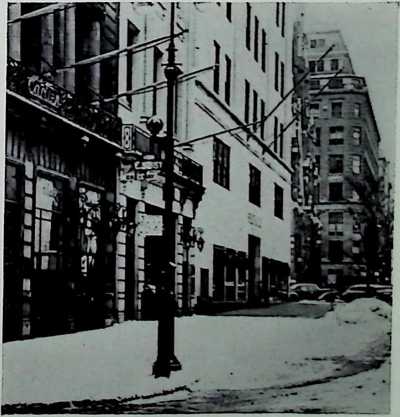
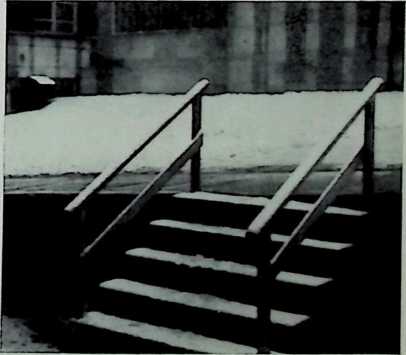
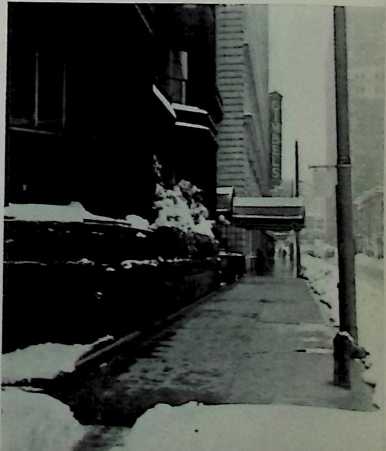 F = latent heat of fusion of snow or ice (144 Btu per lb.)
Figure 273 (below). Cyclotron, McGill University.
Figure 275 (below). Sidewalk in front of Best and Company after record snowfall in New York in 1947. Shreve, Lamb and Harmon, architects. Wrought iron piping by A. M. Byers Co.
Figure 276 (right). Sidewalk in front of Duquesne Club, Pittsburgh, after 30" snowfall in 1950.
Figure 274 (right). Walk, McGill University.
Assuming a melting rate of 1" of snow per hour for a surface of one square foot, the heat requirement would be:
H = 1 x x 6 x 144
= 72 Btu per hour per square foot.
The heating system must provide this heat at the slab surface after the various losses through its transmittance.
A full analysis of the problem may be obtained in the Byers catalog named in the bibliography or in literature of other companies engaged in this type of work. There are many other factors, as those of proper piping arrangements, the use of anti-freeze solutions, proper circulators, and boilers, which must not be overlooked.
Whether a snow melting system is used or not, it is necessary to make all exterior walks smooth (but not slick). Gravelled paths make snow removal by hand-shovel methods very difficult, and the walk loses its attractiveness. All exterior pavements should have in areas where freezing temperatures prevail, a deep, well-drained gravel sub-base in order to prevent frost damage.
Exterior steps should be avoided wherever possible in Canada and northern U.S.A, cities. In winter they become clogged up with snow and their effective width, as well as the depth of the tread, is reduced. They are hard to keep snow-free, except by radiant-heat methods. Ramps would be suitable only if they are provided with heat coils. Otherwise, they would become extremely slippery and, unless they are of a very shallow incline, would be even more hazardous than steps. The solution, therefore, lies in the installation of stairs or steps under cover, possibly totally within the framework of the building. Only the most necessary steps, as where it is desired to prevent water flowing through doorways, should be provided on the exterior.
On existing stairs and steps, where they occur outdoors, it has long been the custom, at least in parts of Canada, to install wooden treads with the advent of winter. This prevents persistent freeze-thaw causing rapid deterioration of the steps themselves. It also offers a surface that is less slippery than any type of stone. The practice is to be commended as a device to cure existing difficulties, not as a reason for putting stairs on the exterior.
Precipitation sometimes offers a flood danger to the city. It may be either of a temporary and relatively mild form, or of a longer and more permanent nature.
The first type usually arises from cloudbursts. It is thus important to know in which direction thunderstorms move and in which direction is the water shed. It is not prudent to place sewer lines along the probable path of big storms and/or sloping down in the same direction. Far better is it to position the drainage system so that it lies perpendicular to the path of the majority of large rain-bringing storms. The reason: if placed parallel to the clouds’ direction and sloping down, with distance the pipes will become quite full at the beginning and prevent additional run-off from being absorbed in the system farther down.
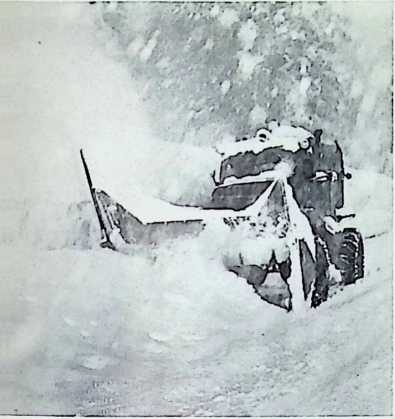
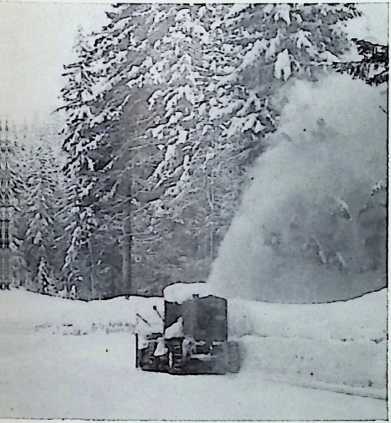 In winter, snow should be prevented from accumulating at those points, such as sewers, where melted snow or rain is normally removed. Such an occurrence cause local local nuisance conditions. Gratings, of the type used on large bridges, might be placed at various distances along the side, in the surface of the street itself; radiant heat piping, where feasible, could be installed for melting purposes.
Figure 277. Snow removal by plowing.
Figure 278. Snow removal by blowing.
Provision might also be made for the removal of snow when designing street patterns and layouts. Snow ploughs should have ample room to move around and not be hindered by such obstructions as fire hydrants, mail boxes, telegraph poles, newsstands, signs, trees, and many other objects found near the curb. Although the space should be adequate, as just mentioned, for the vehicles to circulate, it is unwise for this to be excessive; surplus pavement would require more cleaning. No standard may be set; conditions must be analyzed by planners and provided for accordingly. Photographs of snow removal by plowing and blowing are seen in Figures 277 and 278.
To prevent slipping on wet or icy roads some manufacturers are now producing skid-proof road surfaces. These have not yet been in use for a time long enough to enable one to render qualitative judgment. For slippery surfaces the City of Westmount, Quebec, employs a mixture of ash, cinders and salt. Although it serves the immediate purpose, that of preventing skids, this mixture has a corrosive action on cars, and is, in addition, more expensive than other commonly-used substances.
According to J. A. Racicot in the Canadian Engineer, in winter the Roads Department of the Province of Quebec sees that … abrasives are stored at strategical points of our winter road circuits. These reserves are placed at convenient places near the top or foot of hills, and at bad curves; so that even travellers can get at them when needed, and help themselves without the aid of maintenance crews.
“These abrasives consist of clean, sharp sands, well clinkered cinders, stone chips, or of a mixture of the above having good abrasive strength. The choice of these materials is determined mostly by the location of the source of supply and of the price of the material.
“The stock piles are treated with calcium chloride or sodium chloride to prevent their freezing during the winter. When treated with common salt, it is well mixed at the rate of 70 to 80 pounds per cubic yard of sand; in the case of a mixture of calcium chloride and sand the rate is 20 to 30 pounds of CaCl per cubic yard of sand.”
In other parts of the continent the following types of abrasive are used:
New York: The Division of Operation and Maintenance of the New York State Department of Public Works recommends the use of salt as an abrasive on icy roads.
Pennsylvania: The Department of Highways of the State of Pennsylvania uses cinders only for abrasives. They are stockpiled in advance of the snow season at strategic points adjacent to hills and curves, in quantities determined by experience. About 600,000 tons of cinders are used on the highways of Pennsylvania during an average winter.
Indiana: The State Highway Commission of Indiana, according to Earl B. Lockridge, . . uses a considerable amount of abrasives (sand and cinders) and chemicals (sodium chloride and calcium chloride) in combatting ice and snow on its highways through the winter. The calcium chloride is mixed with sand and cinders prior to application to the road surface, while the salt, in general, is applied in the pure statefrom 300 to 500 pounds to the mile, depending on local conditions.”
North Dakota: The North Dakota State Highway Department uses sand ■with calcium chloride to prevent skidding. However, they have also used some salt and salt mixed with sand on occasions.
Montana: The State of Montana Highway Commission, for sanding operations, uses materials available. Martin B. Powers reports, “This varies in different localities. In some sections we have natural deposits of sand and decomposed granite which work very satisfactorily. In some industrial areas we are able to obtain cinders free of charge. We use calcium chloride mixed with crushed material only in extreme ice conditions, which occur when the temperature remains below zero for any great length of time.”
California: G. T. McCoy, State Highway Engineer of California, advises: “For sanding slippery pavements in areas where low temperatures are encountered sand mixed with calcium chloride at the rate of 100 pounds of the salt to one cubic yard of sand is used. Mechanical sanders attached to the rear of maintenance trucks are used in applying the mixture. In areas where frosty conditions only occur, sand alone is applied as required. The expenditure for this type of work on California State highways will approximate $200,000 during a normal winter season.”
Oregon: The Oregon State Highway Department, informs R. H. Baldock, uses sand, fine crushed rock, or volcanic cinders on icy roads to prevent skidding. The best size is Y" to 10-mesh, but Yf is possibly more appropriate on packed snow.
~W ashington: R. P. Newland, Maintenance Engineer of the Washington State Highway Commission, reports that they confine the use of abrasives in his state to sand, sometimes salt-treated, due to the fact that other materials are not economically available.
Recommendations on all matters pertaining to highways may be obtained from the Highway Research Board, 2101 Constitution Avenue, Washington 25, D. C. That organization conducts research continually on nearly all phases of highway construction and maintenance. Of course, information can also be obtained from the highway department of almost any state, province, county, city, or town.
Because, by its very nature, the city cannot absorb water, but is forced to dispose of it in the form of excess run-off within a few minutes or, at the most, an hour, the sewers must take a big load in a short time. On the other hand, if vegetation were liberally positioned in the
6
city, more moisture would be absorbed by and returned to it over a longer period of time. This is yet another argument for the installation of trees as well as planting in as many places as possible, even on the roofs of buildings in the fashion of Le Corbusier.
The city may actually assist in the production or the release of precipitation. Says Linke (as translated by M. Giri): “Already for several decades it has been observed that particularly over large cities extraordinarily large water masses are released, often in excess of 100 liters per square meter in a few hours. But since even in summer rarely more than 16 liters are to be found in a vertical column of air of on- square meter crosssection this water mass must be forced sidewards at the same time to release itself over this unlucky area …There can be no doubt of the fact that strong cloudbursts become more frequent in towns.”
The New York Times on Sunday, July 15, 1951, ran this “column one” Associated Press report under attractive headlines: [“kansas city,]{.smallcaps} July 14. Gov. Forrest Smith declared a state of emergency today for the entire state of Missouri as the great flood that has plagued Kansas started down the Missouri River. All non-essential industries in the Kansas City area were ordered closed. Citizens were instructed to remain at home except when abroad on essential business. An area half a mile wide adjoining the flood zone was closed to civilians. Maj. Gen. Lewis A. Pick, chief of the Army Engineers, informed President Truman in Washington that the damage from the flood would easily exceed $500,000,000 and that 500,000 persons were homeless.” Subsequent estimates of the loss ranged from $750,000,000 to $1,000,000,000. What can be done to prevent such disasters? The answer: much. Unfortunately, people are reluctant to spend money for such protection. However, the initial cost would give them safety over a period of years and would relieve the government and private agencies (as the Red Cross) of millions of dollars for assistance to the victims.
More recently, in April 1952, the Missouri and Mississippi Rivers again went on the rampage, causing tremendous damage to many cities and towns along their banks. Shown in Figure 279 is a photograph of Mississippi River floodwaters that surrounded a St. Paul, Minnesota, warehouse area, bringing operations to a halt. Firms on the river’s edge, across the channel (top center) are also flooded. The rising stream threatened to halt traffic over the Wabasha Street Bridge (center background), which is a main link with downtown areas. The flooded building below the bridge, in midstream, is the “ship,” a naval reserve training center. Its lower “deck” is awash with four feet of water, according to the Associated Press.
Another disastrous flood occurred in the city of Winnipeg, Manitoba, Canada, in 1950. Although high waters had occurred in the Red and Assiniboine Rivers almost even spring before that, this was the worst on record. Winnipeggers battled by day and night to restrain the waters. The Lyndale Dyke is seen in its early stages of construction in
Figure 279. St. Paul, Minnesota, during 1952 floods.
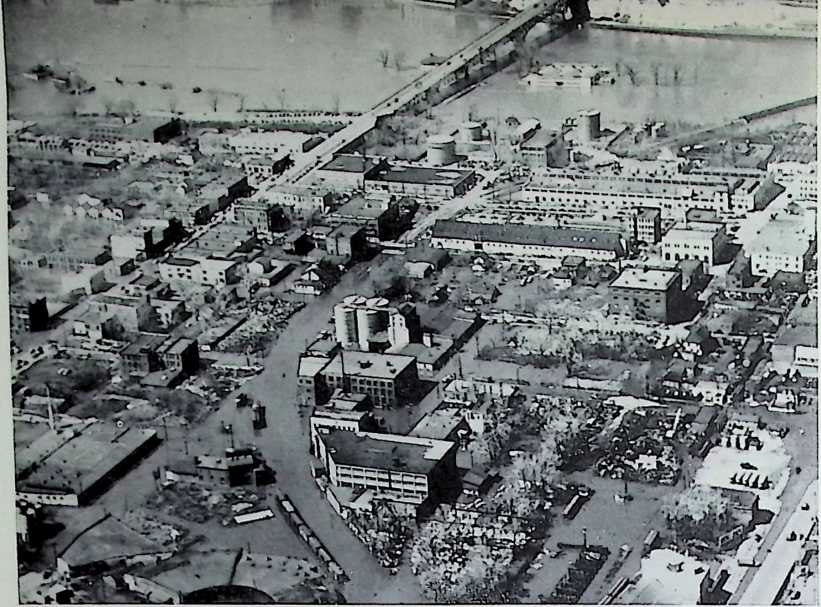
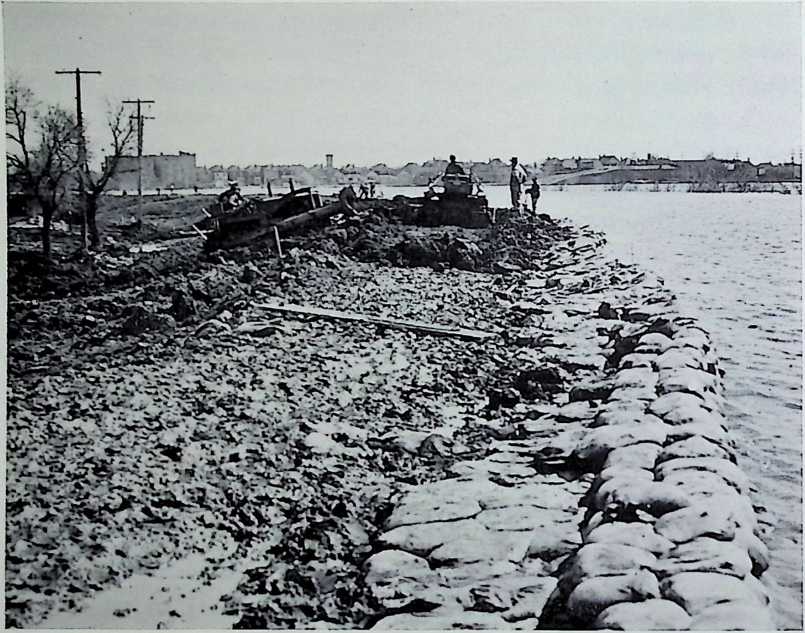
Figure 280. The original sandbag dike, which proved inadequate as the waters rose too high, was backed up with earth. This dike, which was built by 40,000 citizens working on day and night shifts, saved over 500 homes from complete inundation. An aerial view of this same dike is seen in Figure 281. The preliminary dike is behind the homes facing the river, and the big dike is just in front of them. In fact, according to David G. Henderson of the Metropolitan Planning Commission of Greater Winnipeg, a number of homes were part of the dike. Later on, a final dike was constructed, as seen above the inner road, and the two preliminary dikes were removed (although they are still shown here).
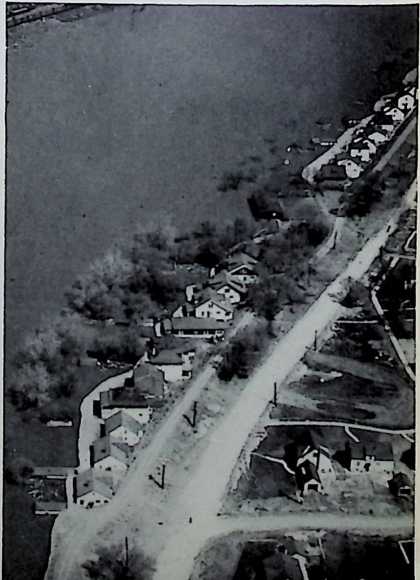 Figure 280. Lyndalc Dyke, Winnipeg, Manitoba, during the early stages ofl construction.
Figure 281 (icJcw). Lyndale Dyke, Winnipeg, Manitoba.
Figure 283 (below). Churchill Drive Dyke, built to protect the Riverview area and the Municipal Hospitals, Winnipeg.
Figure 282 (right). Kingston Row permanent secondary dike, Winnipeg. The river is on the immediate right.
Figure 284 (right). Wildwood Dyke, Winnipeg.
Figure 285 (left). Dike in the Netherlands.
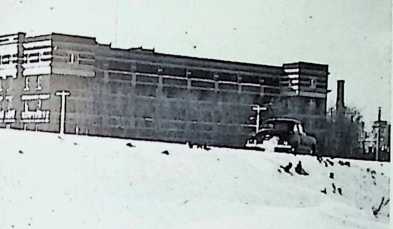
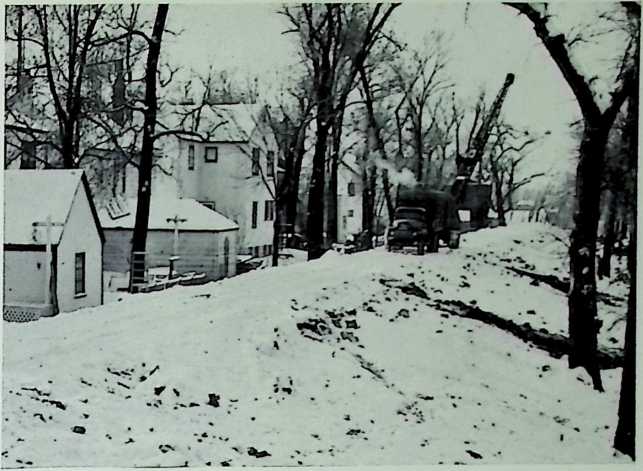
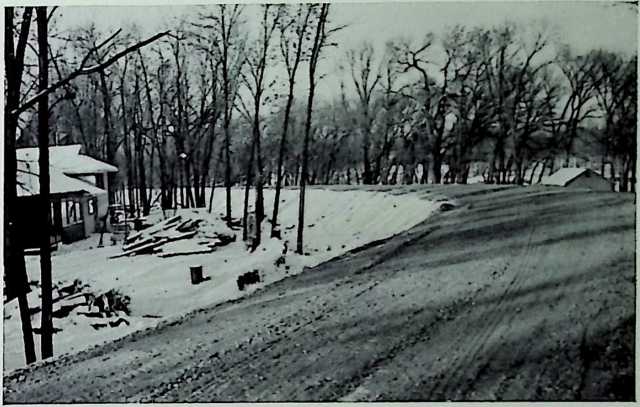
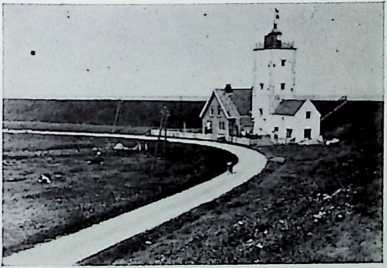
This work was under the supervision of a Dyking Board, which was established by the Province of Manitoba and financed 75 % by the federal government of Canada, 12>£% by the Province of Manitoba, and 12>£% by the local municipal governments. According to Eric Thrift, Director of Winnipeg’s Metropolitan Planning Commission, this board had its own staff of engineers, designers, field crews and similar personnel. However, it is now out of existence, its work completed. The type of construction they did is seen in Figures 282, 283 and 284.
Of course, we cannot end the discussion of dikes without referring to the Netherlands. Figure 285 shows part of the dike between
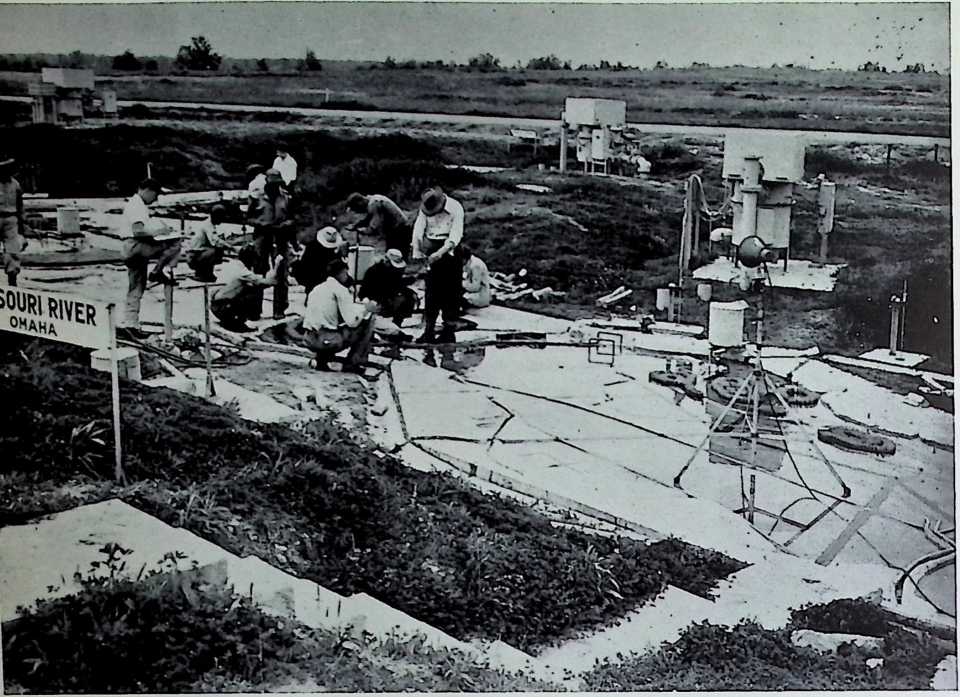
Figure 286. Scientists forecasting the 1952 Missouri flood on a model of the river.
Medemblik and Enkhuizen. Note the lower level of the polder land compared to the water in the background.
However, one may conceivably enquire: is it necessary for every city, even those which have not yet been ravaged by rampaging waters, to take similar action? Must permanent retaining walls be positioned along rivers and other bodies of water? No. But it is proposed that every organization of a planning nature municipal, provincial, state or regionalthat is liable to be concerned with such problems, employ the services of competent hydrologists and engineers. Hydrologists play a leading role; their job is to forecast possible occurrences of floods by analysis of flood-producing storms and the amount, duration, and sequence of a number of meteorologic and hydrologic factors and their combinations. (See Figure 286, showing scientists forecasting the 1952 Missouri Flood.) An elementary instance of possible flood conditions, understandable to the layman, is a heavy winter snowfall followed by a sudden and very warm spring. The other problems will not be discussed for fear of complicating the argument, but interested parties are advised to read Merrill Bernard’s “Flood Forecasting” paper listed in the bibliography. If a flood looms on the horizon, the city engineers can get to work and organize the erection of suitable temporary dikes and provisions for sewage disposal, water supply, and other services and utilities. Citizens can prepare for the onslaught by evacuation of the city or by removal to other quarters. Property can be protected. In the 1950 Manitoba floods many car owners even hoisted their automobiles by block and tackle to limbs of large trees!
In the United States of America the Weather Bureau has a department devoted exclusively to flood forecasting over the entire country. Other organizations may thus rely on the services of this federal agency. In Canada no such overall set-up exists, unfortunately, and each interested group, as previously mentioned, must make its own arrangements.
Fog and smog have been touched on in several other places in this work. Yet in this section we shall mention additional causes and efforts as well as further means for controlling the amount of fog and smog.
According to Linke (as translated by M. Giri), the impurities in the air which serve as a base for the formation of fog and smog over a city come from“… .soot, then mineral gowder, quartz a nd flint (silica, etc.) which is mixed with sulphur and phosphor, tar, oil, grease, lubricants, acids. There are many pieces which come from rubber, asphalt, feathers and similar organic substances. Also there is the pollen of flowersmicroorganisms, many of which are hygroscopic, so that there is a tiny surface of water which sticks them together. The size of these particles also varies from 1,000,000 th. of a centimeter in diameter; thus they are not seen in a microscope, only in special machines (called Nebelkam- mern). Larger pieces may be viewed by microscopeup to one-fifth of a millimeter. . . . From the hygienic viewpoint it is important as one inhales these impurities which come into contact with small blood vessels in the lungs. They get into membranes and the microbes cause infections. Hay fever is a famous civilization sickness of oversusceptibility . . . The London fog produces a. noticeable raising of the mortality rate.” Then Linke shows the effect of fog on the sun’s rays: “They do not only splay out and reflect but also absorb to a high degree. Observations in Berlin established that 20% of the sun’s rays were withheld as a result of this city smog. The larger part of this loss, however, is redeemed by radiation so that heat losses are not significant. In Vienna between the platform of the Stephen’s Tower and the street, 72 meters distance, a ray loss of 6% was established.”
Later on he describes two methods for measuring “smudging” of the air: “1. the nuclei counter. 2. the dust counter. The nuclei counter [mis]{.underline}ses only smaller, practically invisible particles which in the country constitute 8,000 and in the city 200,000 per cubic centimeter. If we consider the average particle of a size 0.00001 centimeter in radius, we will breathe approximately 10 cubic millimeters of these smallest particles per day, i.e., approximately 20 milligrams that are, for the most part, left in the lungs.”
Recognizing the importance of vegetation in city planning, Linke says, “The cooler and damper air that is to be found in vegetation-covered ground and parks hastens the drop of coarser particles.” The photograph in Figure 287, taken by the author atop the Sun Life Building, Montreal, shows that at the very point where vegetation is most predominant there is a relatively clear atmosphere instead of a foggy one.
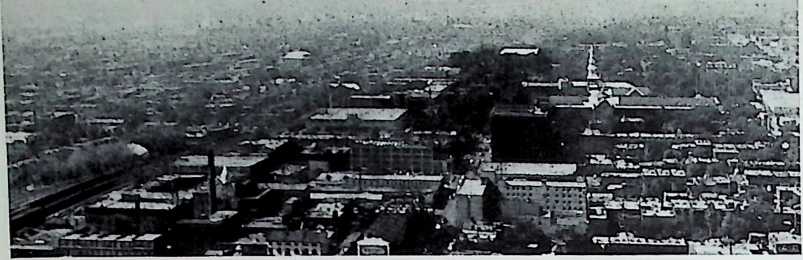 Also Linke remarks: “In Leipzig one found to windward and leeward of a square with very few obstacles a regression from 130 to 50 particles in the Zeiss Konimeter. Even vertical differences were present. In general there exists a thinning relative to height, though one finds at roof height, that is at chimney level, a distinct maximum. The coarser city smog does not only contain more but coarser nuclei. It has been observed in London that on darker days every square centimeter can contain 60,000 which is set against 300 in very clear air. These coarser particles, which are mostly by-products of burning, produce in open country less tons per square meter than in the town. In English industrial towns one has calculated 38 tons. In Paris, the fall of dust since the end of the century is supposed to have increased 50 %.
“The vertical rising of this city smog depends on the vertical mixing of the air and the length of daylight. On hot days with strong vertical turbulence and high wind speed it can be observed to heights of 1000 to 2000 meters quite clearly. However, in the afternoon hours, in the case of a calm, wind-free day and cloudy weather close to the city, the smog may lie 100 meters above the town. At night the particles sink especially when there is great water vapor near the earth’s surface. This is noticeable in Frankfurt because the air health resorts of the Taumus he above the smog line.” A similar comparison can be drawn with regard to hospitals and sanitoria in many cities.
A few more effects of smog are here recorded: “One can easily measure the smog effect of city smog by establishing the intensity of the sun’s rays …In cities we have been able to observe at times a smog factor 9. This means that the city’s atmosphere weakens the sun’s rays to the same degree as 9 clear atmospheres . . . The loss of fight in London due to smog was shown by Owens to be 50% in winter and 17% in summer. Thus the reduction is greatest just at the time the sun is needed the most.”
Atmospheric pollution in England has been discussed very well in Conurbation, a planning survey of the Birmingham and the Black Country by the West Midland Group. The reader is also referred to other authorities listed in the bibliography. All of them confirm the destructive effects of atmospheric pollution and the fact that the cities should be planned to avoid the causes.
Figure 287. Aerial view from Sun Life Building, Montreal.
¶ OTHER CLIMATIC FACTORS
¶ lightning
During the course of the summer months lightning may strike not infrequently. Its presence is a definite danger to the inhabitants of a building when inadequate preventatives are provided. It is of great import that architects be familiar with the problem, especially in rural areas, where lightning is the leading cause of fires (starting 37% of them) according to the National Board of Fire Underwriters.
Some remarks had been offered by the Romans and Greeks in classical times, but it was not until some idea of the exact physics of electricity was known to man that lightning rods were introduced. This began in the 1740’s when there was invented in Europe the Leyden jar, which permitted electricity to be stored in a flask of water. The populace was amazed at such a possibility and began experimenting in all matters electrical. It became the rage to rub glass tubes with a cloth to create sparks.
Soon after Benjamin Franklin returned to America from England, his London friends sent him such necessary “equipment” and his curiosity was aroused. Franklin performed many experiments and came to the conclusion that lightning was not unlike electricity. The Royal Society in London thought of him as a quack and did not permit insertion of his findings in their “Transactions.” But in 1750, after Franklin had recorded additional observations, Peter Collinson, an English acquaintance, anxious to make this intelligence public, persuaded the editor of the Gentleman’s Magazine to publish the results. This was in accordance with the American’s request to spread any knowledge in this field. Soon after, the Count de Buffon, “the greatest naturalist of the age,” thought that it was necessary to have the book translated immediately into French. Franklin’s fame quickly enveloped the continent, and German, Italian, and Latin editions were issued.
In these volumes, the title of which was “New Experiments and Observations in Electricity, made at Philadelphia, in America,” Franklin proposed, according to Richard Anderson in 1885, that “. . . all damage done by the electric fire descending from the clouds upon the earth might be put a stop to by fixing iron rods with sharp points to the summits of buildings.” He encouraged others to instigate further experiments. A wealthy man of sciences in France, a Mr. Dalibard, took up this proposition and prepared his equipment at his country home situated atop a hill in Marly-la-Ville, near Paris. He erected an 80-foot high, one-inch thick iron rod in his garden, but before he could observe any results, he was called away on business. One of his servants, a former French soldier, was left in charge, and on the afternoon of Wednesday, May 10, 1752, when a violent thunderstorm drifted overhead, the apparatus attracted some of the lightning.
Thus the lightning rod was bom. Although inspired by Franklin’s genius, as here seen, the invention was not first put into operation by him. But only seven weeks later on July 4, 1752,[13] Franklin cast into a cloud his famous kite and produced detailed notes, which recommended lightning rods of construction almost identical to that used today. They were quickly adopted in America (although there was some opposition); yet institution of the rods in Europe was delayed almost a century.
What are the current recommendations regarding the installation of lightning rods? Where should they be put, and what types should be employed? What is the effective area of protection?
The United States Department of Commerce has issued a report on lightning protection, entitled Code for Protection Against Lightning. A summary of this, with other comments, appears below:
TABLE 54. LIGHTNING PROTECTION REQUIREMENTS FOR BUILDINGS
Size of Rod Terminal:
Spacing:
Number Required:
10" minimum, 12" average, 18" often required by U. 5. Government agencies. Commonly made up to 60".
For rods 18" high or less, maximum spacing 18z-0" for parapets, eaves of flat roofs, ridges of gable and hip roofs.
For rods over 18" high, maximum spacing 20" for parapets or eaves of flat roofs only. On dormer ridges: maximum spacing, 13".
Gable, Gambrel, or Hipped Roofs:
For plan 110z-0" or less in perimeter, provide minimum of two down conductors. If over 110z-0", add one for each additional 50z-0" or fraction thereof.
Flat, French or Sawtooth Roofs:
For plan 300z-0" or less in perimeter, provide minimum of two down conductors. If over 300" in perimeter add one for each additional 100z-0" or fraction thereof.
If Above Are Not Rectangular Shapes:
Additional Number Required.*
Where the structure is of an irregular shape, the total number of down conductors shall be sufficient to make the average distance between them along the perimeter not greater than lOO-O". However, in any case, the following number of conductors must be provided in addition to the requirements set forth under the above articles on different-shaped roofs:
For L-shaped building add one
For T-shaped building add one
For wing-shaped building add one
For H-shaped building add two.
If Building Above 60z-0" High:
If the structure is more than 60z-0" high it is necessary to add one down conductor for each additional 60z-0" or fraction thereof BUT conductors do not have to be less than 50z-0" apart on the perimeter.
Where Branch Conductor Is More than 16" Away from Main:
If there is cause to construct a branch conductor, it must be within 16z-0" of the main line. Otherwise an additional conductor to the ground must be employed.
Turns’
The minimum bend of a conductor shall be 8".
Grounding.’
Space Protected:
-
Conductor may be grounded to an underground pipe, as a metal water pipe.
-
In the deep soil of a moist nature, rod shall extend to a depth of at least 1O-OW.
-
In deep soil of a dry nature, rods should have plates attached to ends of extend their effective area.
-
In shallow soil extend rod at least 12" from wall of building. Or if less than l" deep soil, encircle building with buried conductor and attach down conductors to it.
According to the Lightning Research Conference of leading British scientists in various disciplines, commencing in 1878:
"The question as to the extent of the space which will probably be protected by a lightning rod is one which is of very great practical importance, because it governs the number and height of the upper terminals which are required for the protection of any given building…. It has been laid down that the space protected was a cone, having the point for its apex and a base whose radius was equal to twice the height of the point, while the latest French official instructions… state that a point will effectively protect a cone having the point for its apex, and a base whose radius is 1.75 of its height.’ The English War Department instructions considerably reduce this space by asserting …that no precise limit can be fixed to the protecting power of conductors. In England the base of the protected cone is usually assumed to have a radius equal to the height from the ground; but though this may be sufficiently correct for practical purposes, it cannot always be relied upon.’ ”
The United States Bureau of Standards in 1945, in the Code for Protection Against Lightning, adopted the same two-to-one protective area formula as the British did in 1878. However, the maximum protective area, the Washington office said, was within a cone whose radius was equal to four times the height of the protector.
It is advisable to install lightning conductors on all electric service and telephone wires, and on radio and television antennae, as well as on buildings, because of their tendency to attract electricity in the atmosphere. Unless the equipment is grounded in this manner, lightning may go down the wires to the interior of the building and inflict serious damage.
The folio-wing information and figures are provided through the courtesy of the Independent Protection Company, Inc., Goshen, Indiana. They have also some very good literature on problems of protecting buildings from lightning. Their specifications are in accordance with the requirements of the Underwriter’s Laboratories, Inc., Chicago, Illinois, which are in general accordance with the National Code for Protection Against Lightning, as published by the National Fire Protection Association.
Figure 288 (below far left). Complete circle ground system. Figure 289 (below left). Fork-type ground system. Figure 290 (below). Semi-circular ground system.

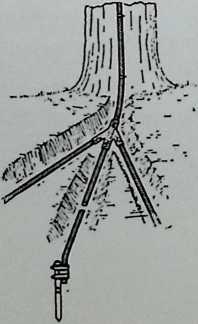

TABLE 55. LIGHTNING PROTECTION REQUIREMENTS FOR TREES
+:-----------------------------+:--------------------------------------------------------------------------------------------------------------------------------------------------------------------------------------------------------------------------------------------------------------------------------------------------------------------------------------------------------------------------------------------------------------------------------------------------------------------------------------------------------------------------------------------------------------------------------------------------------------------------------------------------------------------------------------------------+
| Points! | Points designed especially for tree installations shall be attached to the extreme upper ends of conductors, and shall be anchored securely. |
±-----------------------------±--------------------------------------------------------------------------------------------------------------------------------------------------------------------------------------------------------------------------------------------------------------------------------------------------------------------------------------------------------------------------------------------------------------------------------------------------------------------------------------------------------------------------------------------------------------------------------------------------------------------------------------------------------------------------------------------------+
| Conductors: | Standard conductors shall be used on main trunk of tree and for all ground connections. The ordinary tree with trunk up to 3 feet in diameter requires one standard conductor, extending from the highest accessible part of the tree, or from the main junction of branches, along main trunk to ground connections. |
| | |
| | Trees with trunks exceeding 3 feet in diameter, with long and wide spread branches should be provided with two standard down conductors placed on opposite sides of the trunk. |
| | |
| | Miniature conductors may be used for branch runs and shall extend from accessible heights of three or more of the main branches down to the main trunk with the connection made to the standard conductor by means of a specially-designed fitting. |
±-----------------------------±--------------------------------------------------------------------------------------------------------------------------------------------------------------------------------------------------------------------------------------------------------------------------------------------------------------------------------------------------------------------------------------------------------------------------------------------------------------------------------------------------------------------------------------------------------------------------------------------------------------------------------------------------------------------------------------------------+
| Conductor Attachments: | Conductors shall be attached securely to the tree but in such a way as to allow for continued growth of the tree and for its swaying in the wind. |
±-----------------------------±--------------------------------------------------------------------------------------------------------------------------------------------------------------------------------------------------------------------------------------------------------------------------------------------------------------------------------------------------------------------------------------------------------------------------------------------------------------------------------------------------------------------------------------------------------------------------------------------------------------------------------------------------------------------------------------------------+
| Grounds: | There are three main types of grounds: |
| | |
| | Semi-Circle Ground is very effective on ordinary trees requiring one main down conductor. Conductor should be extended out and away from the base of the tree, in a shallow trench, 12 inches deep, at least 12 feet to a semi-circular conductor placed in a similar trench at an equal radius from the tree. The ends of this conductor should extend down to permanent moisture, for depth groundings. Tall, straight trees usually require only one depth ground, but large and wide-spread trees may require more. (See Figure 290.) |
| | |
| | Complete Circular Grounds are used on larger trees which require two or more down conductors. Down conductors should be extended out and away from the base of the tree concerned in a shallow trench, 12 inches deep, at least 12 feet to a circular conductor, buried at the same depth and at an equal radius from the base. Radius of the circle should be increased for wide-spreading trees. At least one depth ground should be connected to the circular conductor and should extend to permanent moisture. More depth grounds give additional protection, however. (See Figure 288.) |
| | |
| | Fork Type Grounds are equally effective as the above two and are often more practical to use because of conditions, such as nearness of trees to buildings, sidewalks, property lines, eta, which make it inconvenient to use the circular type. The main down conductor is placed in a shallow trench, about 12 inches deep, and extended out from the base of the tree, from 12 to 25 feet, or even further. At the end of this conductor a depth ground to permanent moisture is added. Branch conductors are attached to the main conductor with special fittings, and are placed in shallow trenches forming a fork. Large trees require additional depth grounds. (See Figure 289.) |
±-----------------------------±--------------------------------------------------------------------------------------------------------------------------------------------------------------------------------------------------------------------------------------------------------------------------------------------------------------------------------------------------------------------------------------------------------------------------------------------------------------------------------------------------------------------------------------------------------------------------------------------------------------------------------------------------------------------------------------------------+
¶ humidity
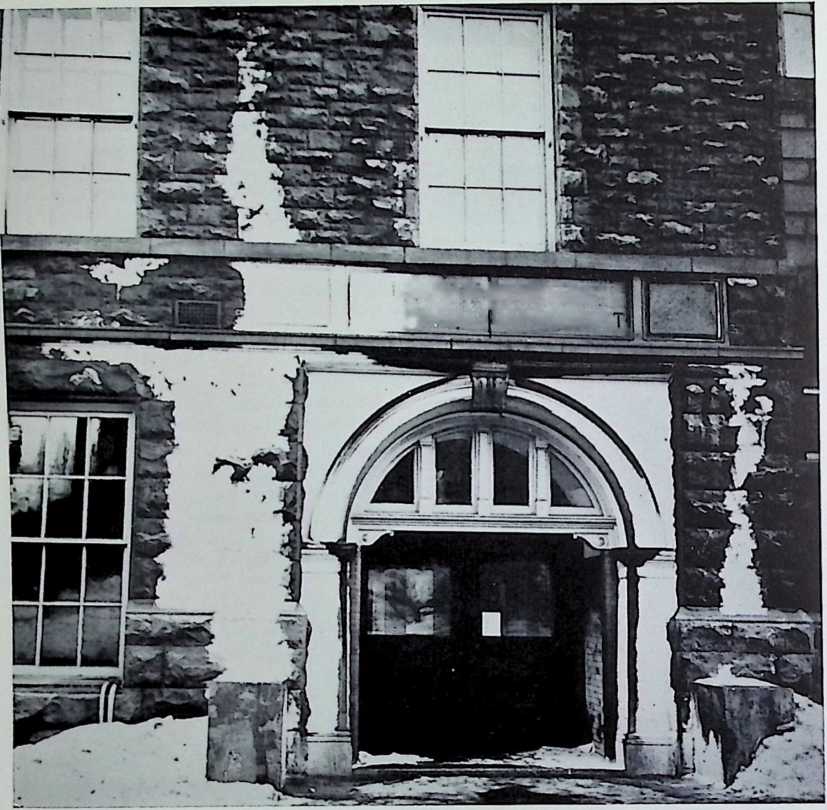
HOMAS [WORKMAN $N1CAL DEPARTMEN
Figure 291. Frost on the wall near the side entrance of the MacDonald Engineering Building, McGill University.
Humidity is a problem to be reckoned with more in the design of materials than in the layout of a building. Under “Temperature and Humidity” there have been discussed some of the main problems of comfort due to these combined elements. There the architect was advised of conditions of humidity for siting.
A main source of trouble in winter is due to indoor humidity. As a result of the higher temperatures there, the air can hold more water vapor indoors than it can outside. However, this vapor condenses where there is a cold surface, as on a window pane, for it is cooled beyond its dew-point. One would therefore recommend for the climate of northern latitudes provision of paned glass of the two-layer types in all architectural works. These are known by various trade names; although more expensive than the single-paned types, they do eliminate many other problems, besides those of condensation.
For the same reason, condensation will form on the inside of walls in winter, and it is therefore imperative that architects provide vapor barriers and insulation to prevent this occurrence. Vapor barriers should always be installed on the warm, or inner, side of walls and partitions. Condensation also occurs on the outside of buildings when a warm spell in winter follows a cold one. The stone of large structures, for example, may still be quite cold when the warm air touches it; the latter is forced to condense some of its moisture on the wall of the building, and frost is formed. Figure 291 is a photograph of such an occurrence on the side entrance of the MacDonald Engineering Building, McGill University.
The danger lies not in the frost itself but in the water that is produced after the warm air has been present for a long time. If adequate waterproofing is not provided, it may lead to serious difficulties resulting from damage to materials.
Siple contends that one should not emphasize relative humidity (which is the ratio of the moisture content of air to the amount of moisture it could contain if it were saturated at the same temperature) as much as dewpoints and vapor pressure. The rates of evaporation and moisture transfer, he says, can be understood much better by the use of absolute rather than relative humidity. Siple illustrated in his paper entitled “Climatic Criteria for Building Construction”: “For example, let us assume a building is losing enough heat through its single glazed window panes to keep their outer surfaces at about 63° F. when the outside air temperature is 34° F. Now let us assume that these windows are moistened by a mist falling out of a saturated atmosphere. Many people would be inclined to argue that because the atmosphere is at 100 per cent relative humidity there could be no evaporative cooling. Actually, however, moisture would be evaporating from the surface of the building walls, despite the falling mist, at a rate equivalent to a 33 per cent relative humidity. Expressed in millimeters of mercury the vapor pressure of the saturated atmosphere would be 5 as compared to a vapor pressure of about 15 of the 63° warm window pane. Such heat loss would be tremendous, because heat lost by the evaporation of water on the window pane would be about 1000 times greater than would be lost if the temperature of the moisture could be raised 1° F. without evaporation. This suggests to a climatologist studying the problem that it would be advantageous to help prevent such heat loss by coating the outer surfaces of such windows with a waterproof silicon resin to prevent rain or moisture resting on it.” Then he advises, as has already been suggested, that an even better solution would be the utilization of double glazing.
What is vapor pressure exactly? It is the pressure of vapor in the atmosphere and is important because of its connection with evaporation. The rate of evaporation from a water surface is a function of the difference between the saturation vapor pressure over the water surface and the actual vapor pressure of the air. Where the difference is great, the evaporation is rapid.
Vapor pressure figures are not provided here. However, it is possible to point out their airchitectural significance. For example, many basements are dripping with moisture in summer because of vapor-pressure action. Moisture accumulates there as a result of the basement air temperature being lower than the outdoor dewpoint temperature. The moisture enters from the outside, so it does not do any good under these circumstances to keep the basement windows open in order to try to dry it out. The main idea is to raise the interior temperature above the outside dewpoint. As Siple suggested in the article just mentioned: “The basement could be vapor-sealed and the air dried mechanically, but there is a much simpler way. By heating the basement floor and walls to about 70 or 75°, which will be above dewpoint temperatures, the basement will be dry. And it won’t be necessary to burn fuel to do this. During the summer there is an overabundance of sun which we must shade ourselves from. Let in some of this sunshine; or put one end of a coil of radiant heating tubing capable of carrying a liquid into the floor and walls of the basement, and the other end of the coil out under a sunstruck pavement, court or sidewalk. Circulation will transfer the heat. You may even cool an undesirably hot paved court and warm the basement to a usable temperature at the same time.”
Vapor pressure varies over the earth and during the day. It is highest at the equator and decreases towards the poles; this is because the distribution must follow quite closely that of temperatures. For the same reason, at each latitude it is higher in the summer than in the winter. The diurnal variation is different over land and sea; however, not considering ourselves naval architects, we will limit our remarks to the former: vapor pressure over land is at a minimum during daytime and at a maximum during the night.
Wet-bulb thermometers, incidentally, help to measure humidity in the atmosphere. A wet muslin bag is placed over the bulb of a thermometer; the water in the bag evaporates and in so doing, requires heat. This reduces the temperature of the bulb to a point termed the wet-bulb temperature; it represents the lowest point to which air can be cooled by evaporating water into it at a constant pressure. The reading is usually found to be about half-way between the dew-point and dry-bulb temperatures.
¶ CONCLUSION
“To acquaint architects, architectural students, engineers, city planners, builders, present and prospective home owners, and othersespecially those in North Americawith the demands and phenomena of the large and small-scale climate, known respectively as the macroclimate and microclimate; and to inform them how to apply this knowledge to the design and orientation of buildings and towns.”
This was the object at the beginning of the book, and it has consistently been the aim in every chapter. The architect, now armed with this knowledge, must return to these climatic fundamentals when undertaking the design of any building. There is no “a-b-c” formula. He must think for himself, as every situation is different. But by approaching the problems intelligently, a planner will achieve better conditions for his clients; and his neighbors in allied professions, such as heating engineering, will also have their tasks lessenedthe least number of climatic handicaps would be put in their way.
There is no prescribed recipe, but we do have the basic ingredients which may be mixed and varied to suit individual tastes as follows:
-
Clients should, if possible, consult their architect and airchi- tect before purchasing a site. The professional fees usually include this service anyway, whether used or not, and one should take advantage of it.
-
The above parties should select a site, not only according to economic considerations, desirability of the land, proximity to transportation, and so forth, but also with regard to its airchitectural qualities.
-
These airchitectural qualities should be divided into those natural ones which occur over the unimproved land and those which might predominate when there is construction on it.
-
The design of the building may be evolved. Preferred room exposures should govern, as much as possible, the location of units.
-
If the above qualities require modification, devices such as overhangs, brise-soleil, windbreaks, snow fences, and the like, may be employed.
-
Buildings should be located with reference to one another on similar airchitectural principles.
-
Street patterns and city plans may then be laid out in a wise airchitectural manner. Of course, governmental jurisdiction may prevent architects in private practice from delving too far in this, unless they are commissioned by the governmental body concerned.
-
All these steps should be integrated with regional planning requirements.
What about the future? We are opening up a new applied science. Siple has termed this a “coming field.” There are countless possibilities for study. For example, Geiger has noted that chickens, when let loose, will always seek the most favorable microclimate. We can learn from them and other animals.
We can also investigate the influences of climate on the human body and how the body’s needs can be accommodated by architects in building design. The role of mechanical engineers demands attention, and landscaping is not to be ignored. The weathering qualities of materials offers further study possibilities as well.
We must associate various disciplines and dissect them all to their minutest detail. Test houses can be constructed, examinations made in wind tunnels, climatic recording apparatus installed throughout various cities, and many other tasks performed: that is, if we have the men, the equipment and the money.
If we have only the men, graduate seminars at our universities on “climate and man” would at any rate keep the matter alive and would explore any additional research opportunities. Indeed, even undergraduates in architecture (and in other faculties, too) could be encouraged to search for climatic information and apply it to their work. A separate university course in climate as related to architecture would serve to inspire such students.
Whatever the approach we may use, let us make the most of the climate; let us learn how to live with the climate, not in opposition to it. Let us realize that there are not only many different climates on this continent but also so many in every state and province, in every county and parish, in every city and town, in every village and hamlet, in every garden, and, indeed, right up to every front door. Let us make sure that the climate at our door knocks softly.
“There are more things in heaven and earth, Horatio,
Than are dreamt of in your philosophy.”
Shakespeare, Hamlet. Act. I, Sc. 5.
¶ Bibliography
Jean Alazard, Le Corbusier. Florence: Electa Editrice, 1951.
Handsome little pocket book with sketches by Le Corbusier himself. Not much about climate, except that which is inferred by Corbusier’s teaching.
Alberta, Department of Agriculture, Farmstead Planning and Beautification, (Bulletin No. 9). Edmonton: 1950. Discusses shelter belts, etc.
Henry R. Aldridge, The Case for Town Planning, London: National Housing and Town Planning Council, 1915. Shows in part how ancient civilizations, and more recent ones too, have accounted for the climate in their building practices.
William Allen, “The Building Research Station.” Toronto: Journal of the Royal Architectural Institute of Canada, vol. 24, no. 1, January, 1947, pp. 24-26, 32.
A description of the British Building Research Station and some of the work being done there.
American Architect and Building News. Boston: Ticknor & Company, vol. 23, no. 643, 1888, p. 190, first col. Used here for specific data about current building practices of 1888.
American Society of Heating and Ventilating Engineers, Heating, Ventilating and Air Conditioning Guide. New York: 1953 (pub. annually.)
An exhaustive study of this subject from the engineer’s point- of-view. It is recommended that architects use it to obtain data but should not necessarily form their thinking along the same lines.
American Zinc Institute, Inc., A Survey of Roofing on Farm Buildings. New York: (no date)
Among other things, the results show which types of roofing and which exposures of roofing wear the most.
Parker Anderson, Planting the Farmstead Shelter Bell. St. Paul: University of Minnesota, Agricultural Extension Service, U. S. Department of Agriculture (Extension Bulletin 196), April, 1949.
Shelterbelt information.
Parker Anderson, “Windbreaks for Field Protection.” St. Paul: University of Minnesota, U. S. Department of Agriculture, Agricultural Extension Service, (Extension Folder 140), May, 1950.
A summary of the requirements for shelterbelts.
Richard Anderson, Lightning Conductors, Their History, Nature, and Mode of Application. London: E. and
- N. Spon, 1885.
An excellent historical review of lightning rods with illustrations.
Architectural Forum, The Magazine of Building, vol. 87, no. 3, New York: Time, Inc., September, 1947.
Has seven USA post-war houses, most of which are sensibly designed from the climatic point-of-view.
Architectural Forum, The Magazine of Building, vol. 86, no. 2, p. 126, New York: Time, Inc., February, 1947. Description of Lof’s solar house work at the University of Denver.
Architectural Forum, The Magazine of Building, vol. 95, no. 3, pp. 180-188. “Lift-Slab Concrete.” New York: Time, Inc., September, 1951.
Depicts possibilities in using concrete lift-slab techniques.
Architectural Forum, The Magazine of Building, vol. 89, no. 5, pp. 97-160. “Measure.” New York: Time, Inc., November, 1948.
A discussion of the influences of heat, atmosphere, light, sound, etc., on architecture and planning. An interesting general account.
Architectural Forum, The Magazine of Building, vol. 85, no. 2, pp. 76-79. “Rye Shopping Center.” New York: Time, Inc., August, 1947.
Illustrates trend towards covered store fronts.
Archilectziral Forum, The Magazine of Building, vol. 94, no. 5, p. 17. “Solar Dog House Ribs Modern Design.” New York: Time, Inc., May, 1951.
Illustrative of the fact that not only humans have satisfaction in solar houses.
Archilectziral Forzzm, The Magazine of Building, vol. 94: no. 5, pp. 170-178. “Testing Design.” New York, Time, Inc., May, 1951.
A report on the work being done at the Texas Engineering- Experiment Station.
Archilectziral Record, Time-Saver Standards. New York:
- W. Dodge Corp., 1946.
Basic material on sun angles, orientation, etc.
Archilectziral Record, vol. 105, no. 4, pp. 135-138. “M.I.T. Builds Solar-Heated House.” New York: F. W. Dodge Corp., April, 1949.
A summary of M.I.T.’s latest project.
Architectural Record, vol. 108, no. 2, p. 161. “Weather’s- Effect on Design Studied By Texas Colleges.” New York: F. W. Dodge Corp., August, 1951.
Summarizes the investigations being done in Texas.
Architectural Review, vol. cix, no. 651, March, 1951, p. 145. An illustration of how air currents can be utilized on the roofs of buildings.
- Anthony Atkinson, “Building in the Tropics.” London: Journal of the Royal Institute of British Architects. Third Series, vol. 57, no. 8, June, 1950, pp. 313-320. Some ciimatical implications regarding building in the tropics. Very interesting.
Thomas Dinham Atkinson, A Glossary of Terms Used in English Architecture. London: Methuen and Co., Ltd., 1944.
Page 201 has definition of “orientation.” Otherwise nothing about this subject.
Jane Austen, Pride and Prejudice. London: MacMillan and Co., Limited, 1929.
Not a reference book on the subject of this book. There are, however, one or two comments on architectural practice in the design of residences.
Australia, Department of Works and Housing (Commonwealth Experimental Building Station of), Natural Ventilation, Ceiling Height, and Room Size. (Duplicated Document No. 22). Sydney: July, 1947.
One of a series of good reports by this Australian body.
B
L. H. Bailey, The Standard Cyclopedia of Horticulture. New York: The MacMillan Co., 1922. vols. 1-6.
For those who want very detailed information about plant life.
Geoffrey Baker and Bruno Funaro, Windows in Modern Architecture. New York: Architectural Book Publishing Company, 1948.
A fine volume on window design, with many comments on the climatic problems involved. Recommended reading.
K. H. Baruth, ed., Journal of the Israel Town Planning Association, vol. 1, no. 2, winter 1950-1951.
Published quarterly, there is occasionally something about climatic influences on planning.
Merrill Bernard, “Flood Forecasting.” In United States of America, Department of Agriculture, Climate and Man. Washington: U. S. Government Printing Office, 1941, pp. 565-576.
A good paper for anyone engaged in the protection of cities from floods.
J. W. Bilby, Among Unknown Eskimo. London: Seeley Service and Co., Ltd., 1923.
A personal account of the life of the Eskimos.
T. E. Bond, “Solar Heating.” Davis, California: University of California (mimeographed sheets), no date.
A three-page description of solar heating work in California-
C. C. Boughner and M. K. Thomas, Climatic Summaries for Selected Meteorological Stations in Canada, Newfoundland, and Labrador, vols. I and II. Toronto: Department of TransportCanada (Meteorological Division of), 1948.
Considerable climatic data of architectural interest for selected stations only. Other references provide data for each observation post in Canada. If desired, contact above office for information.
J. H. Boyce, “The Construction of New Lawns.” Ottawa: Central Experimental Farm, Dominion Experimental Farms Service, The Division of Forage Crops, no date.
Among other things, the climatic requirements of different types of lawns are discussed.
Robin Boyd, Victorian Modern. Melbourne: Architectural Students’ Society of the Royal Victorian Institute of Architects, 1947.
The “Victorian” here refers to the state of Victoria, Australia. Contains some comments on orientation problems of the southern hemisphere.
C. C. D. Brammall, “Solarscope and Artificial Sky.” Toronto: Journal of the Royal Architectural Institute of Canada, set. no. 297, vol. 27, no. 5, May, 1950, pp. 177-178.
Description of the work at the Australian Commonwealth Experimental Building Station in Sydney, N.S.W… as well as a brief history of previous research elsewhere on the relation of sun to buildings.
E. Brezina and W. Schmidt, Das Kiinstliche Klima in der Umgebung des Menschen. Stuttgart, 1937.
A good basic reference in German.
C. E. Britton, “A Meteorological Chronology to A.D. 1450.” Geophysical Memoirs, no. 70. London: Meteorological Office, 1936.
Records of the climate, through writings, from 2668 B.C. to 1450 A.D., in Great Britain.
C. E. P. Brooks, Climate in Everyday Life. New York: Philosophical Library, Inc., 1951.
A good book on many aspects of the manner in which climate affects us. One must use the index for reference puqioses. It is often very difficult to find what one wants merely by glancing through what one would think is the appropriate chapter. Contains a thorough bibliography.
David Brunt, “Climate, Weather and Man.” Endeavour,
July, 1944.
Some reactions of the human body to atmospheric conditions. Metabolic rates, etc.
David Brunt, “Some Factors in Micro-Climatology.” London: Quarterly Journal of the Royal Meteorological Society, vol. 71, nos. 307-308, January-April, 1945, pp. 1-10.
The control of air temperature, and the effect of the nature of the soil, type of surface, lack of soil drainage, soil covering, katabatic winds, etc. Rather interesting.
David Brunt, Weather Study. London: Thomas Nelson and Sons, Ltd., 1942.
A handy guide for elementary meteorological problems.
L. W. Bryant and D. H. Williams, "Discontinuous Flow Around the Edge of a Bluff Obstacle.” (Great Britain: Aeronautical Research Committee, Reportsand Memoranda, No. 962.) London: H. M. Stationery Office, January, 1925.
Ven- interesting description of smoke flow analysis of wind.
Walter Bunning, A.R.I.B.A., A.R.A.I.A., A.A.S.T.C., Homes in the Sun. Sydney: W. J. Nesbit, 1945.
Contains information on solar-designed houses in the land “down-under.”
David I. Bushnell, Jr., Native Villages and Village Siles East of the Mississippi. Washington: Smithsonian Institute, Bureau of American Ethnology, Bulletin 69, Government Printing Office, 1919.
Descriptions of the habits of Indian tribes in their minutest detail. It is necessary to search around for data about the recognition of climate in the design of their dwellings.
David I. Bushnell, Jr., Villages of the Algonquian, Siouan, and Caddoan Tribes West of the Mississippi. Washington: Smithsonian Institute, Bureau of American Ethnology, Bulletin 77, Government Printing Office, 1922.
- M. Byers Company, “Byers Wrought Iron for Snow Melting Systems.” Pittsburgh: 1951.
A catalog on one method of snow disposal.
Byggniastaren, Tidskrift for Arkitektur och Byggnadstek- nik. Stockholm: vol. 29, no. 16, August 2, 1950.
An extremely fine booklet in Swedish. Whether one understands this language or not, it is not unwise to glance through this.
c
Canada, Department of Finance (National Housing Administration of) and National Research Council (Codes and Specifications Section of), National Building Code. (National Research Council Book No. 1068). Ottawa: 1942.
Indispensable for all those investigating merits of Canada’s Building Code as far as the climate is concerned. The new revised Code, under preparation at the time of writing of this book (and on which the author has assisted) gives even greater attention to climate in a separate section.
Canada, Department of Mines and Resources (Mines, Forests and Scientific Services Branch of), Native Trees of Canada. (Bulletin 61), 4th. edition. Ottawa: King’s Printer and Controller of Stationery, 1949. An attractive book, good for any bookshelf. The one major drawback is that there is no comparative pictorial index of trees.
Canada, Department of Trades and Commerce (Dominion Bureau of Statistics of), Canada Year Book. Ottawa: Queen’s Printer and Controller of Stationery, 1952. (pub. annually.)
Contains significant climatic data for selected towns in Canada.
Canada, National Research Council, Discussion of Avalanche Defense Works, (translated from the original of Edwin Bucher.) (Translation TT-66). Ottawa: April 6, 1948.
Of particular significance to those intending to build in mountainous areas.
Canada, National Research Council, Snow and Avalanches in Winter 1945-1946. (translated from the original of Edwin Bucher and Melchior Schild.) (Translation
TT-62.) Ottawa: February 12, 1948.
Discusses the formation of avalanches and the damages resulting from them in Switzerland.
Canada, National Research Council, Swedish Test Hut Research Program, (translated from the original of Nils Holmquist.) (Translation TT-96.) Ottawa: January, 1950.
Mostly regarding the use of different materials as far as the weather is concerned.
Canada, National Research Council, The Swiss Federal Institute for Snow and Avalanche Research on Weiss- jluhjoch near Davos at 8700 Feet Above Sea Level. (Translation TT-64.) Ottawa: February 24, 1948. Discusses “avalanche breakers” and other items of interest to architects. A synopsis by several authors; translated from the original in German.
J. B. Carne, “The Natural Ventilation of Unheated ‘Closed Rooms.’ ” Cambridge: The Journal of Hygiene, vol. 44, pp. 314-325, 1945-1946.
Description of effectiveness of different types of wall openings, flues, etc., in ventilating rooms.
Noel Carrington, The Shape of Things. London: Nicholson and Watson, Limited, 1939.
A description with sketches of various factors, including climate, which have influenced design of buildings, furniture instruments, etc.
W. W. Caudhill, (statement included in) United States of America, National Research Council (Building Research Advisory Board of), Weather and the Building Industry. Washington: 1950.
A Texan’s humorous and intelligent analysis of the climatic problems confronting architects.
W. W. Caudhill, Sherman E. Crites, and Elmer G. Smith, Some General Considerations in the Natural Ventilation of Buildings. (Research Report No. 22). College Station, Texas: Texas Engineering Experiment Station, The Texas A. and M. College System, 1951. Quite good.
Victor Conrad, Methods in Climatology. Cambridge: Harvard University Press, 1944.
Designed to acquaint one with mathematical statistics and theory of probability applicable to climatological problems. Not of direct interest to architects, except to those engaged in research.
Arnold Court, “Wind Chill.” Bulletin of the American Meteorological Society, vol. 29, no. 10, December, 1948, pp. 487-493.
An excellent report on the subject of wind chill.
Ralph Adams Cram, Impressions of Japanese Architecture and the Allied Arts. London: John Lane: The Bodley Head, 1906.
Has only one remark about climate, on page 128.
Thomas H. Creighton, Frank G. Lopez, Charles Magruder, George A. Sanderson, Homes. New York:
Reinhold Publishing Corp., 1949.
Shows the general type of contemporary residence architecture in the USA.
Helen Cullinane, “Solar Radiation Observations.” Monthly Weather Review, vol. 69, no. 4, p. 141. Washington: U. S. Department of Commerce (Weather Bureau of), April, 1941.
Describes how measurements are taken and gives some data.
D
J. E. Davis, Windbreaks for Illinois Farmsteads. Urbana: State of Illinois Department of Registration and Education (Natural History Survey Division of), (Circular 38), April, 1951.
Very good material on the influence of windbreaks.
Eric de Mare, editor, New Ways of Building. London: The Architectural Press, 1948.
A few incidental notes on orientation.
M. de Perthuis, Traite d’Architecture Rurale. Paris: De 1’Imprimerie de Crapelet 1810.
In French; some observations on orientation here and there.
Frangois de Pierrefeu and Le Corbusier, La Maison des Homines. Paris: Librairie Pion, 1942.
Le Corbusier here pronounces some more of his climatic ideas of architecture, such as: “Le soleil est dictateur, selon les climats, selon les saisons.”
- M. B. Dobson, “Some Meteorological Aspects of Atmospheric Pollution.” Quarterly Journal of the Royal Meteorological Society, vol. 74, no. 320, pp. 133-143, April, 1948.
The author has not read this work. Therefore no comment is offered.
J. Robert Dodge and M. J. Larock, “Temperatures and Related Conditions in Wisconsin Farmhouses.” United States of America, Department of Agriculture (Technical Bulletin No. 1002), Washington: U. S. Government Printing Office, March, 1950. Recommended reading. Very detailed.
A. F. Dufton and H. E. Beckett, “The Heliodon, an Instrument for Demonstrating the Apparent Motion of the Sun.” Journal of Scientific Instruments, vol. 9, 1932, p. 251.
The title is self-explanatory.
E
E. and O. E., (sic) Planning An Annual Notebook. London: The Architect and Building News, 1939.
Orientation notes for various types of buildings, written in a chatty style.
W. Everett Eakin, “Insulating Glass-Studies in Its Use in Milk & Dairy Barns.” Toledo, Ohio: Libbey- Owens-Ford Glass Company, (no date). 19 pages printed and illustrated.
A colorful description of some of the possibilities in solardesigning farm buildings.
Garrett Eckbo, Landscape for Living. New York: Architectural Record with Duell, Sloan and Pearce, 1950. An ecological study of climate, landscaping, and architecture. Suggested reading.
G. Eiffel, “Nouvelles Recherches sur la Resistance de 1’Air et 1’Aviation.” 2nd. ed. Paris: 1919.
Fascinating descriptions; in French.
John Everetts, Jr., “Analysis and Influence of Climatology Upon Air Conditioning Design.” in United States of America, National Research Council (Building Research Advisory Board of), Weather and the Building Industry. Washington: 1950.
An engineer’s approach to the problem.
F
A. Fage, “Experiments on the Shielding Effect of Wind Screens at the Entrance to Airship Sheds.” (Great Britain: Advisory Committee for Aeronautics, 1913). H. M. Stationery Office, 1915, pp. 61-64. Description of wind flow for a particular situation.
Cedric Firth, State Housing in New Zealand, Wellington, New Zealand: Ministry of Works, 1949.
Statistics regarding planning for sunlight (pp. 72). Applies to southern hemisphere. Attractive book in general.
James Marston Fitch, American Building, the Forces that Shape II. Boston: Houghton Mifflin Company, 1948. Has interesting sections on history of recognition of climate in architecture, solar heat, building in relation to microclimate, devices for control of atmospheric environment, etc.
James Marston Fitch, “Buildings Designed for Climate Control.” in United States of America, National Research Council (Building Research Advisory Board of), Weather and the Building Industry. (Research Conference Report No. 1). Washington: 1950. A popular report about climate control.
Banister Fletcher (Sir), A History of Architecture. London:
- T. Batsford, Ltd., 1946.
Excellent analysis of the history of architecture on the comparative method. Each period has a small discussion on the manner in which climate influenced the architecture.
Robert D. Fletcher and E. Dillon Smith, “Meteorological Factors Affecting Smoke Pollution.” (Proceedings of meeting of the Smoke Prevention Association of America, Detroit, Michigan, June 6-9, 1944.) The author was unable to obtain this paper.
- L. Forsling, “Snow Melt” in U. S. of America, Department of Agriculture, Climate and Man. Washington: U. S. Government Printing Office, 1941, pp. 557- 560.
Sigmund Fritz, “Solar Radiation During Cloudless Days.” Heating and Ventilating, January, 1949.
Of indirect interest to those studying the effect of the sun on buildings and city planning. Information presented here must be interpreted.
Sigmund Fritz and Torrence H. MacDonald, “Average Solar Radiation in the United States.” Heating and Ventilating, July, 1949.
Average daily amounts of solar radiation received on a unit horizontal surface over the United States for each month are presented in the form of isolines on maps. The relationship of this to cloudless day radiations and per cent of possible sunshine is given as a linear equation; this is followed by a discussion of use of the equation to supplement values of solar radiation obtained by direct measurement.
G
Rudolf Geiger, The Climate Near the Ground. Cambridge: Harvard University Press, 1950.
This is about the only text on microclimatology. Extremely detailed, some of it applies to architecture, some does not. However, a “must” for all interested in pursuing this field further. An exhaustive bibliography, with special attention given to German works.
R. Darnley Gibbs, Botany. Philadelphia: The Blakiston Co., 1950.
Contains some data on climate, plants, shelterbelts, etc. Attractive layout.
Sigfried Giedion, Space, Time and Architecture. Cambridge: The Harvard University Press, 1942.
Has occasional, and only occasional, references to climate.
Glass Industry, U. S. A. “Sun-Exposed Glass Walls Provide Test for Solar Heating.” September, 1943.
Have not reviewed this personally.
Philip L. Goodwin, Brazil Builds. New York: The Museum of Modern Art, 1943.
Brazilian architecture new and old, well illustrated. Occasional references to climate.
G. W. Grabham, “Some Factors on Thermal Sanitation in the Tropics.” Cambridge: Journal of Hygiene, vol. 19, 1921, p. 245.
Great Britain, Advisory Committee for Aeronautics (Reports and Memoranda, No. 431.) “The Airflow Behind a Screen for Protecting an Aeroplane in the Open.” London: Sir Joseph Causton and Sons, Ltd., March, 1918.
Illustrations of the comparative resistance of different types of shelter. Although antique bi-planes are used as examples, the knowledge offered by the text is applicable today and is of architectural interest.
Great Britain, The Association for Planning and Regional Reconstruction, Trees for Town and Country. London: Lund Humphries, 1949.
An excellent comparative study of trees, considering their suitability in various climates and in conjunction with various buildings in England.
Great Britain, Department of Scientific and Industrial Research, Penetration of Daylight and Sunlight into Buildings. (Illumination Research Technical Paper No. 7). London: H. M. Stationery Office, 1927.
Has a good appendix on the subject: loss of sunlight due to obstructions.
Great Britain, Lightning Rod Conference, Report. London:
- and F. N. Spon, 1882.
A detailed description of methods to protect against lightning by members of several learned and professional societies in England during the late nineteenth century. Has an extremely good bibliography. Although old, is not to be overlooked.
Great Britain, Ministry of Works (Committee Convened by the Royal Institute of British Architects), The Architectural Use of Building Materials (Post-War Building Studies No. 18). London: H. M. Stationery Office, 1946.
Great Britain, Ministry of Works (Committee Convened by the Royal Institute of British Architects), Walls, Floors and Roofs. (Post-War Building Studies No. 15). London: H. M. Stationery Office, 1944.
This pertains mostly to the effects of climate on materials rather than the overall design of buildings.
Great Britain, Ministry of Works (Department of Scientific and Industrial Research of), Atmospheric Pollution in Leicester: a Scientific Survey. (Atmospheric Pollution Research Technical Paper No. 1). London:
- M. Stat. Office, 1945.
The author has not read the volume and is not prepared to comment on it.
Great Britain, Ministry of Works (Department of Scientific and Industrial Research of), Healing and Ventilation of Dwellings. (Post-War Building Studies No. 19). London: H. M. Stat. Off., 1945.
Great Britain, Ministry of Works (Department of Scientific and Industrial Research of), The Lighting of Buildings. (Post-War Building Studies No. 12). London: H. M. Stat. Off., 1944.
Extremely good regarding matters of orientation for daylight.
- Gugler, “Besonnung von Gebauden,” Schweizerische Bauzeitung. (Revue Polytechnique Suisse). Zurich: vol. 69, no. 20, May 19, 1951, pp. 276-281.
In German, it is difficult to understand without having an adequate knowledge of the language. A very authoritative article, however, on the movement of the sun with relation to the orientation of buildings.
Heinrich Gutersohn, Sonnenstrahlzmg und Bergschalten auf dem Gebiel der Sladl Zurich. Zurich: Buchdruckerei Gebr. Fretz A. G., September 6, 1934.
Very enlightening. In German, however.
H
Talbot Hamlin, Architecture, An Art for All Men. New York: Columbia University Press, 1947.
A survey of the methods of architecture, including one or two references to the necessity of providing for the climate.
Talbot Hamlin, Architechire Throzigh the Ages. New York:
G. P. Putnam’s Sons, 1940.
This learned architect and historian, in an excellent summary of our heritage, makes several points regarding architecture and climate, (pp. 513, 516-518, 645.)
Irving F. Hand, “A Summary of Total Solar and Sky Radiation Measurements in the United States.” Monthly Weather Review, vol. 69, no. 4, pp. 95-125. Washington: U. S. Department of Commerce (Weather Bureau of), April, 1941.
Valuable information contained herein, expecially for researchers.
Irving F. Hand, “Weekly Mean Values of Daily Total Solar and Sky Radiation.” Washington: U. S. Department of Commerce (Weather Bureau of), Technical Paper No. 11, 1949.
Presents in graphical form weekly mean values of daily total solar and sky radiation received on a horizontal surface at Weather Bureau and cooperating stations during the 35 years ending 1949. Quite interesting.
Jiro Harada, The Lesson of Japanese Architecture. London: The Studio, Ltd., 1936.
Contains a number of comments on the Japanese consideration for climate in their building practices.
- Kenneth Hare, “Climatic Classification.” in London Essays in Geography, (ed. by L. Dudley Stamp and S. W. Wooldridge.) London: Longman’s Green and Co., 1951.
An authoritative summary of the classification of world climates by different systems.
F. Kenneth Hare, “The Climate of the Eastern Canadian Arctic and Sub-Arctic and Its Influence on Accessibility.” Montreal: University of Montreal (Ph.D. thesis), 1950.
This might be a good reference for those building in this area. Also proposes methods for climatic classification in this region.
- F. Harlow and T. J. Powers, “Pollution Control at Large Chemical Works.” Industrial and Engineering Chemistry, vol. 39, no. 5, pp. 572-577, May, 1947.
Alonzo J. Harriman, “A Design Study: School Operating Costs.” New York: Architectural Record, vol. 107, no. 4, April, 1950, pp. 126-130.
Debunks some contemporary theories regarding school design, using climate as a major arguing point.
Bernhard Haurwitz and James M. Austin, Climatology. New York: McGraw-Hill Book Co., 1944.
A good book on climate; perhaps of a slightly advanced nature. Quite detailed regarding weather in various parts of the world. Has a good summary of the subject of microclimatology, mostly taken from Geiger.
W. C. L. Hemeon and T. F. Hatch, “Atmospheric Pollution.” Industrial and Engineering Chemistry, vol. 39, no. 5, pp. 568-571, May, 1947.
Unread by author.
- Wendell Hewson, “Atmospheric Pollution by Heavy Industry.” Industrial and Engineering Chemistry, vol.
36, no. 3, pp. 195-201, September, 1945.
Unread by author.
L. Hilberseimer, The New City, Principles of Planning. Chicago: Paul Theobald, 1944.
A first-rate book about good city planning. Describes the remarks of Xenophon and Socrates, practices of Pueblo dwellers, designs of Miljutin, Le Corbusier, and F. LL. Wright, among others. Excellent descriptions of orientation problems, sun angles, smoke pollution, winds, etc.
Leonard Hill, T. C. Angus, and E. M. Newbold, “Further Experimental Observations to Determine the Relations Between Kata Cooling Powers and Atmospheric Conditions.” The Journal of Industrial Hygiene. Boston: Harvard School of Public Health, vol. 10, no. 10, December, 1928, pp. 391-407.
Not of direct interest to architects, except those engaged in research.
G. A. Hills, Pedology, “The Dirt Science.” Toronto, Ontario Department of Lands and Forests, (no date.) About climate and soils in Ontario. 24 pp.
Frederick Webb Hodge, ed., Handbook of American Indian, North of Mexico. Washington: Smithsonian Institution, Bur. of Amer. Ethnology, Bull. 30, part 1, Gov’t. Printing Off., 1907.
pp. 77-82 have a good summary of Indian architecture.
House Beautiful, “Regional Climate Analyses and Design Data.” Bulletin of the American Institute of Architects. Washington: issued 15 times between October, 1949, and January, 1952.
A lot of climatic data for numerous areas of the United States, especially prepared for use of architects. However, the authors do not always explain how to use the statistics.
House Beautiful’s Practical Gardener, (magazine). New York: Hearst Magazines, Inc., 1951.
Numerous good tips about landscaping as a part of “climate control.”
Lund Humphries, Village Housing in the Tropics. London: H. M. Stationery Office, 1947.
Has special significance for West Africa, but knowledge of protection of towns from wind erosion and flooding can be applied anywhere. Gives sun angles in tropical latitudes.
Ellsworth Huntington and Stephen Sargent Visher, Climatic Changes. New Haven: Yale University Press, 1922.
Not of direct interest to architects. Contains interesting data for investigators of climatic patterns. Discusses climate uniformity, variability, change, cycles.
C. P. Hursh and C. A. Connaughton, “Effects of Forest Upon Local Climate.” Journal of Forestry. Washington: Society of American Foresters, vol. 36, no. 9, September, 1938, pp. 864-866.
F. W. Hutchinson, "The Solar House.” Progressive Architecture. New York: Reinhold Publishing Co., May, 1947.
A heating engineer’s report.
I
Illinois, University of (Agricultural Experiment Station and Extension Service in Agriculture and Home Economics, College of Agriculture), Planning the Illinois Farmstead for Efficiency, Health and Enjoyment. Urbana: 1947.
A fine booklet on orientation of farm buildings with respect to the sun, winds, and odors.
Erik Ingelstam and Karl-Erik Walderyd, Sludier Rorande Laverkan. Stockholm: Statens Kommittee for Byg- gnadsforskning (Rapport nr. 12), 1947.
An excellent study in Swedish on wind flow around buildings. Not absolutely necessary to understand the language to read the bookthe illustrations are often self-explanatory.
- O. V. Irminger and Chr. N0kkentved, Wind-Pressure on Buildings. (Experimental Researches, Second Series.) K0benhaven: Danmarks Naturvidenskabelige Samfund, 1936.
An excellent description of wind-flow through the use of streamline analysis with aluminum powder in water on models.
Howard Chapin Ives, *Natural Trigonometric Functions.
*New York: John Wiley and Sons, Inc., 1931.
Good for use in calculating sun angles, etc. Gives the trigonometric functions to seven decimal places for every ten seconds of arc. Considerable time, usually taken in interpolation processes, is thus saved. The only fault is that it does not give figures for secants.
J
Norman J. Jenkins, A.A.S.A., A.R.A.I.A., A.N.Z.I.A., The Australian House. Sydney: W. J. Nesbit (no. date.)
The discussion on orientation on pages 10 to 16 is quite good.
K
R. J. Kalamkar, and K. M. Gadre, “Precision Observations on Weather and Crops.” Current Science, vol. 4, no. 9, pp. 645-646, March, 1936.
Not of direct interest to architects.
Hans Kampffmeyer, Wohnstatte und Arbeitsstdlle. (Homes Should Be Built Near Workshops.) Stuttgart, Julius Hofman Verlag, 1932.
In English, French, and German. Describes planning mostly with regard to winds.
George F. Keck, “Solar House.” Architect’s Journal. December 6, 1945.
Not read by author.
Fiske Kimball, Domestic Architecture of the American Colonies and of the Early Republic. New York: Charles Scribner’s Sons, 1927.
Used here for specific references to colonial building in America.
George H. T. Kimble, “The Changing Climate.” Scientific American, vol. 182, no. 4, April, 1950, pp. 48-53.
Explanations of some recent climatic changes in northern latitudes.
George H. T. Kimble and Raymond Bush, The Weather. New York: Penguin Books, Inc., May, 1946.
A book about the weather, written in a popular vein. It describes the elements of meteorological phenomena as well as the manners by which we can use this knowledge.
Kimble Glass Company, A Study of Vision Strips as Related to Glass Block Fenestration. Toledo, Ohio: 1952.
A report on a test project conducted jointly by the Texas Engineering Experiment Station and the Owens-Illinois Glass Company. Attractively presented.
Hideto Kishida, Japanese Architecture. Tokyo: Board of Tourist Industry, Japanese Government Railways, May, 1935.
Contains a few interesting comments on the influence of climate on Japanese architecture. A small, paper bound, pocket-book-size volume.
John Kobler, “Like Living in Macy’s Window.” The Saturday Evening Post, vol. 222, no. 13, September 24, 1949, pp. 42 ff.
A popular article about solar heating.
W. Kbppen and R. Geiger, ed., Handbiich der Klimatologie. Berlin: vol. 1, part C, 1936.
A general reference book on climatology in German.
Albert Kratzer, Das Stadlklima. Die Wissenschaft, vol. 90. Braunschweig: Friedr. Vieweg & Sohn, 1937. A standard reference on the city climate in German.
George Kubler, Mexican Architecture of the Sixteenth Century. New Haven: Yale University Press, 1948.
It is necessary to hunt through the book for mention of climate in architecture, but there are numerous references.
L
Helmut E. Landsberg, “Climate and Planning of Settlements.” (Address before Convention tid-bits. Symposium I “Urban and Regional Planning,” the American Institute of Architects.) Washington: May 10, 1950.
Factual and interesting. Scientific data interspersed with historical tid-bits.
Helmut E. Landsberg, “Microclimatic Research in Relation to Building Construction.” in U. S. of America, National Research Council (Building Research Advisory Board of), Weather and the Building Industry. Research Conference Report No. 1). Washington: 1950.
Very good reading.
Helmut E. Landsberg, “Microclimatology and House Building.” (Speech delivered at the First Annual Technical Forum of House Beautiful’s Climate Control Project), September 20, 1949.
Like most of Landsberg’s papers, this one is not only interesting reading but filled with a lot of worthwhile information.
Helmut E. Landsberg, “Use of Climatological Data in Heating and Cooling Design.” Heating, Piping and Air Conditioning, vol. 19, no. 9, pp. 121-125. September, 1947.
An excellent account of what climatic data to look for, how to get it, and what to do with it.
Karl Langer, “Sub-tropical Housing.” University of Queensland Papers, vol. 1, no. 7, Brisbane, Australia: University of Queensland (Faculty of Engineering of), May 29, 1944.
A thorough analysis of housing problems as it applies to tropical areas of Australia. Quite good.
Pierre Lavedan, Histoire de I’Urbanisme. Anliquite-Moyen Age. Paris: Henri Laurens, 1926.
The standard reference on city planning; written in French. Discusses various aspects of orientation.
Le Corbusier and Pierre Jeanneret, Ihr Gesamtes Werk von 1910-1929. Zurich: Verlag Dr. H. Girsberger et Cie, 1930.
In German; it describes some of Le Corbusier’s first attitudes towards climate, as well as other architectural considerations. Not a specific reference book on this subject, but every architect should have this and the entire Le Corbusier series anyway.
Le Corbusier and Pierre Jeanneret, Oeuvre Complete de 1929-1934. Zurich: Willy Boesiger, Les Editions d’Architecture Erlenbach, 4th ed., 1947.
Illustrates the development of Le Corbusier’s recognition of climate. Photographs of city plans according to the axe heliolhermique, and of brise-soleil on buildings.
Le Corbusier and P. Jeanneret, Oeuvre Complete, 1934- 1938. Zurich: Max Bill, Les Editions Dr. H. Girsberger, 2nd. ed., 1945.
Sun, wind, and climate well explained in the town of Nemours, North Africa (p. 27), and variations in thickness of buildings due to different orientations discussed (p. 32).
Le Corbusier, Oeuvre Complete 1938-1946. Zurich: Willy Boesiger, Les Editions d’Architecture Erlenbach, 1946.
The culmination of Le Corbusier’s search for suitable sun controls in the form of various types of brise-soleil is evidenced in this book.
Douglas H. K. Lee, “Thoughts on Housing for the Humid Tropics.” The Geographical Review, vol. 41, no. 1, January, 1951, pp. 124-147.
A vivid analysis, well illustrated, by the director of Johns Hopkins’ Isaiah Bowman School of Geography.
Douglas H. K. Lee, “Physiological Principles in Tropical Housing.” University of Queensland Papers, vol. 1, no. 8. Brisbane, Australia: University of Queensland (Department of Physiology of), May 29, 1944. Extremely good analysis of this problem. Discusses effect of heat on the human body, the nature of hot climates, protection against direct heating, use and control of convection, air conditioning, causation and prevention of fatigue, role of nutrition. Should not be overlooked by anyone interested in this field.
Robert F. Legget, “Building Research.” Toronto: Engineering and Contract Record, March, 1948. (reprinted as National Research Council of Canada, Division of Building Research Bulletin DBR-1).
“An outline of the tasks ahead,” informs the sub-title.
Robert F. Legget, “Building Research in Canada.” Toronto: Journal of the Royal Architectural Institute of Canada, vol. 25, no. 4, April 1948, pp. 111-116.
This is repeated in some of Legget’s other articles. Not much about results, only about future plans. Very good reading.
Robert F. Legget, “Climate and Building.” Toronto: Royal Meteorological Society, Canadian Branch, vol. 1, no. 8, November, 1950.
Some of the work proposed or being done at the Building Research Division, National Research Council, Ottawa, is here discussed by its director. Recommended.
Robert F. Legget, “Flight Cariberg.” The Beaver, September, 1950, pp. 2-6.
Illustrative of the many climates that occur in Canada within a short period of time and within relatively short distances. Description of an 8000-mile flight through northern Canada. Of interest to architects, as it was written by the head of the Building Research Division of Canada’s National Research Council. Thought-stimulating.
A. G. G. Leonard, Bridget P. McVeny, and D. Crowley. “Atmospheric Pollution in Dublin during the Years, 1939, 1940, 1941.” Scientific Proceedings of the Royal Dublin Society, vol. 22, no. 41, pp. 395-404; vol. 22, no. 25, pp. 257-265; and vol. 23, no. 3, pp. 10-17. September, 1940; September, 1941; and November, 1942.
The author has not read this work.
Harold MacLean Lewis, Planning the Modern City, vol. 1. New York: John Wiley and Sons, Inc., 1949.
Page 33 shows how climate affects the city plan.
James P. Lewis, Geology, Sociology, Climatology, and Their Influence on Regional Architecture. (B. Arch, thesis, 1950). Winnipeg: University of Manitoba, (Planning Research Center of), 1950.
The climate section is prepared in a fashion similar to that in House Beautiful. It gives the information but provides little interpretation for architectural purposes.
Libbey-Owens-Ford Glass Company, “Improved Farm Building Daylighting with Thermopane Insulating Glass.” Toledo, Ohio: August, 1950.
An eight-page pamphlet, it describes some solar heat designs of farm buildings. Illustrated.
- Linke, “Das Klima der Groszstadt,” in Biologic der Groszstadt. Dresden: Verlag von Theodor Steinkopff, 1940, pp. 75-90.
Extremely detailed account of weather in big cities, as opposed to that in the surrounding country. Recommended to any who can read German. However, translation of major points appears in this book.
Richmond W. Longley, “The Effect of Freezing and Melting Processes on the Daily Temperature Curve at Quebec City.” Quarterly Journal of the Royal Meteorological Society, vol. 75, no. 325, July, 1949.
Might be of interest to architects and others who wish to study freezing and thawing effects on materials.
Richmond W. Longley, “The Variability of the Mean Daily Temperature at Selected Canadian Stations.” Quarterly Journal of the Royal Meteorological Society, vol. 73, nos. 317-318, July-October, 1947. Shows, among other things, that winter temperatures are more variable than summer ones, that water surfaces moderate temperatures, and that in Canada there is an abrupt change from winter to summer conditions, and vice-versa.
M
C. O. Mackey and L. T. Wright, Jr., “The Sol-Air ThermometerA New Instrument.” Heating, Piping and. Air Conditioning, May, 1946, p. 107 ff.
Definitely recommended.
H. H. Madill, “The Architect and the Hospital Board.” Toronto: Journal of the Royal Architectural Institute of Canada, vol. 28, no. 4, April, 1951, p. 98.
Professor of Architecture at the University of Toronto gives his views on orientation.
Manitoba, University of (Prairie Rural Housing Committee, The Planning Research Centre, School of Architecture of), Farm Houses. Winnipeg: no date. Has one or two remarks about orientation on the prairies.
Manitoba, University of (Prairie Rural Housing Committee, The Planning Research Centre, School of Architecture of), Farm House Planning. Winnipeg: March . 1952.
Discusses the influence of climate on farm site planning and on the design of individual farm houses.
Manitoba, University of (Prairie Rural Housing Committee, The Planning Research Centre, School of Architecture of), Farm House Remodeling, Winnipeg: January 1952.
A few items on the importance of orientation.
- Manley, “MicroclimatologyLocal Variations of Cli mate Likely to Affect the Design and Siting of Buildings.” London: The Journal of the Royal Institute of British Architects. Third Series, vol. 56, no. 7, pp.317-323.
To be recommended. Illustrates some of the phenomena in the small-scale variations of the climate. Has small, but good, bibliography.
C. F. Marvin, Monthly Weather Review. Washington: 1914, vol. 42, p. 583.
One or two microclimatological points.
John Masefield, “The Joy of Story Telling.” Atlantic Monthly, vol. 187, no. 3, March, 1951.
On page 22 there are two comments about climatic phenomena in Ledbury, Herefordshire, which should draw some interest.
Massachusetts Institute of Technology, The Space Heating Committee (Cabot Solar Energy Research), Report of Symposium: “Space Heating with Solar Energy.” Cambridge: August 21 to 26, 1950. Papers by Hoyt C. Nottel, Lawrence B. Anderson, Eugene Ayres, Paul A. Siple, Albert G. H. Dietz, George O. G. Lof, George Fred Keck, Maria Telkes, Eleanor Raymond, August L. Hesselschwerdt, George V. Parmelee, E. R. Ambrose.
This is very valuable material on the subject of solar energy and its use in architecture. Only a passing mention was made of the conference here because M. I. T.’s report was not available while this book was being written.
Albert Mayer, “The New Capital of the Punjab.” Washington: Journal of the American Institute of Architects, page 168, October, 1950.
A general description of Mayer and Whittlesey’s design of Chandigarh.
Ian R. McCallum, editor, Physical Planning. London: The Architectural Press, 1948.
Presented in true Architectural Press fashion (i.e. good), this book touches on climate as it applies to general planning only. Not a standard reference for climate and architecture.
W. J. McConnell and C. P. Yagloglou, “The Katathermometer; Its Value and Defects.” in U. S. of America, Bureau of Mines, Report Investigations, ser. no. 2565, 1924.
Not of direct interest to architects. Good data for researchers, however.
P. D. McTaggart-Cowan, “Weather and the Canadian Weather Service.” Toronto: The Canadian Banker, vol. 58, no. 1, Winter 1951.
For those who want to learn how the Canadian Meteorological Division operates.
W. E. Knowles Middleton and F. Graham Millar, “Temperature Profiles in Toronto.” Jozirnal of the Royal Astronomical Society of Canada, vol. 30, p. 265, September, 1936.
Description of how temperature readings over the city of Toronto were taken by means of equipment mounted on an automobile. Extremely interesting conclusions.
Horace Miner, St. Denis, A French-Canadian Parish. Chicago: The University of Chicago Press, 1939.
Describes, in part, the architectural side of rural Quebec and how the inhabitants shelter themselves from the climate.
Minneapolis-Honeywell Regulator Company, Control Manual for Healing, Ventilating and Air Conditioning. Minneapolis: 1950.
Several references to theory here might be of interest to some architects.
Minneapolis-Honeywell Regulator Company, Honeywell Modulating Weatherstal. Minneapolis: (no date.)
This four-page pamphlet describes a method for accounting for the sun, wind, and temperature in heating systems.
Minnesota, University of (Agricultural Extension Service, U. S. Department of Agriculture). Pruning Young Windbreak Trees. (Extension Folder 91), St. Paul: September, 1940.
D. G. Mirams, A Brief History of Chinese Architecture. Shanghai: Kelly and Walsh, Ltd., 1940.
Occasional references to the influence of climate on Chinese architecture. Quite interesting.
Jens Mollerup, “Denmark and Danish Architecture.” Toronto: Journal of the Royal Architectural Institute of Canada, vol. 26, no. 8, August 1949.
One or two evidences of how the Danish architects account for climate.
Margaret R. Montgomery, “Baffin Island Expedition, 1950: Climate.” Arctic. Ottawa: The Arctic Institute of North America, vol. 3, no. 3, December, 1950.
A record of the climate in a part of Canada’s far north.
Montreal, City of, By-Law Concerninglhe Erection of Buildings in the City of Montreal. (No. 1900), 1948.
Handy when studying the climatic justification for some of the building requirements in Montreal.
- H. G. Moody, “Branch Bank Interiors.” Toronto: The Journal of the Royal Architectural Institute of Canada, ser. no. 302, vol. 27, no. 10, October, 1950, pp. 354-355.
One or two points about providing for the climate of Winnipeg. Not a basic reference, however.
Lewis Mumford, Sticks and Stones; a study of American architecture and civilisation. New York: Boni and Liveright, 1924.
An occasional reference with regard to climate is offered in this volume, but the main discourse, which is well developed and interesting, is on other matters.
C. W. Musgrave, “Some Climatic Factors that Affect Run-Off,” in U. S. of America, Department of Agriculture, Climate and Man. Washington: U. S. Government Printing Office, 1941, p. 537.
N
The Nautical Almanac. London: Her Majesty’s Stationery Office, (pub. annually).
Figures regarding the sun’s declination, etc., for various dates of the year are of use to architects.
J. L. Nayler and F. G. Woodford, “Experiments on the Most Efficient Form and Distribution of Wind Screens for Bessoneau Hangars.” (Great Britain: Advisory Committee for Aeronautics, Reports and Memoranda, No. 428.) London: Sir Joseph Causton and Sons, Ltd., April, 1918.
Fairly good account of tests on full-scale sheds and on models.
L. W. Neubauer, “The Solaranger,” Davis, California: University of California (mimeographed sheet), no date.
A good description of a method to study the positions and effect of light and shadow around farm buildings and through windows.
Richard J. Neutra, “Sun Control Devices.” Progressive Architecture. New York: Reinhold Publishing Co., October, 1946.
Informative.
New Pencil Points, February, 1944. "Sunlight Houses.” Not reviewed by author.
New York, State of (State Building Code Commission of), Code Manual for the State Building Construction Code. New York: November 1, 1951.
An attractively illustrated building code guide, with excellent type and layout Contains snow map for New York State and occasional references to other climatic influences, and problems like ground water.
The New York Times, vol. C, no. 34140, column 1. New York: Sunday, July 15, 1951.
Has vivid reports of the Kansas and Missouri flood disasters.
Arnold Nicholson, “Putting the Sun to Work.” Country Gentleman. Philadelphia: The Curtis Publishing Company, July, 1950.
“New insulating types of glass bring more light and better control of temperatures in farm buildings the year around, including free heat from the sky in wintertime,” says the subtitle.
o
Victor G. Olgyay, “The Temperate House.” Architectural Forum, the Magazine of Building. New York: Time, Inc., vol. 94, no. 3, March, 1951, pp. 179-194.
Mostly about the sun and temperatures, there is considerable data here. However, it is unfortunate that the graphs are very difficult to interpret, unless one spends a lot of time on them.
R. W. Oliver, “Beautifying the Farm Home Grounds.” Ottawa: Department of Agriculture, Dominion of Canada, no date.
Contains one or two references to windbreaks.
Svenn Orvig, “The Climate of the Ablation Period on the Barnes Icecap in 1950,” (parts in) Geografiska An- naler, vol. XXXIII, Heft 3-4, 1951, pp. 166-209.
A discussion on several pages concerning temperature profiles through ice. Interesting reading.
P
Andrea Palladio, Architecture. (Translated from the first Italian edition, printed in Venice, 1570). London: Benj’n. Cole Engraver, and John Wilcox, 1736.
An illuminating discourse of problems of architects in the sixteenth century, including many pages on the climatic influences. A “must.”
Stamo Papadaki, The Work of Oscar Niemeyer. New York: Reinhold Publishing Corp., 1950.
Among the many points brought out are the Niemeyer techniques for protecting buildings from the sun.
Alfred B. Parker, (statement included in) U. S. of America, National Research Council (Building Research Advisory Board of), Weather and the Building Industry. Washington: 1950, pp. 107-109.
A Florida architect tells what he knows about the climate.
M. Parry, “The Climates of Towns.” London: Weather, vol. 5, no. 10, October, 1950, pp. 351-356.
By an Englishman; some fine notes on climate in towns.
Sverre Petterssen, Introduction to Meteorology. New York: McGraw-Hill Book Company, Inc., 1941.
Has no direct bearing on architecture; yet this volume explains the basic knowledge of the climate in a manner that most architects will easily understand.
Rutherford Platt, American Trees.1 Book of Discovery. New York: Dodd, Mead and Company, 1952. A very good book about trees.
- V. Pleijel, “Daylight in Central Urban Areas.” Stockholm: International Commission on Illumination,
1951.
In Swedish, English, and French. A paper concerning that part of a building in a densely-built central urban area that is provided with sufficient light.
G. V. Pleijel, “Fbnster.” Stockholm: Statens Kommitte for Byggnadsforskning, 1951.
Some interesting tables concerning the lighting on surfaces and the proper dimensions for daylighting. In Swedish, but one can figure it out even without knowing the language.
G. V. Pleijel, Daylight Investigation. Stockholm: Statens Kommitte for Byggnadsforskning, (Report No. 17),
1949.
A very fine description, in English, of daylight tests conducted by Pleijel and his staff at the Royal Institute of Technology, Stockholm.
G. V. Pleijel, “Investigation Regarding Daylight and Solar Heat Radiation for the Town of Karachi, Pakistan,” Stockholm: reprinted from the Report on Central Directorate and Local Office Karachi, for the State Bank, February, 1950.
A discussion concerning the influence of the sun on the design of buildings in Karachi. Well-presented.
G. V. Pleijel, The Little Sundial. Stockholm: (no date). Sunlight and shadow studies on models of town plans, buildings, and rooms, by one of Sweden’s foremost architects.
- V. Pleijel, “Solinstrfdningenv&rfornamstaenergikalla.”
(Solar RadiationOur Greatest Source of Energy.) Byggnadsvarlden, vol. 41, no. 6, 1950, pp. 41-43. Well-presented article on this subject. A knowledge of Swedish is helpful, although not absolutely necessary.
- Plessner, Dr. Bernhard Christoph Faust’s “Plan einer
Stadt.” (1824). Gesundheitsingenieur, vol. 56, 1933, pp. 403-405.
Another German publication, good only for one or two specific references on climate and town planning.
Jesse H. Plummer, Margaret lonides, and Paul A. Siple, Thermal Balance of the Human Body and Its Application as an Index of Climatic Stress. Washington: Office of the Quartermaster General (Climatology and Environmental Protection Section, Research and Development Branch, Military Planning Division), 1945.
Quite good.
Progressive Architecture, vol. XXIX, no. 1, pp. 46-49. “Church, Negros, Philippine Islands.” New York:
Reinhold Publishing Corporation, January, 1948.
An analysis of the design by Antonin Raymond and L. L. Rado with some comments on how they considered the demands of the climate.
Progressive Architecture, Vol. XXX, no. 3, pp. 46-50. “Dormitory, Pondichery, India.” New York: Reinhold Publishing Corporation, March, 1949.
A description of Antonin Raymond’s design for this Indian dormitory, which shows so well the influence of the climate.
James Pryde, ed., Mathematical Tables. London: W. and R. Chambers, Ltd., 1923.
Contains all the tables necessary for computing sun angles. However, for all but the functions of the secant of angles, the reader is referred to a more detailed book, that by Ives.
Q
Quebec, The Civil Code.
Some obligations regarding climate, siting, and building are listed. (Run-off water, etc.)
R
J. A. Racicot, “Winter Maintenance and Ice Control.” The Canadian Engineer. Toronto: December 13, 1939. Regarding protection of highways from snow drifts, etc.
L. A. Ramdas, “Micro-Climatological Investigations in India.” Vienna: Archiv fur Meteorologie, Geophysik und Bioklimatologie (Serie B: Allgemeine und bio- logische Klimatologie, Band III), 1951.
Some general observations by the distinguished Indian scientist concerning his experiments about the microclimate. Recommended reading.
L. A. Ramdas, “The Micro-Climates of Plant Communities.” The Indian Ecologist, vol. 1, no. 1, April, 1946. The leading climatologist of India discusses the weather near the ground, illustrating his points with some original observations. Recommended reading for architects and others desirous of learning the influences of plant cover around buildings, etc.
L. A. Ramdas, “The Physics of the Bottom Layers of the Atmosphere.” Proceedings of the 35th. Indian Scientific Congress. (Part II: Presidential Address), pp. 113-151, January 3, 1948.
Original observations and data, which the author of this book has not come across anywhere else. Ramdas’ contribution to the science of microclimatology must not be overlooked.
L. A. Ramdas, “The Variation with Height of the Water Vapour Content of the Air Layers Near the Ground at Poona.” Bioklimatische Beibldlter. Braunschweig: Druck und Verlag von Friedr. Vieweg & Sohn, 1938. Quite interesting, especially the discussion on the effect of seabreeze.
L. A. Ramdas and M. S. Katti, “The Diurnal Variation of Moisture in the Soil during the Clear Season.” Current Science, vol. 3, no. 12, June, 1935, pp. 612- 613.
Not of direct interest to architects.
Charles George Ramsey and Harold Reeve Sleeper, Archi- leclziral Graphic Standards. New York: John Wiley and Sons, 4th ed., 1951.
One of the standard architectural reference books, this new edition contains some data on sun angles, lightning conductors, etc.
M. N. Rao, “Comfort Range in Tropical Calcutta.” (Industrial Health in India, Series No. 18.) Calcutta: All India Institute of Hygiene and Public Health,
1950.
The human approach to comfort is studied here, although recognition is made of the standard scientific methods. Recommended.
Antonin Raymond, Architectural Details. Tokyo: Antonin Raymond Seisho-Kwan 4- Chome Ginza, Kyobashi- Ku, 1938.
Pages 1 and 2 are devoted to an analysis of Japan’s climate as it affects architecture. Presented on fine-textured paper, printed in Japan.
Hans and Gret Reinhard, Methode fur Besonnungsbestim- mung.” Werk. Zurich: vol. 36, no. 3, March, 1949, pp. 72-74.
Although the main text is in German, there are English and French summaries in front. It describes a new method for measuring sun exposure. Quite good.
A. -Augustin Rey, La science des plans de villes. Paris: Justin Pidoux and Charles Parde, Dunod, 1913.
Sun diagrams for the latitude of Paris. Very complete. In French.
Arthur C. Ringland and Otto E. Guthe, “Land Use in Flood Control,” in U. S. of America, Department of Agriculture, Climate and Man. Washington: U. S. Government Printing Office, 1941, p. 562.
M. Roche, “Designs for All-Year Sun Control. New York Times Magazine, August 7, 1949, pp. 64-65.
A popular article about the sun and buildings.
Tyler Stewart Rogers, Design of Inszdaled Bziildings for Variozis Climates. New York: F. W. Dodge Corporation, 1951.
A thin, attractive volume concerning the influence of climate on the selection of building materials.
Isadore Rosenfield, “Germicidal Light in Classrooms.” Toronto: Jozirnal of the Royal Architeclzzral Institute of Canada, ser. no. 278, vol. 25, no. 10, October 1948, pp. 351-357.
Much information about sun control by America’s leading hospital architect.
Graham Rowley, “Snow House Building.” Cambridge: The Polar Record, no. 16, July 1938.
Exact description of how to construct an igloo.
R. Ruedy, Heat Loss Through Windows. Ottawa: National Research Council of Canada. (Publication no. 1227.) (No date.)
A summary of available information. Good bibliography too.
s
Alberto Sartoris, Encyclopedic de I’Architecture Nouvelle: Ordre el Climal Mediterraneens. Milan: Ulrico Hoepli, 1948.
Not very much about climate, although worth a glance or two.
Walter Schwagenscheidt, Vergleichende Besonnungsunter- szichungen. (Comparable Examination for the Orientation of Dwellings.) Beilage zu Heft der Zeitschrift “Das Neue Frankfurt.” April, May, 1930.
A very exact interpretation of sun angle requirements for dwellings under specific circumstances. In German, French, and English, it is very complicated.
Elwyn E. Seelye, Data Book for Civil Engineers. New York; John Wiley and Sons, 1951.
The section on hydraulics (p. 500 ft) discusses methods for designing ditches, sewers, etc., to accommodate expected precipitation run-off.
Jose Luis Sert, Can Our Cities Survive.- Cambridge: The Harvard University Press, 1942.
Considerable space devoted to sun, smoke, winds, orientation, etc., in planning.
Maron J. Simon, ed., Your Solar House. New York: Simon and Schuster, 1947.
A popular analysis of the solar house problem, with a house plan for each of the 48 states and the District of Columbia.
Joseph W. Simons and Frank B. Lanham, “Factors Affecting Temperatures in Southern Farmhouses.” U. S. of America, Department of Agriculture (Technical Bulletin No. 822). Washington: U. S. Government Printing Office, July, 1942.
Very good report. Recommended reading.
Paul A. Siple, “Adaptation of the Explorer to the Climate of Antarctica.” (Clark University, unpublished thesis, 1939.)
Should be good reading. The author has not read it.
Paul A. Siple, “Climatic Criteria for Building Construction,” in U. S. of America, National Research Council (Building Research Advisory Board of), Weather and the Building Industry. (Research Conference Report No. 1.) Washington: 1950.
Very good reading.
Paul A. Siple and Charles F. Passel, “Measurements of Dry Atmospheric Cooling in Subfreezing Temperatures.” Philadelphia: Proceedings of the American Philosophical Society, vol. 89, no. 1, April, 1945, pp. 177-179.
Relative comfort thermometer, heat loss of the body, etc., discussed by these researchers with specific reference to conditions in the Antarctic.
Elmer G. Smith, The Feasibility of Using Models for Predetermining Natural Ventilation. (Research Report No. 26.) College Station, Texas: Texas Engineering Experiment Station, The Texas A. and M. College System, 1951.
Worth investigating by all interested architects. Extremely good.
Elmer G. Smith, Bob H. Reed, H. Darwin Hodges, The Measurement of Low Air Speeds by the Use of Titanium Tetrachloride. (Research Report No. 25.) College Station, Texas: Texas Engineering Experiment Station, The Texas A. and M. College System, May,
1951.
The title is self-explanatory. This is an original method worthy of note.
Hubert R. Snoke and Leo J. Waldron, Survey of Roofing Materials in the Northeastern States. U. S. of America, Department of Commerce (National Bureau of Standards of), Building Materials and Structures Report BMS 29. Washington: U. S. Government Printing Office, October 11, 1939.
Hubert R. Snoke and Leo J. Waldron, Survey of Roofing Materials in the South Central States. U. S. of America, Department of Commerce (National Bureau of Standards of), Building Materials and Structures Report BMS 84. Washington: U. S. Government Printing Office, May 5, 1942.
Hubert R. Snoke and Leo J. Waldron, Survey of Roofing Materials in the Southeastern Slates. U. S. of America, Department of Commerce (National Bureau of Standards of), Building Materials and Structures Report BMS 6. Washington: U. S. Government Printing Office, November 4, 1938.
Leon C. Snyder, “Landscaping the Farmstead.” St. Paul: University of Minnesota, U. S. Department of Agriculture, Agricultural Extension Service (Extension Bulletin 250), May, 1950.
Farmstead layout with regard to the sun, winds, odors, etc.
Harold Spence-Sales, How io Subdivide. Ottawa: Community Planning Association of Canada, 1950.
Planning for sunlight and daylight in the layout of housing developments; framed in a colorful format.
Robert G. Stone, “On the Practical Evaluation and Interpretation of the Cooling Power in Climatology.” Bulletin of the American Meteorological Society, vol. 24, nos. 8 and 9, 1943.
Quite interesting.
Sweden, Kungl. Tekniska Hogskolan (Royal Institute of Technology), Kompendium I Stadsbyggnad. (Textbook of Town Planning.) Stockholm: 1948.
Has English summaries. Clean-cut diagrams, mostly about the sun’s influence on planning. Recommended.
T
Maria Telkes, “A Review of Solar House Heating.” Healing and Ventilating, September, 1949, pp. 68-74.
Telkes’ work described by herself. Definitely suggested reading.
Maria Telkes and Eleanor Raymond, “Storing Solar Heat in Chemicals.” Heating and Ventilating, reference section, November, 1949, pp. 80-85.
A summary of the solar work on Telkes’ own house in Dover, Massachusetts.
M. A. Thorfinnson, Wind Erosion Control. St. Paul: University of Minnesota, Agricultural Extension Service, U. S. Department of Agriculture, (Extension Bulletin 235). October, 1948.
C. W. Thornthwaite, “An Approach Toward a Rational Classification of Climate.” Geographical Review. New York: vol. 38, no. 1, 1948, pp. 55-94.
Here is described what is probably the most adequate climatic classification system in the world today. Not of direct interest to architects, but indispensable to climatologists and geographers.
C. W. Thornthwaite, “Problems in Classification of Climates.” Geographical Review. New York: vol. 33, 1943, pp. 233-255.
Not of direct interest to architects, but of value to those engaged in advanced climatological research.
Ramsey Traquair, The Old Architecture of Quebec. Toronto: The MacMillan Co. of Canada, Ltd., 1947, vol. 1. Colorful account of the ancient construction practices in this province.
u
United Nations (Housing and Town and Country Planning Division of), Housing in the Tropics. (Bulletin 6.) United Nations, New York, June, 1952.
An excellent book on all matters of tropical housing, it also contains an extensive bibliography.
United States of America, Department of Agriculture, Climate and Man. Washington: U. S. Government Printing Office, 1941.
Indispensable handbook for all interested in this field. Unfortunately, it is now out of print.
United States of America, Department of Commerce, Library and Reports Division, Office of Technical Services of, Report PE-25375. Washington, D. C. A description of solar house research at the University of Denver, Colorado.
United States of America, Department of Commerce, (National Bureau of Standards of), Code for Protection Against Lightning. Washington: U. S. Government Printing Office, 1944.
A straight-forward account of the principles involved in and the requirements for protection against lightning.
United States of America, Department of Commerce, (Weather Bureau of), Climatological data, National Summary. Washington: U. S. Government Printing Office, published monthly.
Not good for averagesgives only monthly records of a particular month.
United States of America, Department of Commerce, (Weather Bureau of), Local Climatological Summary. (Issued for various cities in the USA.) Washington: published annually.
For those desiring climate records of a particular city or town.
United States of America, Department of Commerce, (Weather Bureau of), Normal Surface Wind Data for the United Stales. Washington: 1942.
Charts of average hourly wind velocity and prevailing direction, wind-rose data, and wind-velocity readings for different hours of the day.
United States of America, Department of Commerce, (Weather Bureau of), Temperatures al Selected Stations in the United Stales, Alaska, Hawaii, and Puerto Rico. (Technical Paper No. 9.) Washington: U. S. Government Printing Office, December, 1948. Statistics of United States weather here recorded.
United States of America, Department of the Interior, (Housing Authority of), Planning the Site. (Bull, no. 11). Washington: U. S. Government Printing Office, 1939.
Page 26 offers a few remarks on problems of orientation in the design of low-rent housing projects.
United States of America, National Research Council (Building Research Advisory Board of), Weather and the Building Industry. (Research Conference Report No. 1.) Washington: 1950.
Comments on this subject by leading authorities in professional, industrial, educational, and governmental circles. Excellent bibliography.
United States of America, Navy Department (Hydrographic Office of), “Pilot Chart of the Central American Waters.” Washington: June, 1952.
Published monthly, this particular chart, and that for May, 1941, have on their reverse sides a diagram for solving navigational problems. This is useful for determining the altitude and azimuth of the sun.
United States of America, War Department (Office of the Quartermaster General, Climatic Research Unit of), “Table of Wind Chill Values.” Washington: January 1943.
Comparisons of different combinations of wind speeds and temperature can be made easily from these tables. For applications to the human body only.
V
A. Hyatt Verrill, The American Indian. New York: New Home Library, 1934.
Quite a few allusions to climate and the methods the Indians have of accounting for it in their living habits.
E. E. Vezey, The Feasibility of Using Models for Predetermining Natural Lighting. (Research Report No. 21.) College Station, Texas: Texas Engineering Experiment Station, The Texas A. and M. College System, Janary, 1951.
A very well-presented description of the above subject. These researchers seem to be a step ahead of everyone else in North America, although much work along this line has been done in Sweden.
Vitruvius, (trans, by Frank Granger), On Architecture. (FromHarleian MS. 2767.) London: William Heinemann, Ltd., 1931.
A wealth of historical thought on planning with the climate is contained herein.
w
Percy Waldrum, “The Orientation of Buildings.” London: Journal of the Royal Institute of British Architects, vol. 40, 3rd. series, November 12, 1932, pp. 23-24. A letter by Waldrum to the Journal.
John Walker, Planning and Planting Field Shelterbelts. Ottawa: Dominion of Canada Department of Agriculture (Publication 785, Farmers’ Bulletin 139). December, 1946.
A good authority for shelterbelt planning.
Webster’s New Collegiate Dictionary, Springfield: G. and C. Merriam Co., 1949.
The standard lexicographical authority for this book.
Kenneth C. Welch, “Indoor-Outdoor Living.” Illuminating Engineering, vol. XLVII, no. 6, pp. 297-299. New York: Illuminating Engineering Society, June,
1952.
A description by the architect-owner of a very nice climatically- designed house in Grand Rapids, Michigan. Emphasis placed here on lighting problems.
West Midland Group on Post-War Reconstruction and Planning, Conurbation, A Planning Survey of Birmingham and the Black Country. London: The Architectural Press, 1948.
Chapter X on Smoke Pollution (pp. 153-158) is particularly interesting, but the entire book is well presented, with fine clean-cut illustrations.
Arnold Whittick, European Architecture in the Twentieth Century. London: Crosby Lockwood and Son, Ltd., 1950.
Discusses early-modern attempts to conform to the climate when designing buildings.
Arnold Whittick, (in collab. with Johannes Schreiner): The Small House: Today and Tomorrow. London, Crosby Lockwood and Son, Ltd., 1947.
Contains some interesting points on orientation (pp. 59-62, 142, 155-156, 160, 170, 174, 202), on trees for shade purposes (pp. 62, 123, 158, 160, 169), and on smoke pollution (pp. 60, 90, 91, 208).
Julian Whittlesey, “Building Type Serves a Five-Fold Purpose." Architectural Record, vol. 105, no. 2. pp. 124-128. New York: F. W. Dodge Corp., Feb. 1949. Problems of creating cross-ventilation in apartment-building design are discussed in part of this very interesting paper.
Julian Whittlesey, “New Dimensions in Housing Design.” Progressive Architecture, vol. XXXII, no. 4, pp. 57- 68. New York: Reinhold Publishing Corporation, April 1951.
An appraisal of Chicago’s multistory public-housing projects with several interesting points concerning the orientation of the buildings and dwelling units.
Paul Lester Wiener and Jose Luis Sert, “Conditions Generales de 1’Urbanisme en Amerique Latine.” Paris: LArchitecture dAujourd hui, no. 33, December, 1950, January, 1951.
Numerous references about planning cities climatically in South America. In French.
C. -E. A. Winslow and L. P. Herrington, Temperature and Human Life. Princeton: Princeton University Press, 1949.
A fine description of the heat requirements of the human body, methods of air conditioning, and the influence of climate and season on health.
F. G. Woodford and G. N. Pell, “The Variation in the Wind above an Airship Shed, Due to the Presence of the Shed.” (Great Britain, Advisory Committee for Aeronautics.) London: Sir Joseph Causton and Sons, Ltd., March, 1918.
Wind data discussions with reference to a particular situation.
Frank Lloyd Wright, Genius and the Mobocracy. New York: Duell, Sloan and Pearce, 1949.
Not much about the climateonly nature in general. Poetic quality of Wright’s text makes interesting reading.
H. Myles Wright, The Planners Notebook. London: The Architectural Press, 1948.
Pages 32 and 33 contain some statistics on climate in England, supposedly all the climatic information that an architect needs. One should not, however, fall into this pitfall.
E. Wuhrmann, “Bestimmung der Sonnenbestrahlung.” Schweizerische Bauzeilung. (Revue Polytechnique Suisse.) Zurich: vol. 69, no. 20, May 19, 1951, pp. 281-283.
About sun angles and orientation; in German.
R. E. Wycherley, How the Greeks Built Cities. London: MacMillan and Co., Ltd., 1949.
An occasional mention of climate and how the ancient Greeks provided for it in their town planning.
Donald Wyman, Trees for American Gardens. New York: MacMillan Company, 1951.
A fine volume about trees. One can choose from this those species which, for example, one might wish for shade purposes.
z
Raphael Zon, “Climate and the Nation’s Forests.” in U. S. of America, Department of Agriculture, Climate and Man. Washington: U. S. Government Printing Office, 1941, pp. 477-498.
¶ Credits
The author is indebted to all those kind people who assisted in the production of this book. Special thanks are given to the authors and publishers, listed in the bibliography, who granted permission to use material from their books and articles and to those who supplied photographs. The author wishes to express his thanks also to the highway departments of the states of California, Indiana, Maine, Montana, New York, Oregon, Pennsylvania, and Washington; to the Texas Engineering Experiment Station; to Tecton Architects; to the San Francisco Chronicle, to the Independent Protection Company, Inc.; and to the Honorable Edmond Cloutier, Queen’s Printer and Controller of Stationery, Ottawa, Canada.
Below are the credits for the illustrations used in this book, listed according to figure number.
     Canon Webster                                *gation,* Stockholm: Swedish                                              The Museum of Modem Art,
     Bureau of American Ethnology                 State Committee for Building                                              New York
     Louisiana State Museum                       Research, 1949.                                                           *The Work of Oscar Niemeyer,*
     British Information Services                 Dr. L. W. Neubauer                                                        edited by Stamo Papadaki, New
, 8 Japan Travel Bureau -37 Gunnar Pleijel, Daylight Investi York: Reinhold Publishing Cor
Government of India Information gation, Stockholm: Swedish poration, 1950.
Services State Committee for Building Julius Shulman, photographer
Norwegian Official Photo Research, 1949. L. D. Jones, photographer
Swiss National Travel Office -40 William Lescaze, architect , 102 Bermuda News Bureau
, 13 British Information Services R. W. Justice , 107 © Ezra Stoller, photographer
Victor and Aladar Olgyay Libbey-Owens-Ford Glass Co. Ulric Meisel, photographer
Nationalmuseet, Copenhagen , 47 Geoffrey Baker and Bruno Funaro, -118 Kenneth C. Welch, architect
Rudolf Geiger, The Climate Near Windows in Modern Archi -123 Richard J. Neutra, architect
the Ground, Cambridge: Har tecture, New York: Architectural -128 Johns-Manville Photo
vard University Press, 1950. Book Publishing Company, 1948. -135 The Lighting Committee of the
, 18 The Lighting Committee of the , 50 Gunnar Pleijel, Daylight Investi Building Research Board of the
Building Research Board of the gation, Stockholm: Swedish Department of Scientific and
Department of Scientific and State Committee for Building Industrial Research, The Light
Industrial Research, The Light Research, 1949. ing of Buildings, London:
ing of Buildings, London: Norwegian National Travel Office His Majesty’s Stationery Office,
His Majesty’s Stationery Office, Swiss National Travel Office .
. C. Brandt, photographer Gottscho-Schleisner, photographers
R. W. Justice French Government Tourist Office Le Corbusier, U. N. Headquarters,
Louis H. Dreyer, photographer -57 Joseph W. Molitor, photographer New York: Reinhold Publishing
Kayess Enterprises, Chart No. © Ezra Stoller, photographer Corporation, 1947.
, Copyright 1950, K. R. San Francisco Chronicle -146, United States Department of
Spangenberg. , 149, Commerce, Weather Bureau,
-68 Libbey-Owens-Ford Glass Com
, 24 Gunnar Pleijel, Textbook of Town Climates of the United Slates,
Planning, Royal Institute of pany Washington: U. S. Government
Kenneth C. Welch, architect
Technology, Stockholm Printing Office. 1941.
Antonin Raymond, Architectural Hewer’s Studio, photographers , 152 Frank V. Dowd
Details, Tokyo: Antonin Hedrich-Blessing, photographers Bulletin of the .4.1. A., September,
Raymond, Seisho-Kwan 4- © Ezra Stoller, photographer .
Chome Ginza, Kyobashi-Ku, -157 Rudolf Geiger, The Climate Near
. Peter Sekaer, photographer the Ground, Cambridge: Harvard
U. S. Navy Hydrographic Office, V. Furno, delineator University Press, 1950.
Washington, D. C., 1952. Arquileclura, Madrid, No. 9, 1929 -160 National Research Council. Build
, 28 Geoffrey Baker and Bruno Funaro, Bauwelt, Berlin, No. 40, 1931 ing Research Advisory Board
Windows in Modern Archi Brazilian Government Trade Weather and The Building In
tecture, New York: Architectural Bureau dustry
Book Publishing Company, 1948. ,95 Antonin Raymond and L. L, Rado Hedrich-Blessing, photographers
-31 Gunnar Pleijel, Daylight Investi- G, E. Kidder Smith, photographer. Progressive Architecture
+:-------+:-------------------------------------------------------------+:-------+:-----------------------------------------------------------------------------------------+:-------------------------------+:-------------------------------------------------------+
| | Sketch by Raymond and Rado | | | Swedish National Travel Office | |
±-------±-------------------------------------------------------------±-------±-----------------------------------------------------------------------------------------±-------------------------------±-------------------------------------------------------+
| , 165, | Rudolf Geiger, The Climate Near | | Printing Office, 1941 | -247 | Weather Bureau, United States |
±-------±-------------------------------------------------------------±-------±-----------------------------------------------------------------------------------------±-------------------------------±-------------------------------------------------------+
| 168 | the Ground, Cambridge: Harvard University Press, 1950. | , 189 | Rudolf Geiger, The Climate Near the Ground, Cambridge: Harvard University Press, 1950. | , 253 | Department of Commerce Maintenance Organization, Cali |
| | | | | | |
| | L. A. Ramdas, Micro-Climatological Investigations in India | 190 | C. E. P. Brooks | 254 | fornia Division of Highways Pennsylvania Department of |
| | | | | | |
| | | | | | Highways |
±-------±-------------------------------------------------------------±-------±-----------------------------------------------------------------------------------------±-------------------------------±-------------------------------------------------------+
| | Bermuda News Bureau | , 192 | J. Nelson Spaeth | -258 | George Jacobsen, photographer |
±-------±-------------------------------------------------------------±-------±-----------------------------------------------------------------------------------------±-------------------------------±-------------------------------------------------------+
| 171 | British Overseas Airways Corporation | | Bernhard Haurwitz and James M. Austin, Climatology, New York: McGraw-Hill Book Com | 260 | Japan Travel Bureau |
| | | | | | |
| | Kenneth C. Welch, architect | | | | Associated Screen News Ltd., photographers |
±-------±-------------------------------------------------------------±-------±-----------------------------------------------------------------------------------------±-------------------------------±-------------------------------------------------------+
| | American Society of Heating and | , 197, | pany, Inc., 1944. | , 263 | Ketchum, Gini and Sharp, architects |
| | | | | | |
| | Ventilating Engineers | | Architectural Review | | |
±-------±-------------------------------------------------------------±-------±-----------------------------------------------------------------------------------------±-------------------------------±-------------------------------------------------------+
| -175 | Minneapolis-Honeywell Regulator | | | | Fay Foto Service |
±-------±-------------------------------------------------------------±-------±-----------------------------------------------------------------------------------------±-------------------------------±-------------------------------------------------------+
| | Company | -201 | Julius Shulman, photographer | | J. Alex Langley, photographer |
±-------±-------------------------------------------------------------±-------±-----------------------------------------------------------------------------------------±-------------------------------±-------------------------------------------------------+
| , 177 | L. D. Jones, photographer | -206 | Texas Engineering Experiment | | L. D. Jones, photographer |
±-------±-------------------------------------------------------------±-------±-----------------------------------------------------------------------------------------±-------------------------------±-------------------------------------------------------+
| | Sverre Petterssen, Introduction to | | Station | , 276 | Advertising Department, A. M. |
| | | | | | |
| | Meteorology, New York: Mc | | George Jacobsen, photographer | | Byers Company |
±-------±-------------------------------------------------------------±-------±-----------------------------------------------------------------------------------------±-------------------------------±-------------------------------------------------------+
| | Graw-Hill Book Company, Ina- | -215 | Town Planning Associates, architects | , 278 | Oregon State Highway Commission |
| | | | | | |
| | 1941 | | | | |
±-------±-------------------------------------------------------------±-------±-----------------------------------------------------------------------------------------±-------------------------------±-------------------------------------------------------+
| ,181 | The New York Times | | Netherlands Information Service | | Associated Press Photo |
±-------±-------------------------------------------------------------±-------±-----------------------------------------------------------------------------------------±-------------------------------±-------------------------------------------------------+
| | Rudolf Geiger, The Climate | | Press Information Bureau, Government of India | -284 | Winnipeg Free Press |
| | | | | | |
| | Near the Ground, Cambridge: | | | 285 | Netherlands Information Service |
±-------±-------------------------------------------------------------±-------±-----------------------------------------------------------------------------------------±-------------------------------±-------------------------------------------------------+
| | Harvard University Press, 1950. | -228 | Matthew Nowicki | | Associated Press Newsphoto, Wide |
±-------±-------------------------------------------------------------±-------±-----------------------------------------------------------------------------------------±-------------------------------±-------------------------------------------------------+
| | Raphael Zon, Climate and Man, | -235 | Town Planning Associates | | World Photos |
±-------±-------------------------------------------------------------±-------±-----------------------------------------------------------------------------------------±-------------------------------±-------------------------------------------------------+
¶ Index
Aberdeenshire, Scotland 151
Adiabatic lapse rate, dry 134, 137
Adirondacks 239
Adriatic Sea 211
Agra, Italy 100
Airchitecture, defined ix
Aircraft 164
Airfields 144, 228, 260
Air flow, around buildings 196
around hills 196
down slopes 151ff
smoke analysis 199
Akita, Japan 251
Albedo lOOff
Alberta 118,135,195,211,245
Aldridge, Henry R. 10, 16, 17
Alaska 4
Algiers 83, 84, 86
Alps 135
Altitude, sun 48
Altitudes, and precipitation 239
and temperatures 134
and wind 181, 182, 186, 187
Aluminum City, Pennsylvania 112, 113
Aluminum Company of Canada 218
Aluminum foil insulation 164, 165
Amazon River 221
Andes 224, 239
Anderson, E. J. 94, 98
Anderson, Lawrence B. 66
Anderson, Parker 191, 194, 245
Anderson, Richard 272
Anemometer, cup 178, 186, 187
portable 177, 178
Anglo-Egyptian Sudan 21
Anticyclones 179
Apartments 216
Appalachians 246
Arakawa, H. 161
Arcades 253
Arctic 205, 228
Aristotle 9, 10, 20, 211
Arizona, 20, 66
Artificial sky, American 44
Australian 39,43
Swedish 44, 45, 46
Arvika, Sweden 42
Asbestone 105
Asbestos-cement boards 105
Asphalt, temperatures over 143, 145
Assiniboine River 265
Associazone Sanatorio Universitario Italiano
100
Athletic buildings, sun orientation 65
Atlantic Beach, New York 102, 103
Atomic warfare 213
Auburn, Maine 62, 63
Auditoriums, sun orientation 64, 65
Austen, Jane 88
Austin, James M. 184, 196
Australia 22, 39, 40, 43
Austria 17, 151, 153, 211, 269
Avalanches 240
Awnings 90ff
Azimuth, sun 47
Bacteria 213
Baird, P. D. 3, 169
Baker, Geoffrey 38, 57
Baker Lake, N.W.T. 251, 255
Baldock, R. H. 243
Banks 25
Barcelona 83, 84
Bams 68, 69, 70, 71
Barrot and Blackader 253
Bartels, J. 146
Beaufort, Admiral 176
Belgium 158
Bellomy 44
Berger, Arthur 91
Berlin, Germany 160, 269
Bermuda 90, 164
Bernard, Merrill 268
Besant, Sir Walter 16
Best and Company 260, 261
Bibb Brothers 91
Bible 10
Bibliography 282ff
Bilby, J. W. 3
Bland, John 53
Black Mountain College, North Carolina 105
Blackwell, Oklahoma 199, 200
Blinds, asbestos 86
canvas 89
jalousie 89,90
Venetian 88, 90, 93, 103
wooden 90, 91
Blucher and Naismith 80
Bogota, Colombia 208, 209, 221
Bombay, India 153
Boston, Massachusetts 66, 98
Boyce, J. H. 146
Brabham, G. W. 163
Braemar, Aberdeenshire 151
Brazil 84, 86, 88, 90, 91, 221
Brazilian Press Association Building (A.B.I.) 86
Breathing wall 208, 209
Breuer, Marcel 112
Brezina, Ernst 212
Brise soleil 83ff
British Building Research Board 106
British Columbia 118, 218
British Columbia, University of 205
British Honduras 21
British Isles (see England, etc.)
British Ministry of Works 109
Brocks, K. 137
Brooks, C. E. P. 104, 142, 151, 152, 153,
158,163,166,186,190,192,210.256,258
Brooks, Charles F. 26
Bruce, W. 164
Brunt, David 140, 141, 142, 143, 152, 182
Buckley, James C. 214
Buffalo, New York 255
Burnett, P. W. 28, 30
Bush, Raymond 177, 183, 256
Bushnell, David I., Jr. 5
Byers, A. M. 260, 261
Cali, Colombia 221
California 62, 67, 68, 88, 243, 244, 245, 264
California, University of 43
Calm, area of 205
Canada, native architecture 3ff
Canada, Department of Trade and Commerce 117
Department of Transport, Meteorological Division 119
Canadian Pacific Railway 226
Canadians, French 6ff
Cape Charles, Virginia 255
Cape Cod, Texas 199
Caracas, Venezuela 31, 208, 209
Careystone 105
Caribbean 208
Carthage 83
Castellani, Sir Aldo 104
Catechumens 10
Caudill, W. W. 44, 199, 200
Caudill, Rowlett, Scott and Associates 44, 199, 200
Cave, A. E. 17
Central America, native and colonial architecture 9ff
Champlain 6
Chandigarh, India 213-219
Chapel 100
Chicago, Illinois 66, 130, 131
Chickens 280
Chimbote, Peru 221, 224
Chimneys 206
China, native architecture 17, 18, 257
Chinook 135
Church 65, 207, 208, 221, 222, 255
Churchill, Manitoba 249, 250
C.I.A.M. 106
Cidade dos Motores, Brazil 221, 223, 224
Cincinnati, Ohio 82, 83
City planning governed by sun 112ff
Clark University 169
Clerestory 64, 207
Cloudbursts 262
Clouds 226ff
effect on temperature 135
influence on sun 55
radioactive 213
Cocke, Bartlett 80, 81
Coddington, A. A. 53
Coffey, Clara 214
Cohen, I. Bernard 273
Cold waves 124
College Station, Texas 199
Colley, Richard 80. 82
Collinson, Peter 272
Colombia 107, 208, 209, 221, 222, 224
Color 105, 106
of soils, influence on temperatures of
142
and temperatures 163ff
Commercial Pacific Cable Company 148
Concrete, temperatures over 145
Corcula. Dalmatia 211
Comfort Chart, A.S.H.V.E. 167, 168
Community centers, sun orientation 65
Conclusion 279ff
Condensation 71, 276, 277
Confucius 114
Congres Intemationaux d’Architecture Mo- deme, le 106
Connaughton, C. A. 149, 188, 192, 246,
247, 248
Cooling 16811
by evaporation 239
Copenhagen, Denmark 204
Copper Basin, Tennessee 149
Coppermine, N.W.T. 3
Cornell University 171
Comer Brook, Newfoundland 171
Corpus Christi, Texas 80, 82
Costa, Lucio 84
Court, Arnold 170
Cram, Ralph Adams 18
Creole offices 31
Cultivation of land 241
Curacao, Netherlands West Indies 91, 92
Cyclones 179
tropical 207
Dalibard 272
Dalsimer, Allan 94, 95, 98
Dampness 239
Davis, J. E. 192, 195
De Brito, Saturnino Nunes 90
De Buffon, Count 272
Declination, sun 48
Degree days 128, 130, 131
Delos, house orientation 11
Denmark 23, 189, 190, 204, 205
Denver, University of 76
De Perthuis, M. 16
Desranleau, J. M. 61
Detroit, Michigan 212, 255, 277, 278
Dew point temperatures 130-131, 132
Diamond, Jack 91, 92
Dickens 106
Dickson, Delphine 171
Dikes 265, 266, 267, 268
Diurnal variation of precipitation 240
Dog house, solar 67, 68
Dominican builders 10
Donora, Pennsylvania 159
Door Peninsula, Wisconsin 183
Doors 3, 4ff, 7, 10, 18
Doorsills 260
Dorval, P.Q. 55, 155, 162, 197, 198
Douglas Hall, McGill University 153, 159
Douglass, Lathrop 31
Dover, Massachusetts 74, 75
Dowd, Frank V. 126, 127, 128
Downslope winds 152, 182ff, 216, 218
Drains 231
Dravid, R. K. 141
Drifting sand 206
Driveways 260
Drought, Frank P. 80
Dukes, Michigan 188
Duquesne Club, Pittsburgh 261
Dust whirls 137
Eakin, W. Everett 66, 71
East Pekham, Kent, England 142
Eaton, G. S. 143
Eaves 7, 17, 18
Eckbo, Garrett 94
Ecuador 135
Eddies 198, 205, 206, 212
Edificio Continental, Mexico, D. F. 93
Effective temperature 166, 167
Egypt 10, 16, 148
Egyptians 105
Eiffel, G. 204, 205
Eiffel Tower 182
Elarth, Herschel A. 72, 73
England 10,11,16,17,22,39, 113,137,142, 151, 211, 227, 253, 270, 272
Englewood, New Jersey 78, 79
Enkhuizen, Holland 268
Erie County, Pennsylvania 244, 245
Eskimos 3fif, 256
Evaporation 240, 277
cooling by 146, 147, 148, 208
Evelyn, John 16
Everetts, John Jr. 148, 166
Everlin, Ralph 214
Factories, orientation 26
Falckenberg 103
Far East 17
Farm orientation 211
Findlay, Robert 253
Fitch, James Marston 8, 66, 145, 159
Fletcher 6
Floods 221, 239, 242, 260, 262, 265ff
Florida Everglades Indians 5
Fog 158, 159, 160, 213, 227-229, 269, 270 diurnal variation of 240
Fohn 135
Ford, O’Neil 79, 80, 81, 91, 92, 199
Forests, effect on precipitation 246-248 influence on wind 187ff temperatures in 149
Forsling, C. L. 247
Fort Read, Trinidad 210
Framingham, Massachusetts 254
France 16,22,60,114,270,272
Frankfurt, Germany 270
Franklin, Benjamin 272, 273
Freeze-thaw cycle 124, 139
Frost, change 126
dates of last and first 124, 125 and gardens 152, 153 hollows 152
mountain, as observed by Jefferson 8 penetration 126, 128
Fry, E. Maxwell 218
Funaro, Bruno 38, 57
Gaitan, J. 208, 209
Galbestos 105
Gardens and frosts 152, 153
Gases, war 213
Gasoline ignition and fog dispersal 228
Gay 116
Geiger, Rudolf 57, 58, 100, 102, 103, 126, 137-139, 141-144, 146, 149-151, 153, 157, 158, 184, 185-190, 192, 206, 230, 246, 256, 280
Geller, A. W. 78, 79, 90, 91
Geostrophic wind 180
Germany 15, 25, 128, 144, 153, 160, 161, 190, 211, 212, 269, 270
Gibbs, R. D. 94
Giri, M. 265, 269
Glass, double 66
Glass, M. Milton 214, 218
Glencoe, Illinois 74
Glenview, Illinois 73
Goodwin, Philip 88
Gookin, Daniel 5
Goose Bay, Labrador 20
Goshen, Indiana 274
Goteborg, Sweden 42
Grand Banks, Newfoundland 228
Grand Ranids, Michigan 72, 73, 96, 97
Granger, Frank 11
Granite 139
Grant, Peter 5
Graphic solarmeter 53, 54
Grasberg, Gabriel 160
Grass 146
temperatures over 142
roofs 186, 187
Gravel bed foundation 249, 250
Great Britain (see England, etc.)
Great Lakes 257
Greeks 105, 272
Green belts 213, 216, 221, 224
Greenwich Observatory 49
Gregory the Great 10
Gropius, Walter 112, 113
Guam 148, 207
Gulf States, Indians 5
Gusts, wind recorder 178
Guthe, Otto E. 241
Gutters 15, 227, 231, 260
street 10, 16
Hail 227, 239, 247
storms 237
Hamberg, H. E. 150
Hamilton, Bermuda 164
Hamlin, Talbot 8, 257
Handisyde, C. C. 67
Hanover, Germany 144
Harada, Jiro 17
Hare, F. Kenneth 3, 134, 135, 162, 163, 168, 176, 226, 240, 250
Harriman, Alonzo J. 62, 63
Harrison, Mr. and Mrs. Samuel L. 88
Hart, Leslie J. 83
Harvard University 26
Haurwitz, Bernhard 185, 196
Hawke, E. L. 151
Heat, bins 74, 75, 76
waves 124
Heliodon 39, 40, 111
Hellman, G. 139
Henderson, David G. 266
Hennessey, Syska 83
Henry II 16
Hertfordshire, England 151
Hewlett, New York 95
Hewlett Neck, New York 91, 92
Highways 227, 260, 263
frost depth under 127
snow fences 243ff
Hilberseimer, L. 211
Hill, Sir Leonard 168
Hills, air flow around 196
precipitation around 230
Himalayas 239
Hinchberger, C. C. 80
Hindu architecture 20
Hixon, F. C. 91
Hoglsenomrade, Arvika, Sweden 42
Holland 210, 267, 268
Home for the Jewish Aged, Kansas City,
Missouri 89
Honshu, Japan 251
Hospitals 64, 65, 100, 102, 260
Hottel, H. C. 77
House Beautiful 31
Housing and Home Finance Agency, U.S.A.
23
Housing layouts, governed by sun 106ff
Hoyt, Homer 83
Hudson Bay 249
Humidity 166, 167, 226, 276ff
Huron, Lake 5
Hurricanes 207
Hursh, C. P. 149, 188, 192, 246, 247, 248
Huston Elementary School 200
Hutchison, F. W. 67
Ice 227
Icicles 257, 260
Icy roads, treatments for 263ff
Igloos 3ff, 256
Illinois 66, 73, 74, 75, 130,131, 145, 147,195
Illinois Institute of Technology 66
Illinois, University of 194,211
Illumination, igloo 3
Independent Protection Company, Inc. 274 India 18, 19, 22, 86, 87, 133, 138, 141, 142, 147, 153, 213-219, 229
Indiana 67, 244, 264, 274
Indians, North American 3ff
Industry, orientation of 213, 218, 221
Infrared lOOff
Institute of Inventive Research 80
Insulation 60
Inversions, temperature 159
Irminger, J. O. V. 189, 204
Isotherm charts 1180
Israel 229
Italy 110, 100
Jacobsen, George 3, 171, 205, 206, 250, 251, 255
Japan 17-19, 84-87, 93, 161, 251, 252
Jeanneret, Pierre 218
Jefferson, Thomas 8
Johnson, Edward 8
Johnson, N. K. 137
Justice, R. W. 31,49,53,54
Kahun, Egypt 10
Kampffmeyer 17
Kansas 199, 255, 265
Kansas City, Missouri 89, 174, 255, 265
Karachi, Pakistan 58, 59
Karlsruhe, Germany 153
Katabatic winds 152, 182ff, 216, 218
Kata thermometer 168
Keck, George Fred and William 73, 74, 148
Kentucky 146
Ketchum, Gini and Sharp 82, 83, 253, 254
Kimball, Fiske 9, 16
Kimble, George H. T. 160, 177, 183, 256
Kiptopeke Beach, Virginia 255
Kishida, Hideto 18
Kitimat, British Columbia 218
Kivett, Clarence 2, 89, 174, 255
Knochenhauer, W. 144
Kobler, John 77
Koch, H. G. 153
Kratzer, A. 212
Kubler, George 9
Labatut, Jean 53
Labrador, Goose Bay 20
Lafayette, Indiana 67
LaFlesche 6
Lake Maggiore, Italy 100
Lamarche, C. E. 245
Landsberg, Helmut E. 20, 144, 155, 162, 214, 218
Landslides 240
Lapland 226
Latitude, of cities 50-51
and temperatures 133, 134
Lauder, Sir Harry 142
Laurentian Mountains, Quebec 158, 239
Lavedan, Pierre 10, 11, 14
Lazo, Carlos 93, 186
Leaders 227,231,237
Leao, Carlos 84
Lebensold, Fred 73
Le Corbusier 83, 84, 86, 88, 106, 107, 114, 186, 218, 265
Lefeve, B. A. 244
Leggett, Robert F. 259
Leipzig, Germany 270
Lemoyne, Roy 158
Lescaze, William 46, 47, 80, 82, 88
Letchworth, England 17
Levy, Professor 199
Lewis, Harold MacLean 25, 113
Leyden jar 272
Libbey-Owens-Ford Glass Company 53, 55, 68
Liege, Belgium 158
Lift slab 78, 79,80
Lima, Peru 10, 221
Lightning 227, 272ff
Lightning rod 272, 273, 274, 275
Linke, F. 144, 145, 160, 212, 213, 265, 269, 270
Loads, snow 231, 258, 259
Lockridge, Earl B. 244, 264
Lof, G. O. G. 76
London, England 16, 113, 270, 272
London University 199
Longfellow Building 80, 82
Longitude of cities 50-51
Longley, Richmond W. 122, 136, 155, 161, 166
Los Angeles, California 88
Louisiana 7
Louvers, sun 46, 47, 83ff, 204, 218
Loomis Sunshine Analyzer 46, 47
Lowdermilk 249
“Lows” 226
Maas River 158
MacCauley 5
Mackenzie River 4
Mackey, C. O. 171, 172
Madame John’s Legacy 9
Madill, H.H. 25
Magnetigorsk, Russia 17, 211
Maine, Auburn 62, 73
Manitoba 20, 25, 72, 73, 249, 265-267
Manitoba, University of 211
Manley, G. 141
Marly-La-Ville, France 272
Marvin, C. F. 185
Massachusetts 26, 64, 65, 74, 75, 254
Massachusetts Institute of Technology 23, 66, 74, 76, 77
Materials, shape and sun control 104
Maximilian 5
Mayer, Albert 214, 218
McCoy, G.T. 243,264
McGill Observatory 55, 56, 117-120, 122, 124, 126, 162, 163
McGill University 3, 94-96, 98, 105, 153, 159-161, 163, 171, 178, 186, 241, 242, 257-261, 276
Medellin, Colombia 221
Medemblik, Holland 268
Medicine Hat, Alberta 118,135
Mediterranean 240, 253
Mene Grand Oil Company 86, 87
Meuse (Maas) River 158
Mexicans 211
Mexico 9, 93, 186, 187
Mexico, D. F. 93, 186, 187
Miami, Florida 210
Michigan 72, 73, 96, 97, 188, 212, 255
Middleton, W. E. K. 154, 184
Miljutin 17
Millar, F. Graham 154, 184
Miner, Horace 7
Ministry of National Education and Public Health Building, Rio de Janeiro 84
Minneapolis-Honeywell Regulator Company 169, 173
Minneapolis, Minnesota 255
Minnesota 245, 255, 266
Minnesota, University of 68
Mirams, D. G. 18
Mission, Kansas 255
Mississippi River 226, 265
Missouri 89, 159, 255
Missouri River 265, 268
Mitchell, G. W. 80
Moguls 20
Moisture and siting 248
Mollerup, Jens 23
Montana 244, 264
Monte Vipere 211
Monticello, Virginia 8
Montreal, P.Q. 57, 71, 72, 77, 88, 94-96, 107, 117, 119, 120, 122, 124, 126, 127, 129, 132, 136, 153, 155, 159-161, 196- 198, 226, 253, 257, 258, 260, 269, 270
Moody, H.H.G. 25
Moreira, Jorge 84
Morgan’s department store 253
Moscow, Russia 113
Mountains, effect on precipitation 239 temperatures on 8, 134, 135
Mount Fuji, Japan 19
Mount Royal, Montreal 55, 153, 159
Mount Washington, New Hampshire 181
Mumford, Lewis 106
Murondins, les Maisons 107
Muttrich, A. 149
Myers, Ralph E. 2, 89. 174, 255
Niigeli, W. 190
Nagoya, Japan 86, 87
Naismith 80
National City Bank of New York, Nagoya, Japan 86, 87
Near East 10
Nebelkammern machines 269
Nebraska 174
Negros, Philippines 207, 208
Nemeny George 78, 79, 90. 91
Netherlands 210, 267, 268
Neubauer, L. W. 42, 43
Neumark 150
Neutra, Richard J. 88, 89, 101
New Agat, Guam 148
New England 4, 257 (also see states of)
New Hampshire 181
New Jersey 78, 79, 147, 250
New Rochelle, New York 90. 91
New York 90-92. 95, 98, 100, 102, 103, 208, 227, 244, 253-255, 258, 260, 261, 263
New York, N. Y. 20, 57, 88, 107, 260, 261
New Zealand 22
Newfoundland 136, 171, 228 Newland, R. P. 242 Niemeyer, Oscar 84, 86, 88 N0kkentved, Chr. 189, 204 North America 22 colonial architecture 6ff native architecture 3(1 North Carolina 105 North Dakota 244, 264 Northwest Territories 169, 206, 251, 255 Northwestern Mutual Fire Association
Building 88 Norway 20, 21, 60, 257 Nowasibirsk, Russia 17 Nowicki, Matthew 218, 219 Nuremberg, Germany 17,211
Offices, sun orientation 64, 65 Ohio 82, 83 Oka, Quebec 241 Oklahoma 199, 200 Old Testament 10 Olgyay, Aladar and Victor 23, 24 Omaha, Nebraska 6, 174 Ontario 118, 154 Orchards, and frosts 152, 153 Oregon 242, 264 Orientation
baths 11, 14 bedrooms 11 Canada 25 North American Colonial architecture 9 dining rooms 14 factories 26 Japanese 17 libraries 11, 14
according to Palladio 15 with regard to precipitation 251 problems 23 studios 14 sun 62-66, 214, 215 sun-worship 10
according to Vitruvius 1 Iff
with regard to wind in planning 21 Iff . according to Xenephon 11
Orvig, Svenn 257 Osaka, Japan 161 Oslo, Norway 21 Ostnas, Bengt 42 Ottawa, Ontario 22, 118, 206 Overhangs 47, 64, 79ff, 199, 200, 204, 210, 253-255
Padua 15
Pakistan, Karachi 58, 59 Palestine 229
Palladio, Andrea 15, 211 Papadaki, Stamo 83 Parasol septem 224 Paris, France 16, 114, 270, 272 Parker, Alfred B. 210 Parks 213, 216 Parry, M. 161 Passel), Charles F. 168 Paths 260, 261, 262 Peabody, Amelia 76 Pennine Alps 151 Pennsylvania 77, 112, 113, 159, 244, 245, 260, 261, 263, 272, 273
Pennsylvania State College 68, 69, 70 Pennsylvania Station, New York 20 Peppier, A. 153
Persian architecture 20
Persius, Ludwig 25
Peru 10, 221, 224
Peruvians 211
Peterson, C. E. 7
Petrie, Flinders 10
Petterssen, Sverre 176, 182, 185, 228
Philadelphia, Pa. 77, 272, 273
Philippines 207, 208
Phoenix, Arizona 20
Pick, Lewis A. 265
Pickering, England 16
Pilgrims 8
Pittsburgh, Pennsylvania 112, 113, 260, 261
Pizarro, Francisco 10
Plants 94ff
Pleijel, Gunnar 33, 34, 35, 36, 40, 41, 42, 44, 45, 46, 58
Plymouth, Massachusetts and England 8
Pompeii 16
Pondichery, French India 86, 87, 147
Poona, India 138, 142
Port Royal 6
Potomac River 162
Potsdam, Germany 25
Poughkeepsie, New York 227
Powers, Martin B. 244, 264
Precipitation 225ff
annual 232, 233
and design 239
differences due to land and water 240 diurnal variation of 240 effect of altitude on 239
effect of forests on 246, 247, 248
effect of mountains on 239
effect of soils on infiltration and disposal of 248, 249, 250
effect of topography on 239, 240
effect of vegetation on 241, 246, 247, 248
effect on walls 259
maximum in one hour 232, 236
maximum in 24 hours 232, 237 measurements 229ff
number of days of 0.01 inch or more 232, 236
orientation with regard to 251
psychological effect of 239 and seasons 234-235 types 226ff
Pressure, map 180, 181
systems 240
wind on buildings 201ff
Princeton, British Columbia 118
Projections 259, 260
Public Housing Administration 80, 82
Puebla, Mexico 9
Puerta La Cruz, Venezuela 86
Punjab, India 213, 214, 215, 216, 217, 218, 219
Purdue University 67
Quebec 6, 7, 22, 61, 73, 95, 105, 158, 184, 206, 239, 241, 245, 251, 263
Quebra luzes 83
Quebra sol 83
Quito, Ecuador 135
Racicot, J. A. 245, 263
Radiant heat, snow melting 260-262, 278 piping 278
Radiation, as modified by reflection 60 on various exposures 58 at various heights 58 at various latitudes 58, 59 and temperature 171
Rado, Ladislav L. 84, 148, 207, 208, 218 Rain 226ff
cleansing power of 239 gauges 229, 230, 231, 248 Rainfall through forests 246, 247 Ramdas, L. A. 133, 138, 141, 142, 148, 149, 152, 159, 170
Ramps 262 “Ranch-type” buildings 138 Raymond, Antonin 36, 84, 147, 148, 207, 208, 218
Raymond, Eleanor 75, 76
Reader’s Digest Building, Tokyo 84, 85 Recife, Brazil 90 Red River 265 Reed 44
Reflection, sun 100(1 Reidy, Alfonso 84 Relative humidity 166ff, 277 Research councils, list 22 Residences 62, 63, 199, 221, 222 Resolute Bay, Northwest Territories 206 Rey, Augustin 113, 114 Reynold’s number 201, 205 Rhine River 185 Rickmansworth, Herts. 151 Ringland, Arthur C. 241 Rio de Janeiro, Brazil 84, 86, 88 Riverside, Illinois 145 Roads 260, 263
Roberto, Marcelo and Milton 86 Rochester, New York 261
Rochester Gas and Electric Corporation 261
Rockford, Illinois 73, 75, 147 Rockies 135, 218, 229, 239 R0dby, Denmark 189 Rogers, Gerald R. 199 Rogers, Jerry 80, 81, 91, 92 Romans 272 Rome, Italy 16 Roofs 138-140, 196-199, 206-208, 210, 221, 231, 251, 257-259, 265 American Colonial 8 cooling by evaporation 147 design according to Palladio 15 double 147 drying 198, 199 flat 9, 20, 102 gabled 20 gardens 186, 187 grass 186, 187 slopes 204, 205 sloping 23 thatched 9, 20, 21
Rosen, Philip 90
Rosenfield, Isadore 53, 61, 67, 71, 102 Rowley, Graham 4
Royal Institute of Technology, Stockholm 33, 58
Royal Technical College, Copenhagen 204 Royal Victoria Hospital, Montreal 260 Rozier 211
Runways, frost depth under airport 127 Ruskin 3 Russia 17,113,135,211 Rye, New York 253, 254
St. Ann’s Church 255 St. George, Bermuda 164
St. John’s, Newfoundland 136 Raymond 36 dew-point 130-131
St. Lawrence River 257 Swedish 33 diurnal cycle of 140-143
St. Louis, Missouri 159 U.S. Navy navigational chart 36, 37, dr)- adiabatic lapse rate of 134, 137
St. Paul, Minnesota 265, 266 dry and wet bulb 167
San Antonio, Texas 79, 80, 81, 91, 92, 199 Solar energy 53 effective 166, 167
San Francisco, California 67, 68 Solar heating 210 effect of color on 163ff
San Pedro Columbia, British Honduras 21 Solar house 66ff equivalent 173
Sand-sweep 206 Solaranger 42, 43 influenced by vegetation 149
Saskatchewan 191, 193 Solarscope, Australian 39, 40 inversions 159, 186
Saturated air 226 Solar shadow trace diagram 31 and latitudes 133, 134
Schanderl, H. 107 Solar shadowgraph chart 32 maximum 118, 119, 130, 131
Schinkel 25 South Africa, Union of 22 maximum recorded 122, 123, 130, 131
Schmidt, Wilhelm 153, 160, 212 South America, colonial architecture 10 mean daily range of 162
Schools 62, 63, 64, 102, 103, 199, 200 South Seas 10 minimum 119, 130, 131
Schubert, J. 150 Spanish in North America 9 minimum recorded 122, 123, 130, 131
Schwagenscheidt, Walter 107 Sri Aurobindo Ghose Dormitory 86, 87 over paved surfaces and sod cover 143
Scotland 151 Staples, N. A. 244 over snow 148
Screens 19,93ff Stein, Clarence S. 214 over sod 142
Sert, Jos6 Luis 10, 91, 92, 93, 208, 221 Stephen, Fitz 16 over towns 153ff
Severud, Fred N. 80, 83 Steps 262 over water 146, 147
Severud, Elstadt and Krueger 83 Stevenson, J. M. 146 per cent 130-131
Sewers 262, 264 Stevenson screen 117,148 profiles 153ff
Shakespeare, William 281 Stewart, James T., and Co. 80 profiles through snow 256
Shelley, Percy Bysshe 226 Stoker, O. 168 recorder 70
Shelterbelts 189ff, 242, 245 Stonehenge, England 10, 11 and related phenomena 166ff
Shingles, roof 15 Stores 64, 65, 254 resultant 173
Shoppers’ World 254 Streaks on walls 259 reversal or inversion 138
Short and Mason, Ltd. 177 Streets 163,213, 260,263 sensible 168
Shreve, Lamb and Harmon 261 Stubbins, Hugh, Jr. 64, 65 in soils 140ff
Shutters 90, 91 Sturges home, Los Angeles 47 sol-air 171, 172
Siberia 135 Stuttgart, Germany 212 and topography 15 Iff
Sidewalks 260-262 Sudare screens 19, 93 town and country 160ff
Siple, Paul A. 31, 73, 130-132, 168-170, SUI 100 Tennessee 149, 188, 248
, 278, 280 Sullivan, Louis 3 Texas 62, 79-82, 91, 92, 197, 199
Site selection 12, 133 Sun 28-114 Texas Engineering Experiment Station 197,
Siting and moisture 248 angle calculator 53, 55
Skylights 227 baffle 91, 92 Texas, University of 44, 201, 202, 203, 204
Sleet 227, 239 beneficial qualities of 61 Thermal analysis, Paul Siple 130-131
Smith, Forrest 265 breakers 83 Thermometers 116, 117
Smith, Harvey 80, 81 declination 48 Thorfinnson, M. 195
Smog 158, 159, 160, 163, 213, 218, 221, definition 27 Thomthwaite, C. Warren 147, 250
, 270 effect on earth 28 Thrift, Eric 267
Smoke 158, 159, 160, 163, 216, 218, 221 heat gain 57 Thunderstorms 227, 237, 272
candle 199 louvers 83ff Tichy, Lester D. C. 255
Smoke, Hubert R. 139 methods for recording position 28-55 Time, civil and standard 49, 52
Snow 226ff worship 10 daylight 52
blowing 263 Sun Life Assurance Company of Canada sun 48
catch 194, 245, 246 Building, 196-198, 201, 269, 270 Tinfoil 164
cover, average annual days 237, 238 Sundial, The Little 40, 41, 42 Tokyo, Japan 84, 85, 161
drifts 3, 239 Sunshine Analyzer, Loomis 46, 47 Topography, effect on precipitation 239,
fences 242ff Super blocks 214, 215, 216, 217, 218, 219
formations and wind flow 186 Sweden 17, 22, 33, 42, 44-46, 58, 59, 257 and temperatures 151ff
gauges 230, 231 Swift Current, Saskatchewan 191 and wind 182ff
insulation 239, 256 Swifton Shopping Center 82, 83 Toronto, Ontario 154
loads 231, 258, 259 Switzerland 20, 21, 22, 60, 190 Toronto University 25
plowing 263 Synagogue 2, 174 Tower Company, Ltd. 250
shield 257 Town laws 9
temperatures over 148 Taconic State Parkway 227 Town planning, Aristotle 10
temperature profiles through 256 Tecton 198 England 17
trap 194 Telkes, Maria 66, 74-76 Russia 17
weight of 258, 259 Temperatures Sweden 17
Snowfall, average annual 232, 238 and altitudes 134 Vienna 17
through forests 246, 247 average annual 118, 130, 131 Town Planning Associates 208, 209, 221,
Snow-melting 247, 260, 261, 262 average annual maximum 120, 121 , 224
Sod, temperatures over 142 average annual minimum 120, 122 Transite 105
Soils, effect on infiltration and disposal of average diurnal cycle 123, 124, 133, Transpiration of trees, etc. 250
precipitation 248, 249, 250 , 147 Traquair, Ramsey 6, 7
influence of color on temperatures 142 average of extreme highest and lowest Trees 94ff, 206
thermal characteristics 140ff effect on precipitation 246. 247
and trees 250 coincidence of with wind directions and evaporation 147
Sol-air temperature 171, 172 lightning rods on 274, 275
Solar design charts, Baker-Funaro 38 daily mean 119 for snow catches 245, 246
Kayess 33 definition 114 and soils 250
transpiration 250
and windbreaks 189ff, 242
Tribuna Popular, Rio de Janeiro 88
Trinidad, B.W.I. 210
Trinity University 80, 81
Trivandrum, India 19
Trondheim, Norway 21
Tropics 239
Truman, Harry S. 265
Typhoons 207
Tuberculosis 61
Tumaco, Colombia 221, 222, 224
Tupik, Eskimo 4
Ultraviolet 100 fl
United Kingdom (see England, etc.)
Upslope winds 185
U.S. A.,Building Research Advisory Board 23
Bureau of Standards 23, 52, 117
Department of Commerce 273
Naval Observatory 52
U. S. S. R. 17,113,135,211
Valais, Switzerland 21
Vancouver, British Columbia 218
Vapor, barriers 277
pressure 277
Varro 12
Vasconcelos, Ernani 84
Vegetation, effect on precipitation 241, 246,
247, 248
and temperatures 149
Venerable Mere Marie de 1’Incarnation 6, 188
Venezuela 31, 86, 87, 208, 209
Ventilators, ridge 210
Verandahs 7
Verrill, A. Hyat 4
Vezey 44
Victoria Hall, Westmount, P.Q. 95
Vienna, Austria 17, 153, 211, 269
Vines 94ff
Virginia 5, 8, 162, 255
Virginia Ferry Corporation 255
Vitruvius 1 Iff, 20, 211
Voorhees, Walker, Foley and Smith 86, 87, 208, 210
Voysey 25
Waldron, Leo J. 139
Walker, John 191, 192, 245
Walks, covered 224
effect of precipitation on 259
latticed 20, 21
stone, Quebec 6, 7
Washington 242, 264
Washington, D. C. 80, 82, 113, 155, 162,
258, 264
Water, flow 241, 257
influence of on temperature 135
run-off 241, 257
Waterproofing 277
Weather maps 180, 181
Weatherstat 173, 174
Weir, E. T. 89
Weigel, Reichstrat 17
Welch, Kenneth C. 72, 73, 96, 97, 164, 165
Wellesley, Massachusetts 64, 65
Welwyn, England 17, 211
West Indies 7, 91, 92, 164, 210, 240
Westmount, Quebec 94, 95, 156, 184, 263
Wiener, Paul Lester 10, 91-93, 148, 208
221, 222, 224
Whirls 189, 206
Whittick, Arnold 25, 112
Whittlesey, Julian 214, 218
Wild cup 146
Willie-willies 207
Wind 175ff
around buildings 196ff
chill 168, 169, 170, 174, 187
cold air flow 183ff
and design 179ff
diurnal variation 181, 182, 183
downslope 182ff
eddies 196ff
effect of forests 187ff
effect of great altitudes 181, 182 effect of ground surface 186, 187 effect of height 186, 187 effect of vegetation 187ff flag analysis 197, 198 geostrophic 180 gustiness recorder 178 katabatic 152, 182ff, 216, 218 local and regional 177 macroclimatic 179ff mean 179 measuring 176ff and planning 21 Iff pressure on buildings 20 Iff smoke analysis 176, 197, 199 speed 176, 177 and temperature 166ff upslope 185 vane 176 warmth 170
Windbreaks 189ff, 242, 245 Windmills 210, 211
Windows 199, 200, 204, 206, 255, 260, 276 277
Window tax 66
Winnipeg, Manitoba 20, 25, 72, 73, 265 266, 267
Wisconsin 183 Woelfle, M. 190 Woodner, Jonathan 83 Woodmere, New York 91, 98, 100 Worcester, Massachusetts 26 Wright, Frank Lloyd ix, 25, 47 Wright, Henry 57, 91 Wright, H. Myles 22, 62, 111 Wright, L. T., Jr. 171, 172 Wurster, William Wilson 53, 80 Wycherley, R. E. 11
Xenophon on house orientation 11
Youtz-Slick lift slab 78, 79, 80 Yukon 135
Zon, Raphael 187, 188, 191, 246-248

I PROGRESSIVE ARCHITECTURE LIBRARY
Rosenfield ch Hospitals
Abel & Severud on Apartment Houses
Baker & Funaro on Shopping Centers
Morris Ketchum, Jr., on Shops and Stores
Perkins & Cocking on Schools X V-.
Burris-Meyer & Cole on Theatres and Auditoriums
Kennedy on The House
Thiry, Kamphoefner, & Bennett on Churches & Temples
IN PREPARATION (November 1953):
Hotels and Hotel Rem Industrial Buildings, C Clinics, Recreation Bui
REINHOLD QUALITY BOOKS
Reinhold, worlds largest publisher of architectural books, continues to expand the program that brings you valuable books of high quality the kind you are proud to own.
The Progressive Architecture Library is one example in the extensive Reinhold list. This series is on building types. Each title is carefully planned to include accurate, up-to-the-minute information on its subject information enormously enhanced by hundreds of photographs and drawings that will be of real value to the practicing architect and to all others in fields allied to the subject. Thus, our book Schools by Perkins and Cocking not only tells the architect all the problems involved in planning schools but helps school administrators to understand the whys and wherefores of successful modern school design. In checking the list at the right, you may recognize that the authors are men of reputation who know their subjects intimately. Quality of subject matter and authorship are essential but these books are also beautifully designed and handsomely produced. Engravings, paper, type faces, printing and binding are the finest available and all books individually designed so they function as an aid to the architecture the books discuss. Since these books include plans of large buildings, most of the books are 9"xl2" in size but sometimes vary in keeping with the subject matter.
Those who know Reinhold books best agree that they are invaluable in order to keep up with the latest complete information in the design fields. To keep abreast of the latest developments in design, technical information, criticism, and all other phases of architecture, the profession looks to Reinholds magazine Progressive Architecture which enjoys the “largest architectural circulation in the world.”
Send for complete information on all Reinhold Books to:
REINHOLD PUBLISHING CORPORATION, 330 WEST 42nd STREET, NEW YORK 36, N. Y.
Also publishers of Materials & Methods, Scientific and Technical Books, Chemical Engineering Catalog, Chemical Materials Catalog, and Advertising Management for the American Chemical Society Publications.
Vitruvius greatly influenced other writers of the day, notably Plinius, who sometimes copied entire paragraphs, like these. ↩︎
Grangers footnote: "Vitruvius follows Varro, de re rustica (On Farming), I, XII, 2, who says that in marshy places, minute and invisible animals grow and cause diseases. The anticipation of the true cause of malaria (mosquitoes) is noteworthy.” ↩︎
Granger’s footnote Io this is: ‘ ‘Vitruvius had probably experienced the Mistral al Marseilles.’’ ↩︎
Lucio Costa, Oscar Niemeyer, Alfonso Reidy, Carlos Leao, Jorge Moreira, Ernani Vasconcelos. ↩︎
Snow will also colled in this type, but only at the bottom. There will be a small area of hot air at the top, especially in summer; however, it is not as great as in the horizontal overhang, where it is duplicated under each blade. ↩︎
Garrett Eckbo, Landscape for Living, Neu York: Architectural Record with Duell Sloan, and Pearce Copyright 1950 by F. W. Dodge Corporation. ↩︎
Even in Montreal on December 22, the sweep is 110°. The 90° figure occurs in more northern latitudes; the right angle is used in this argument merely to avoid exempliary complications. ↩︎
To convert Fahrenheit temperatures into centigrade, or vice-versa, the following formulas may be used:
F = g C + 32 C = HF ~ 32) ↩︎
By U. S. Weather Bureau, or Meteorological Division, Department oj TransportCanada: or perhaps by The House Beautiful Climate Control Project in Analyses and Design Data, published in the Bulletin of, and Copyright by the American Institute of Architects.
The average annual maximum temperature is an average of the maximum temperature each year over a period of years. Thus there is one maximum each year. In 25 years there are 25 maxima. The mean of these 25 maxima represents the average annual maximum temperature for the given location.
The isotherms of average annual maximum temperature for the United States are shown in Figure 143.
The average annual minimum temperature is an average of the minimum temperature each year over a period of years, recorded in the same fashion as the average of the annual maximum temperature.
The isotherms of average annual minimum temperature for the United States are shown in Figure 144. ↩︎
“A process is said to be adiabatic when no heal is added to, or withdrawn from, the air that partakes in the process . . . This is the same as saying that the air coolswhile it expands and heals up when it contracts in an adiabatic process.” By permission from Introduction to Meteorology, by Svcrre Pellerssen. ↩︎
Kimble and Bushs footnote: “The lake breezes on Door Peninsula, Wisconsin seldom penetrate inland more than a mile or so. In parts of the world where the land-sea temperature contrast is very greatin Egypt, for example sea breezes have been known to penetrate 40 to 50 miles inland, and to reach gale force at times (e.g., at Valparaiso.)”
This is approximately 3 miles per hour. Geiger confirms this, and Middleton and Millar report a similar figure from Toronto in the Journal of the Royal Astronomical Society of Canada-. “While descending the hill on the northward run, it became necessary to stop the car for a moment. The fog produced by the driver’s breath showed that the wind was two or three miles an hour down the hill, i.e., in a direction opposite to that of the general wind.” Such a wind speed might be just about right in the summer for architectural purposes, but it must be remembered that a side catching this wind may be considered unfavorable in the winter months.
The existence of katabatic winds on the sides of hills has been verified by the author. In the course of the temperature experiments at nights along Victoria Avenue, Westmount, Quebec, observations of the wind were taken. The results are best typified by the flow of air on the night of March 13, 1951, which are shown in Table 49.
In the area in question, those desiring winds from the south all day long from the macrodimatic wind by day and the microclimatic by night should site their dwellings on the north side of Westmount. Provided there are no other influences, such as the presence of many other buildings or trees, which would deflect the wind in other manners, the condition -will probably hold true throughout the year.
The consequence of katabatic influence in a valley is that stronger winds are usually produced. Geiger terms these as “down-valley” winds. “They are made up of two parts, differing in origin. The one is a downslope wind all along the valley floor, which is fed from the side slopes; the other is a wind resulting from the pressure difference between mountain and plain just as the ocean breeze in its macrodimatic scope is dependent on the contrast of sea and land.” How he illustrates his remarks is shown in Figure 183.
The diagram shows the normal nocturnal down-valley winds that may be expected. The finely dotted region indicates the area of ↩︎
The ignition of gasoline will disperse fogs. This has often been employed over airfields but is considered impractical as far as architectural purposes are concerned. ↩︎
According to an Associated Press article appearing in the New York Times, Saturday, April 26, 1952, Dr. I. Bernard Cohen said that Franklin sent up his kite in June, 1752, just one month after the French experiments. But Cohen also remarked, as described in this article, that Franklin “appears" to hate been the first to put lightning rods to practical use in protecting buildings. He said, furthermore, according to this report, that “new" evidence indicates that Franklin erected two lightning rods on Philadelphia buildings in June and early July, 1752. ↩︎